Physics 9702/53 — October/November 2019
Cambridge A-Level · Planning, Analysis and Evaluation · worked solutions for every part, with the mark scheme
Topics Analysis, Conclusions and Evaluation · Planning
When a light plastic ball is placed in a vertical column of moving air, the ball becomes stationary at a height , as shown in Fig. 1.1.
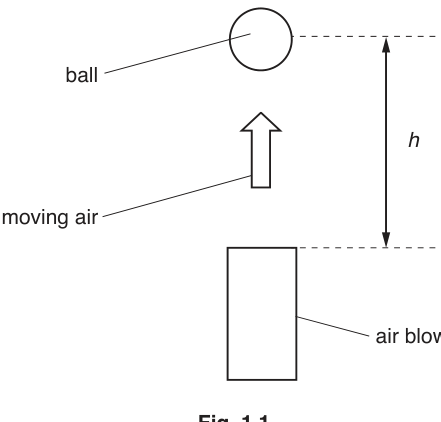
A student is using an air blower to create the vertical column of moving air. The student connects the motor of the air blower to a d.c. power supply.
It is suggested that the relationship between the radius of the ball and is
where is the acceleration of free fall, is the power of the motor and is a constant.
Design a laboratory experiment to test the relationship between and .
Explain how your results could be used to determine a value for .
You should draw a diagram, on page 3, showing the arrangement of your equipment. In your account you should pay particular attention to:
- the procedure to be followed
- the measurements to be taken
- the control of variables
- the analysis of the data
- any safety precautions to be taken.
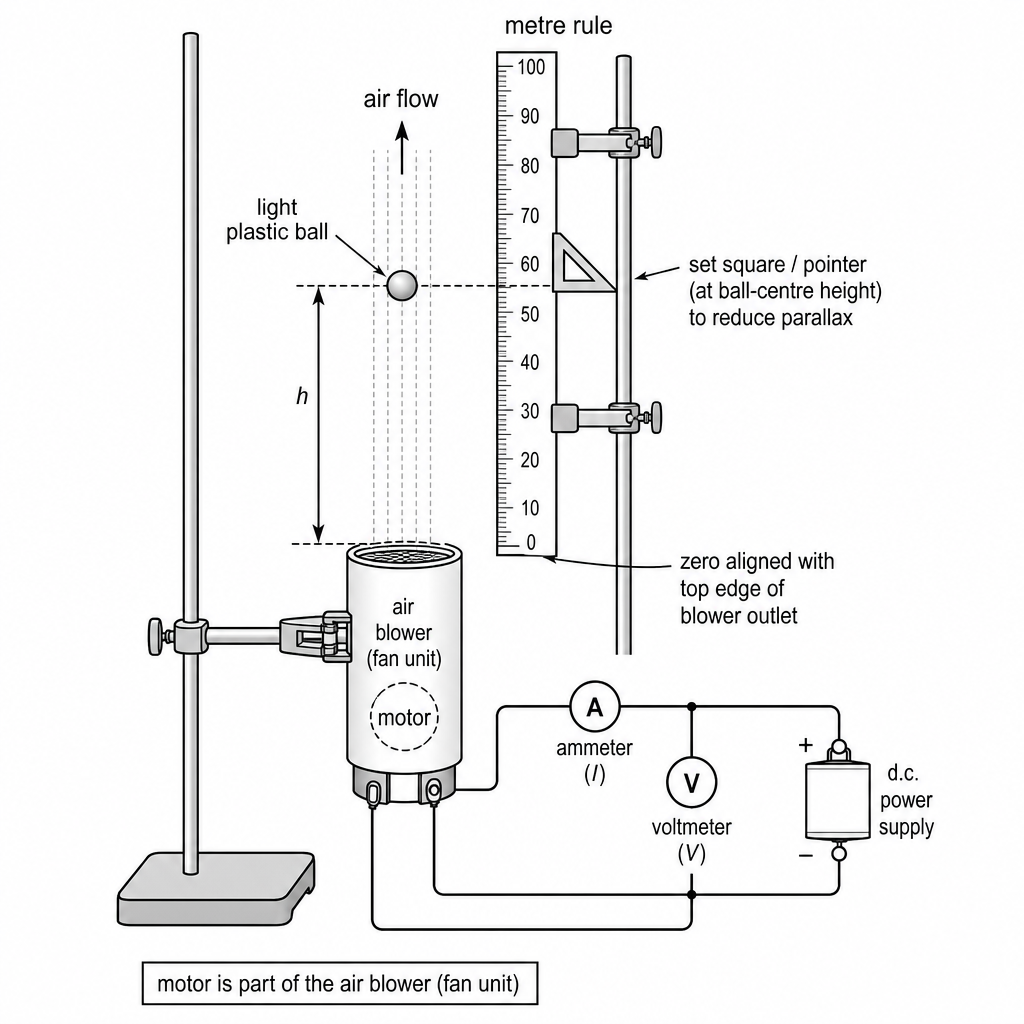
Diagram
Procedure and measurements
- Use a vertical air blower clamped so its outlet is vertical and fixed throughout.
- Connect the blower motor to a d.c. supply; include an ammeter in series and a voltmeter across the motor.
- Use several light plastic balls of the same type but different radii .
- Measure the diameter of each ball using vernier calipers (or micrometer) in at least two perpendicular directions; take the mean and calculate
- For a chosen ball, set a value of p.d. across the motor and allow the ball to reach a steady stationary position.
- Measure the height from the top of the blower outlet to the centre of the ball using a vertical metre rule (use a set square/pointer to reduce parallax). Record .
- Record and and calculate the motor power
- Repeat for at least 5 different values of for the same ball.
- Repeat the whole set for at least two other radii (and repeat readings for reliability).
Control of variables
- Keep the same blower, outlet size/shape and orientation.
- Keep the ball material the same (same density/roughness) so only changes.
- Keep the measurement reference point fixed (top of outlet to centre of ball) and minimise drafts.
Analysis of data (test relationship and find )
From
calculate for each reading
Plot (vertical axis) against (horizontal axis).
A straight line through the origin confirms .
The gradient is
(Alternatively, calculate for each reading and take a mean; check that is independent of .)
Safety
- Secure the blower and metre rule with clamps; keep fingers/hair away from the fan/air intake.
- Do not exceed the motor rating; switch off between runs to avoid overheating.
- Use a low-voltage d.c. supply and avoid touching exposed terminals.
See working
Background Concept
The ball becomes stationary when the upward force from the moving air balances its weight. The suggested model links the ball radius , the equilibrium height , and the motor power :
Here is the volume of a sphere (so the left-hand side contains a factor proportional to volume), is constant, is the electrical power delivered to the motor, and is a constant for the system (expected to be the same for all balls if the model is correct).
To test a proposed relationship experimentally, you typically:
- identify which variables you can vary and measure reliably,
- control other factors that could change the outcome,
- rearrange the relationship into a linear form and use a graph to check for a straight line and determine the constant.
A crucial practical point: motor power is not read directly; for a d.c. motor you can estimate input electrical power using
where is the potential difference across the motor and is the current through it.
Understanding the Question
You must design an experiment where:
- you change the radius of the ball (by using different balls),
- you measure the height at which each ball becomes stationary in the air column,
- you measure (or calculate) the motor power ,
- you use your measurements to test whether the equation fits the data,
- you explain clearly how to obtain a value for .
The diagram in the question shows measured vertically from the blower outlet to the centre of the ball, so your measurement method should match that definition.
Approach
A robust way to test the relationship is to make the equation look like the straight-line form :
where
So if the relationship is correct, a plot of against should be a straight line through the origin with gradient .
Practical strategy:
- Use several balls (different ) and, for each ball, take several readings at different powers by adjusting the d.c. supply.
- For each reading, measure , record and , compute , then compute .
- Combine all data on one graph of vs : if all points (from different radii) lie on the same straight line through the origin, the model is supported and is the gradient.
Step-by-Step Reasoning
- Set up the air column and electrical measurements
- Clamp the blower so it does not move (movement changes the reference for and can change the flow).
- Put an ammeter in series with the motor circuit and a voltmeter across the motor. This allows for each setting.
- Choose and measure the balls (the measurement)
- Use balls made of the same material and similar finish but different sizes. This is important: if you used different materials, changes in density/drag behaviour could change even at the same .
- Measure the diameter with vernier calipers/micrometer. Because balls are not perfectly spherical, measure in two perpendicular directions and average.
- Calculate the radius:
- Collect data for a range of
- Put the ball into the air stream.
- Adjust the d.c. supply until the ball becomes stationary at a steady height (not oscillating significantly). Wait a short time for it to stabilise.
- Measure from the top of the blower outlet to the centre of the ball. Reduce parallax by reading the metre rule at eye level and using a set square/pointer aligned to the ball centre.
- Record and and compute
- Repeat for at least 5 different powers for the same ball to give a good spread of points on a graph.
- Repeat the whole set for other radii.
- Process the data into the required form
For every row of results, calculate
You can now test the relationship by graphing against .
- Graph and determine
- Plot on the vertical axis and on the horizontal axis.
- Draw a best-fit straight line.
- If the line is (approximately) straight and passes through the origin within scatter, it supports the proportionality .
- The gradient gives :
Using many points and a best-fit line is better than calculating from one pair of readings, because it reduces the impact of random measurement error.
- Controls and fair test
Key controlled variables (and why they matter):
- Blower and outlet geometry fixed: changing nozzle size or orientation changes air speed profile, affecting levitation height.
- Ball material/surface the same: drag and stability can depend on surface texture and density.
- Reference level for fixed: always measure from the same point on the blower outlet.
- Environment: avoid drafts and keep the set-up away from open windows; drafts can alter the ball position.
- Safety
- Clamp equipment securely to prevent the blower tipping.
- Keep fingers/hair away from moving fan parts and the air intake.
- Use a low-voltage supply and do not exceed the motor’s rated voltage/current; switch off between runs to prevent overheating.
Key Takeaways
- A planning question is about: clear variables, reliable measurements, control of variables, and a graph-based test.
- Convert the given relationship into a linear graph form (here ).
- Measure motor power using and extract the constant from the gradient.
Common Mistakes
- Not measuring (or treating the power supply setting as “power”): you must use measured and because the motor load changes with airflow.
- Only varying at one power: that tests only at fixed ; it gives a weaker test than using a range of and a straight-line graph for .
- Measuring to the top of the ball instead of the centre (inconsistent with the defined ).
- Not controlling ball material/surface: different drag behaviour can masquerade as a change in the constant.
- Forgetting repeats: single readings can be affected by oscillations or reading error.
Things to Be Careful About
- Steady height: take readings only when the ball is stationary (or take several readings and average) because fluctuations increase uncertainty in .
- Parallax: is easy to misread; a pointer/set square improves accuracy.
- Electrical readings: ensure the voltmeter is across the motor (not across the supply leads with significant lead resistance) and the ammeter is in series.
- Units and consistency: use SI units in calculations ( in m, in m, in W) so that the computed has consistent units.
- Graph gradient: use a large triangle and compute (not from one point) to minimise gradient uncertainty.
The rest of this paper
1 more questions- Q2Analysis, Conclusions and Evaluation15M