Physics 9702/52 — May/June 2019
Cambridge A-Level · Planning, Analysis and Evaluation · worked solutions for every part, with the mark scheme
Topics Analysis, Conclusions and Evaluation · Planning
A student is investigating the stability of a wooden block resting on a bench.
A strip is attached by a nail to the centre of the top of the block and is able to rotate, as shown in Fig. 1.1 and Fig. 1.2.
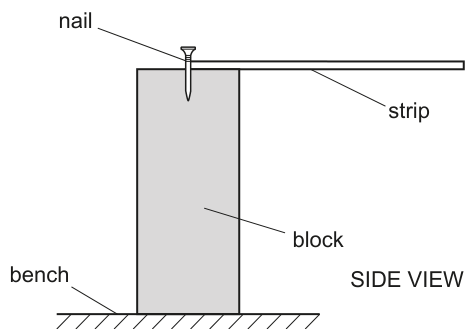
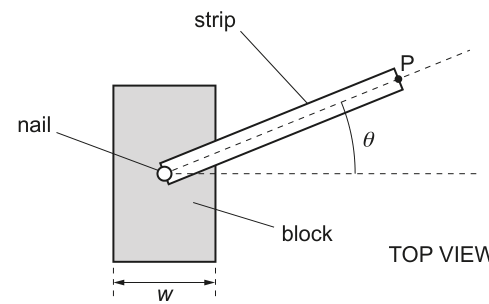
A load of mass is attached to the free end of the strip at point P. The student is investigating the position of the strip indicated by angle , as shown in Fig. 1.2, at which the block just topples.
It is suggested that the relationship between and is
where is a constant, is the volume of the block, is the width of the block and is the distance between the centre of the nail and the centre of the load.
Design a laboratory experiment to test the relationship between and .
Explain how your results could be used to determine a value for .
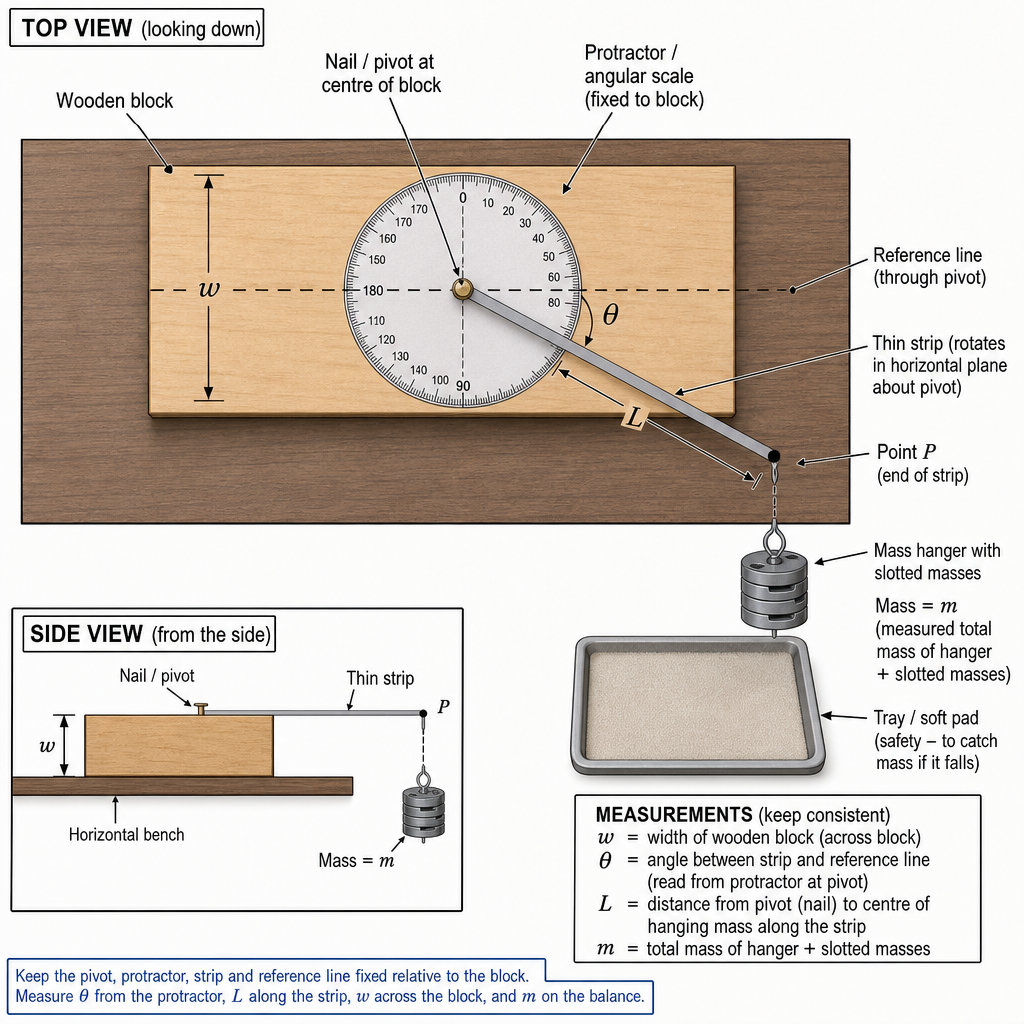
You should draw a diagram, on page 3, showing the arrangement of your equipment.
In your account you should pay particular attention to:
- the procedure to be followed
- the measurements to be taken
- the control of variables
- the analysis of the data
- any safety precautions to be taken.
Answer
Variables
- Independent variable: load mass .
- Dependent variable: angle at which the block just topples.
- Controlled variables: block dimensions (so and constant), distance (pivot to centre of load) constant, same bench/surface and block position, strip fixed to same nail/pivot.
Apparatus
Wooden block, thin strip pivoted at the centre of the top by a nail, mass hanger + slotted masses, metre rule/vernier calipers, protractor/angle scale (top view), marker/tape, tray/soft pad to catch masses.
Procedure and measurements
- Measure block dimensions and calculate
Measure and record.
2. Mark a point on the strip such that the distance from the nail to the centre of the hanging load is fixed at ; measure with a ruler.
3. Place the block on a level bench. Set by adding slotted masses to the hanger at .
4. From the top, slowly rotate the strip and note the angle (from the reference line shown in the diagram) at the instant the block just begins to topple (one edge just lifts / tipping begins).
5. Repeat step 4 at least twice for the same and take the mean .
6. Repeat for at least 6 different values of over a wide range.
Analysis of data and determination of
Given
Rearrange:
Divide by :
For each reading calculate and .
Plot graph of (y-axis) against (x-axis).
- Gradient
- Intercept
Hence
Safety precautions
- Use a tray/soft pad below the hanger to catch falling masses.
- Keep feet/hands clear of the falling masses and the toppling block.
- Do not use excessively large masses; ensure the bench area is clear and stable.
See working
Background Concept
A block topples when the line of action of the resultant downward force passes through the edge (pivot line) about which it tips. In practice, the “just topples” condition is identified by the instant one edge just begins to lift.
The question provides a suggested relationship linking the load mass and the toppling angle :
Here is an unknown constant. and depend only on the block dimensions, and is a fixed distance set by where you attach the load.
To test a relationship experimentally, we vary one variable (here ), measure the other (), and then analyse the results in a way that should produce a straight line if the equation is correct. A straight line also lets us obtain constants from a gradient/intercept.
Understanding the Question
You must design a practical method to:
- change in controlled steps,
- measure the angle at the instant the block just topples,
- keep , , and constant,
- process the data to check whether the suggested equation fits,
- and explain how to find from your results.
The apparatus is essentially: a wooden block on a bench, a strip pivoted at the centre of its top, and a hanging mass at a fixed point on the strip. The strip is rotated in the horizontal plane, and you read in the top view.
Approach
- Set constants: Measure the block dimensions to compute , and measure . Choose a point on the strip so the load is always a fixed distance from the nail.
- Collect data: For a range of masses , find the corresponding “just topples” angle . Repeat and average to reduce random uncertainty.
- Linearise the relationship to the form so that a graph can be plotted. A good choice is to make the dependent variable because the equation already contains .
- Determine from the gradient (and optionally check consistency using the intercept).
Step-by-Step Reasoning
1) Setting up and measuring fixed quantities
- Measure the block length , width , and height with a ruler (or vernier calipers for better precision).
- Calculate volume:
- Mark point on the strip so that the centre of the hanging load is always at the same distance from the nail. Measure this distance and record it as . Keeping constant is crucial because it appears in the formula.
A clear apparatus layout also helps you measure consistently.
2) Measuring the toppling angle for each mass
- Attach a mass hanger at and add slotted masses to set .
- Rotate the strip slowly from a reference direction. The slow rotation reduces overshoot (missing the exact instant of toppling).
- The “just topples” condition is the instant an edge just begins to lift / the block begins to tip.
- Read using a protractor fixed relative to the block/bench so the reference line is repeatable.
- Repeat the measurement for the same (e.g. 3 repeats) and take the mean .
- Do this for at least 6 different masses spanning a wide range (so spans a wide range, improving the gradient determination).
3) Linearising to a straight-line graph
Start from the suggested equation:
Bring the term to the left:
Divide by :
This is in the linear form with:
- gradient
- intercept
So, for each data point you calculate from your measured , and calculate from your chosen mass.
4) Extracting
From the gradient definition:
Rearrange:
So once you have the best-fit straight line and its gradient , you substitute your measured , calculated , measured , and the gradient to obtain .
A useful extra check (not required but good practice) is that the y-intercept from the graph should be close to using your measured and .
Key Takeaways
- Planning marks come from a clear method: what you vary, what you measure, and what you keep constant.
- Converting a model to a straight-line form is the standard way to test it and to determine constants.
- Here, plotting against should give a straight line if the suggested relationship is correct.
- The constant is obtained from the gradient using algebra.
Common Mistakes
- Not keeping constant (moving the load position when changing masses).
- Plotting the wrong variables (e.g. plotting vs directly, which does not linearise the equation).
- Forgetting to use and trying to fit the original equation without linearisation.
- Not stating how “just topples” is identified (must describe the observation criterion).
- No repeats/averages for , leading to large scatter.
- Omitting units for measured lengths and masses.
Things to Be Careful About
- Use in and lengths in for consistency when calculating .
- Ensure the angle reference line is fixed and consistent (mark a line on the block/bench).
- Read the protractor carefully to avoid parallax; rotating slowly reduces the chance of overshooting the toppling point.
- Make sure the hanging mass is free (not touching the bench) and hangs vertically so its position is well-defined.
- Choose masses that cause toppling at measurable angles (avoid angles too close to or where toppling becomes sudden and hard to judge).
The rest of this paper
1 more questions- Q2Analysis, Conclusions and Evaluation15M