Physics 9702/52 — February/March 2017
Cambridge A-Level · Planning, Analysis and Evaluation · worked solutions for every part, with the mark scheme
Topics Analysis, Conclusions and Evaluation · Planning
A student is investigating the speed of a vehicle on a track when a small ball is projected into the vehicle, as shown in Fig. 1.1.
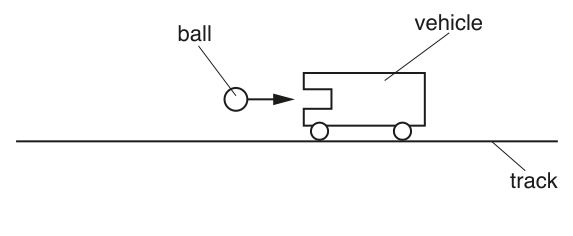
The ball is projected towards the vehicle by a compressed spring. It is suggested that the relationship between the speed of the vehicle and its mass , after the ball embeds itself in the vehicle, is
where is the mass of the ball, is the spring constant and is the compression of the spring.
Design a laboratory experiment to test the relationship between and . Explain how your results could be used to plot a graph with on the -axis and to determine a value for . You should draw a diagram, on page 3, showing the arrangement of your equipment.
In your account you should pay particular attention to
- the procedure to be followed
- the measurements to be taken
- the control of variables
- the analysis of the data
- any safety precautions to be taken.
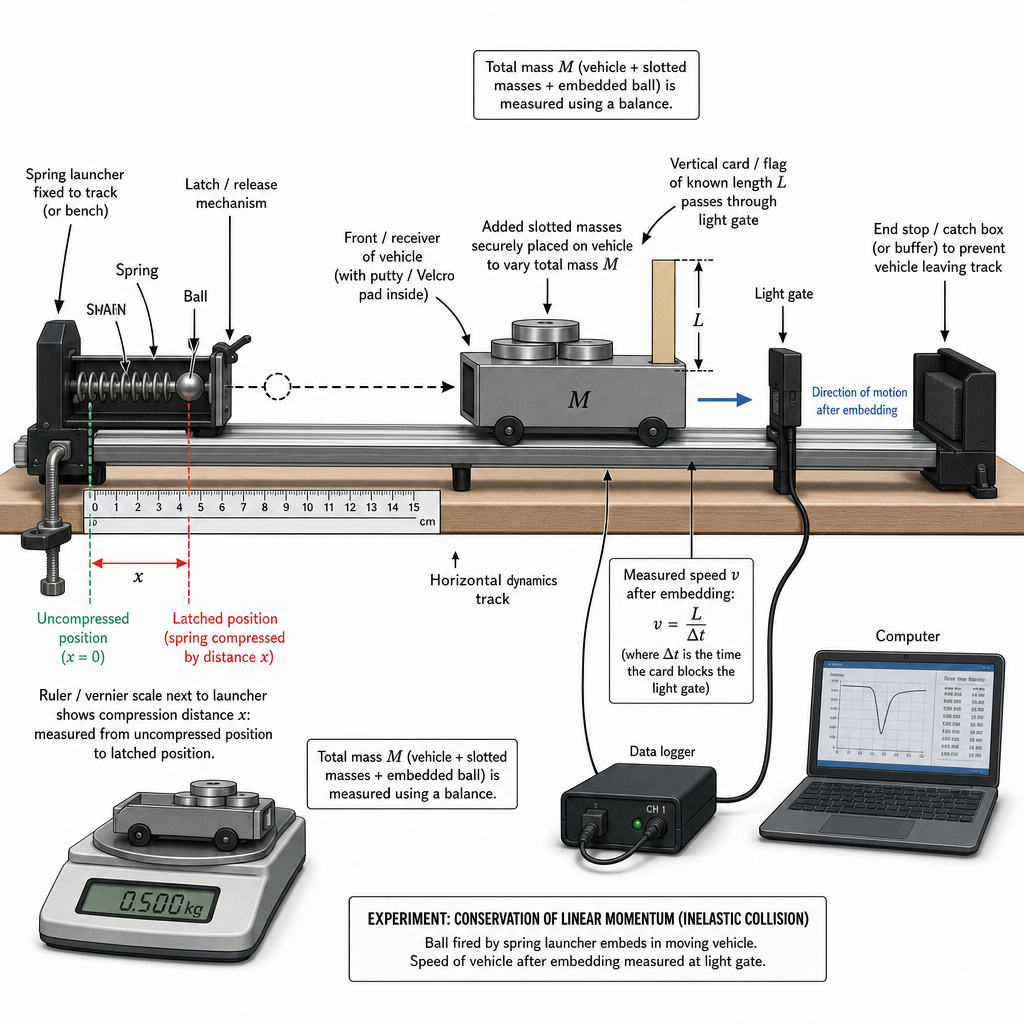
Variables
- Independent variable: total mass of vehicle (add known masses).
- Dependent variable: speed of vehicle immediately after the ball embeds.
- Control: same ball (constant ), same spring and same compression , same track (level), same launch position and alignment, same method ensuring the ball embeds (no rebound).
Apparatus
Dynamics track + trolley/vehicle, ball, spring launcher with latch, metre rule/vernier to measure , top-pan balance for and , light gate(s) + data logger, card/flag of known length on vehicle, additional masses, end-stop/catch box.
Procedure / measurements
- Measure mass of ball using a balance.
- Set track horizontal (adjust until trolley does not roll when released).
- Attach a card of length to the vehicle; place a light gate just after the collision region so it measures speed after embedding.
- Set spring compression to fixed (measure from uncompressed position with a ruler/vernier); latch and release in the same way each time.
- For a chosen added mass, measure total vehicle mass (vehicle + added masses) using a balance.
- Fire ball so it embeds in the vehicle; record from light gate using (where is the gate blocking time).
- Repeat at least 3 times for each and average .
- Repeat for at least 6 different values of .
Analysis
From
rearrange to
Calculate for each and plot a graph of (y-axis) against (x-axis).
Gradient
so
(Intercept gives as a check.)
Safety
Wear eye protection; keep hands/face away from the launcher; use a stop/end-buffer to prevent the vehicle leaving the track; ensure the ball is caught/contained after use; secure added masses to the vehicle so they cannot fall off.
See working
Background Concept
The spring stores elastic potential energy when compressed. For an ideal spring,
where is the spring constant and is the compression.
In this question you are given (so you do not need to derive) the proposed relationship linking the spring compression to the speed of the vehicle after the ball embeds:
This has the structure “constant (\times x^2)” equals “(total moving mass) (\times v^2)”. To test such a relationship experimentally, you vary one quantity (here ), measure the response (here ), keep other factors fixed (, ), and then look for a straight-line graph after rearranging to linear form.
Understanding the Question
You must design a workable lab experiment to test how the final speed depends on the vehicle mass when the same ball (mass ) is fired into it by the same spring compression .
You are specifically asked to:
- Explain a procedure and the measurements.
- Explain control of variables.
- Show how to process the results to plot a graph with on the y-axis.
- Explain how to determine from that graph.
A diagram of the equipment arrangement is required.
Approach
- Choose as the independent variable: add known masses to the vehicle and measure total each time.
- Keep constant for all runs so the left-hand side is constant.
- Measure the speed after embedding using light gates (most direct and accurate in school labs).
- Repeat runs to reduce random error.
- Linearise the equation into the form with and .
- Use the gradient to calculate .
Step-by-Step Reasoning
1) Choosing variables and how to vary them
- Independent variable: (mass of vehicle after adding masses). This is easy to vary in steps by placing slotted masses on the vehicle.
- Dependent variable: immediately after the ball is embedded. This must be measured after the collision, not before.
- Controlled variables:
- : spring compression. Must be set to the same value every time (measure and latch at the same mark).
- : mass of the ball. Use the same ball throughout and measure once with a balance.
- Track conditions: keep the track horizontal and the same surface/section used for each run.
- “Embedding” condition: ensure the ball sticks each time (e.g. using putty/Velcro on the inside face of the vehicle). Rebound would change the energy/momentum transfer and invalidate the suggested relationship.
2) Measuring the speed
A standard method is a light gate and a card/flag of known length attached to the vehicle.
- The data logger gives the time for which the light beam is blocked.
- Then
Place the light gate just after the impact region so the measured speed corresponds to “after the ball embeds”.
(Alternative acceptable methods include two light gates a known distance apart, or a motion sensor, but the key is: measure after the embedding.)
3) Collecting sufficient data
For each chosen :
- Perform several launches (at least 3 repeats).
- Average the measured to reduce random scatter.
- Use at least 6 different values to make a convincing graph.
4) Linearising for the requested graph
Starting from the suggested relationship:
Divide both sides by :
Split the numerator:
This matches with:
- gradient
- intercept
So a plot of against should be a straight line if the relationship is correct.
5) Determining from the gradient
From
rearrange:
So you read/find the gradient from the best-fit line and substitute the known fixed compression .
A useful consistency check is that the intercept should satisfy
so if you also know , you could compare the found from the gradient with that implied by the intercept (within experimental uncertainty).
6) Safety precautions (what and why)
- Eye protection: the ball is a projectile.
- Keep hands/face away from the spring launcher during release.
- Use an end stop/catch tray so the vehicle/ball does not leave the bench.
- Secure added masses so they cannot fall off and become hazards.
Key Takeaways
- In a planning question, marks come from: clear variable choice, a workable measurement method, control of key variables, and a graph-based analysis.
- Linearising to tells you exactly what to plot and how to obtain constants.
- To measure a speed reliably, light gates + a measured flag length are a strong standard method.
Common Mistakes
- Measuring the speed before embedding rather than after.
- Failing to state that must be kept constant (or not explaining how it is set/repeated).
- Not measuring with a balance (assuming added masses are exact without checking total mass).
- Plotting the wrong graph (e.g. against ) and not using as requested.
- Forgetting to explain how to get from the gradient.
- Vague safety statements (e.g. “be careful”) without identifying the hazard (projectile / spring / falling masses).
Things to Be Careful About
- Ensure the ball truly embeds every time; any bounce changes the interaction.
- Place the light gate so it measures the post-collision motion only.
- Keep the track level: otherwise gravity adds/steals kinetic energy as the vehicle moves.
- Use enough different values and repeats to get a meaningful best-fit line.
- Keep units consistent: in , masses in , and in , so that comes out in .
The rest of this paper
1 more questions- Q2Analysis, Conclusions and Evaluation15M