Physics 9702/52 — February/March 2016
Cambridge A-Level · Planning, Analysis and Evaluation · worked solutions for every part, with the mark scheme
Topics Analysis, Conclusions and Evaluation · Planning
A student is interested in ‘bungee jumping’, where a person attached to an elastic cord falls from a height and travels downwards through a distance before moving upwards. Different cords are used for different people. A schematic diagram is shown in Fig. 1.1.
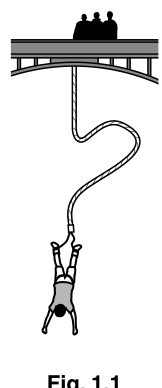
The student models ‘bungee jumping’ in the laboratory by using elastic cords of unstretched length with different spring constants. An object is attached to each cord.
The student investigates the relationship between the maximum distance fallen by the object and the spring constant of the elastic cord.
It is suggested that the relationship between and is
where is the unstretched length of the cord, is the mass of the object and is the acceleration of free fall.
Design a laboratory experiment to test the relationship between and .
Explain how your results could be used to plot a graph with on the -axis and to determine the value of . You should draw a diagram, on page 3, showing the arrangement of your equipment.
In your account you should pay particular attention to
- the procedure to be followed,
- the measurements to be taken,
- the control of variables,
- the analysis of the data,
- any safety precautions to be taken.
Variables
- Independent variable: spring constant (use different cords).
- Dependent variable: maximum distance fallen .
- Control variables: mass (same object each time), unstretched length (use cords of same ), same release position (height), same measuring equipment and alignment.
Apparatus and arrangement
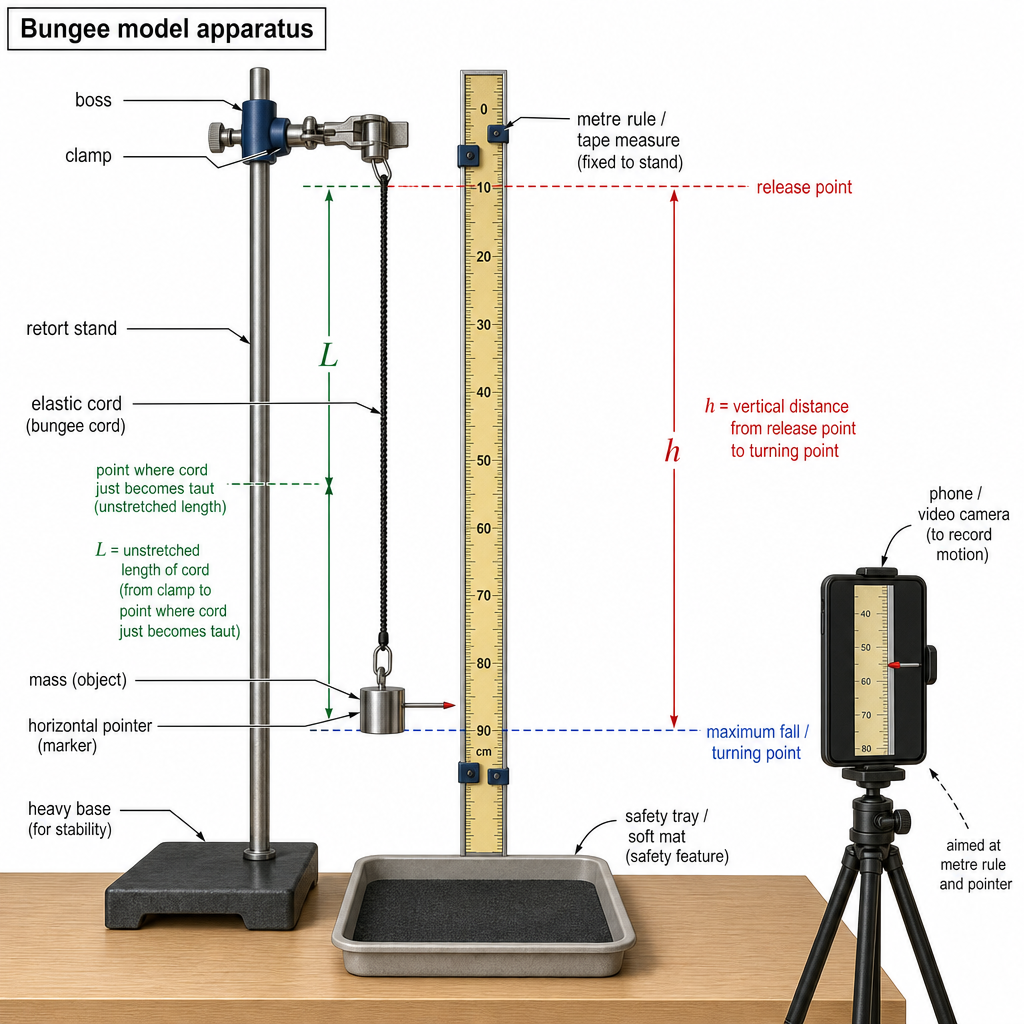
Retort stand + boss and clamp (secure), elastic cord, mass (known ), metre rule/tape measure fixed vertically, pointer on mass, tray/soft landing, optional video camera.
Procedure and measurements
-
Determine for each cord (static method).
- Clamp cord at top. Hang a series of known masses .
- Measure extension from unstretched length (use ruler and pointer).
- For each load, .
- Plot vs ; gradient (or calculate using several loads).
-
Measure for each cord (bungee model).
- Fix the same cord to the clamp at the same top point each time.
- Attach the object of mass .
- Raise the object so its top reference point is level with the clamp (same release height each trial), with cord slack, then release from rest.
- Measure the lowest point reached (use a pointer against the metre rule and/or video/frame-by-frame). The distance fallen from release point to the lowest point is .
- Repeat at least 3 times for each cord and average .
Analysis (graph and determination of )
Given
Rearrange to linear form:
For each cord, calculate
and plot (vertical axis) against
A straight line through the origin is expected with gradient
Hence
Safety precautions
- Secure retort stand (heavy base / clamp to bench); check cord for damage and do not exceed elastic limit.
- Keep hands/face clear of falling mass; use a tray/soft mat beneath.
- Wear eye protection; ensure bystanders stand back.
See working
Background Concept
The suggested model equates the energy transferred from gravitational potential energy (GPE) to elastic strain energy when the object reaches its lowest point.
- Loss in GPE over a fall distance is , where is the object’s mass and is the acceleration of free fall.
- Elastic strain energy stored in a stretched cord (obeying Hooke’s law) is
where is the spring constant and is the extension beyond its natural (unstretched) length.
In this question the cord has natural length , and at the lowest point the cord length is , so extension is . The suggested relationship is therefore
To test a relationship experimentally you usually (i) decide what to vary and measure, (ii) control the other important variables, then (iii) rearrange to a straight-line form so that a graph provides a clear test and lets you extract constants such as .
Understanding the Question
You are asked to design a laboratory experiment using cords of the same unstretched length but different spring constants .
For each cord you must determine:
- (a property of that cord), and
- (the maximum distance the object falls).
Then you must explain how to use your results to:
- calculate values of ,
- plot a graph with that expression on the -axis, and
- obtain from the graph.
The question also explicitly asks for: procedure, measurements, control of variables, analysis, and safety, plus a diagram of the arrangement.
Approach
A robust plan is:
- Use a static calibration to find for each cord: apply known forces and measure extension, using Hooke’s law .
- Use a consistent “bungee-style” release to measure the maximum fall distance for the same object mass for each cord.
- Rearrange the given equation so that the required -axis quantity is proportional to . This suggests plotting against .
- The gradient gives , so with known you can determine .
Step-by-Step Reasoning
1) Measuring the spring constant
Hooke’s law for a spring/cord in its linear region is:
So for each cord:
- Clamp the cord vertically.
- Measure its natural length (given as ; still good practice to verify).
- Hang a known mass so the applied force is .
- Measure the new length and compute extension .
- Repeat for several masses so you can plot vs .
A straight line indicates Hooke’s law applies; the gradient of the line is .
Why do several loads? Because it reduces random error and lets you see if the cord stays in the elastic region (non-linearity suggests you are stretching too far).
2) Measuring the maximum distance fallen
You need the maximum drop distance from the release point to the lowest point.
A practical method:
- Fix a metre rule or tape measure vertically next to the motion.
- Put a clear pointer on the mass (or a thin horizontal marker) to read position.
- Release the mass from the same height each time (important control variable).
- Use video (phone on a tripod) to capture the motion; the lowest point is where the mass is momentarily at rest and changes direction.
Alternative marking method (if allowed): place a light card/marker that just gets touched at the lowest point; adjust until it just touches, then read . Video is usually more reliable.
Repeat 3+ times and average for each cord because the turning point can vary slightly.
3) Linearising and graph choice
Starting with
divide both sides by and rearrange:
This is of the form:
if you choose
So:
- compute for each cord using your measured and known ,
- compute for each cord from the calibration,
- plot against .
If the model is correct, the plot is a straight line through the origin. The gradient is:
Therefore, using the known mass :
(Units check: has units of metres; has units of because is . So gradient has units , matching .)
4) Control of variables
To make it a fair test of how depends on :
- Keep the same object each time.
- Use cords with the same and measure consistently.
- Use the same release height and method (release from rest, no push).
- Keep the measuring scale aligned and fixed (avoid parallax).
- Keep the cord vertical and the mass not swinging (release carefully; repeat trials).
5) Safety
Main hazards: falling mass, cord snapping, and stand tipping.
- Clamp and weight the stand; check all clamps are tight.
- Keep people clear below the mass; use a soft landing tray/mat.
- Do not overstretch; test cords for damage first; wear eye protection.
Key Takeaways
- Find experimentally using Hooke’s law ( vs ).
- Measure a turning-point distance () reliably, ideally with video.
- Linearise a relationship to a straight-line graph; choose axes so the gradient contains the constant you want.
- Use the gradient of the graph to determine via .
Common Mistakes
- Plotting against instead of against (would give an inverse curve, not a straight line).
- Not controlling the release height; changing the start point changes .
- Measuring extension from the wrong reference (confusing with ).
- Using only one load to find (large uncertainty and no check of Hooke’s law).
- Stretching beyond the elastic limit so is not constant.
Things to Be Careful About
- Use consistent units (convert cm to m before calculations of so the graph units are correct).
- Define clearly as the distance fallen from the release point to the lowest point.
- Avoid parallax when reading rulers; keep the scale close to the motion.
- Ensure the mass does not swing; sideways motion makes difficult to measure accurately.
- When drawing the best-fit line, use a large triangle to calculate the gradient for reduced percentage uncertainty.
The rest of this paper
1 more questions- Q2Analysis, Conclusions and Evaluation15M