Physics 9702/53 — May/June 2015
Cambridge A-Level · Planning, Analysis and Evaluation · worked solutions for every part, with the mark scheme
Topics Analysis, Conclusions and Evaluation · Planning
A student is investigating simple harmonic motion using an electric vibrator. A plate is attached to the top of the electric vibrator. A small mass is placed on the metal plate as shown in Fig. 1.1.
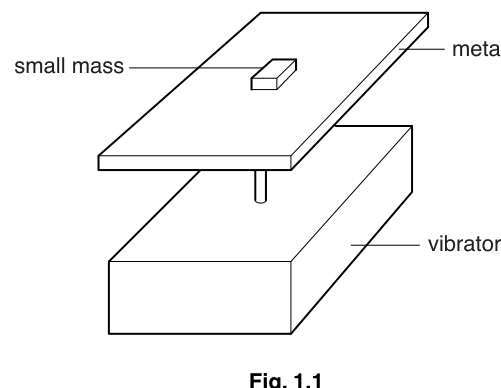
An alternating potential difference (p.d.) is applied to the vibrator. For a given peak p.d. , there is a maximum frequency at which the small mass remains in contact with the plate. The contact between the small mass and plate is lost when the frequency is greater than .
It is suggested that the relationship between and is
where is a constant.
Design a laboratory experiment to test the relationship between and . Explain how your results could be used to determine a value for . You should draw a diagram, on page 3, showing the arrangement of your equipment. In your account you should pay particular attention to
(a) the procedure to be followed,
(b) the measurements to be taken,
(c) the control of variables,
(d) the analysis of the data,
(e) the safety precautions to be taken.
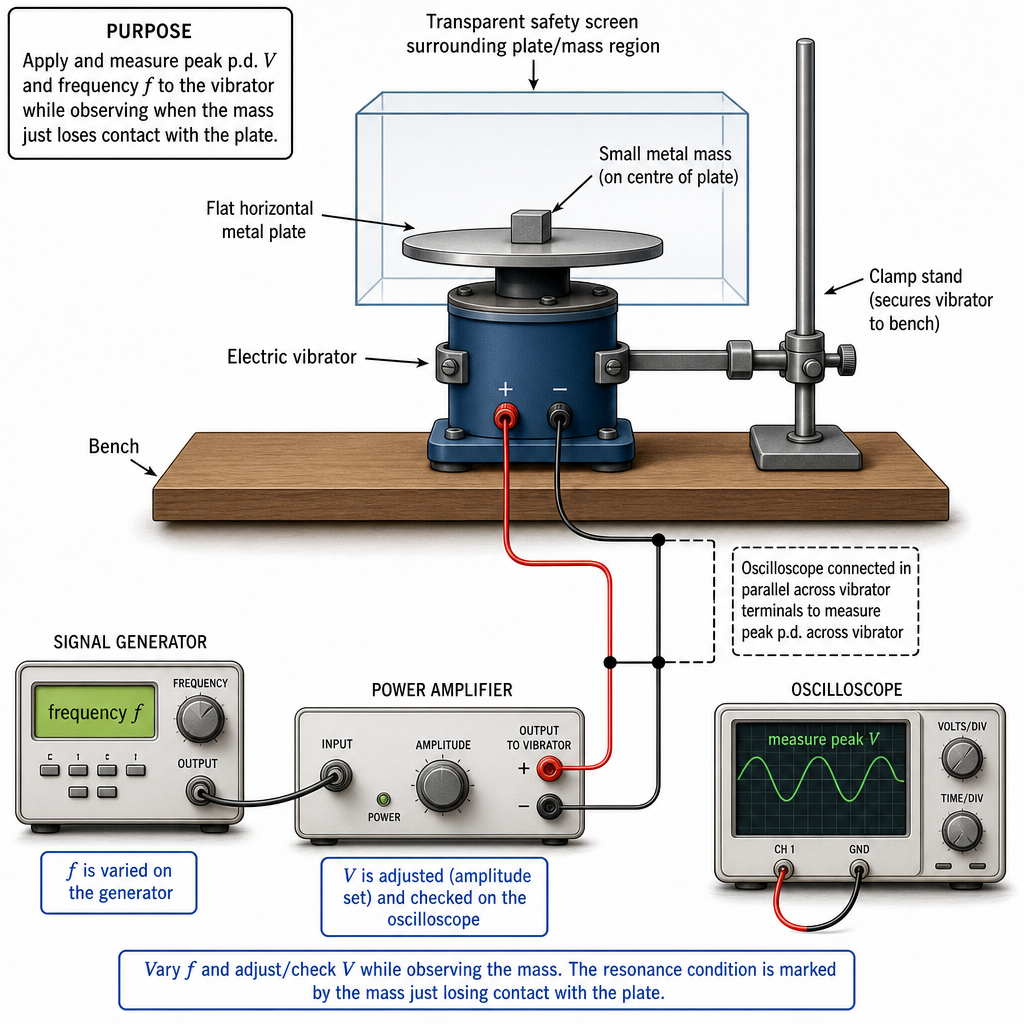
Apparatus (with diagram)
Signal generator (sine output) + power amplifier to drive vibrator, metal plate on vibrator, small metal mass, oscilloscope (or AC voltmeter) to measure peak p.d. across vibrator, frequency meter / read from generator display, clamp stand, ruler/set square to keep plate horizontal, safety screen.
Procedure
- Set up vibrator with plate horizontal. Place the same small mass at the same position on the plate.
- Set a chosen peak p.d. across the vibrator (measure with oscilloscope; adjust generator/amplifier until required peak value is obtained).
- Starting at low frequency, increase frequency slowly until the mass just begins to lose contact (first clear bouncing / momentary separation). Record this maximum frequency .
- Repeat step 3 at least 3 times for the same and take the mean .
- Repeat steps 2–4 for at least 6 different values of over a suitable range.
Measurements
For each run record:
- peak p.d. (with an uncertainty from oscilloscope scale / voltmeter resolution),
- maximum frequency at loss of contact (with uncertainty from frequency display / meter),
- repeat values and mean .
Control of variables
- use the same mass throughout (mass, material and shape unchanged),
- keep plate horizontal and surface condition the same (clean/dry),
- keep the mass at the same position on the plate,
- keep waveform the same (sinusoidal),
- allow vibrator to cool / keep temperature approximately constant.
Analysis (to test relationship and find )
Given
Rearrange to linear form:
- Calculate for each reading and tabulate and .
- Plot graph of (y-axis) against (x-axis) with error bars.
- Determine gradient of best-fit line.
- Then
(Scatter about a straight line through the origin supports the suggested relationship.)
Safety
- Fit a safety screen / wear eye protection in case the mass is ejected.
- Clamp vibrator securely; keep fingers clear of the vibrating plate.
- Use low voltage where possible; check insulation and do not overload the amplifier.
Answer
See working
See working
Background Concept
In simple harmonic motion (SHM), the motion is sinusoidal and the acceleration is proportional to displacement. For SHM with frequency and angular frequency , we have
A key idea for a mass on a vibrating plate is the contact condition. The mass remains in contact with the plate only while the plate can provide a normal reaction force . The instant contact is just lost is typically when the plate’s downward acceleration is large enough that the required reaction would become zero. In many vibrator experiments, the “just loses contact” point corresponds to a fixed critical acceleration related to .
The question gives a proposed relationship:
Here is the peak applied p.d. and is the maximum frequency at which contact is still maintained. The task in a Paper 5 planning question is to design a method to obtain reliable pairs and then analyse them in a way that would confirm (or refute) the relationship and allow to be found.
Understanding the Question
You are told:
- the apparatus: an electric vibrator with a plate and a small mass on top,
- you can control the applied alternating p.d. (peak value ) and its frequency,
- for each chosen , there exists a maximum frequency before the mass starts to lose contact,
- the suggested model links the measured quantities by .
So you must:
- Decide what to vary (independent variable) and what to measure (dependent variable).
- Describe a clear criterion for “maximum frequency” (how you decide the instant contact is lost).
- Explain what to keep constant (controls).
- Present a graph/data-processing method that yields .
- State relevant safety precautions.
Approach
A good strategy is:
- Choose as the independent variable (you can set it using a signal generator/amplifier and measure it with an oscilloscope).
- For each , find the threshold frequency where contact is just lost (increase frequency slowly and identify first clear bouncing/separation).
- Repeat readings at each to reduce random judgement/timing errors.
- Linearise the equation so a straight-line graph tests the relationship and gives from the gradient.
Starting from
divide both sides by :
So a plot of against should be a straight line through the origin, with gradient .
Step-by-Step Reasoning
1) Apparatus choice and why it works
You need to control and measure two electrical quantities:
- frequency (from the signal generator readout or a frequency meter),
- peak p.d. across the vibrator (best measured using an oscilloscope because it directly displays peak voltage and waveform shape).
You also need a way to safely observe the mass and decide when contact is lost.
A typical workable arrangement is:
Key points:
- The signal generator sets the frequency and (via amplifier) the drive voltage.
- The oscilloscope across the vibrator confirms you are using a sinusoidal waveform and lets you measure the peak p.d. consistently.
- A safety screen prevents injury if the mass is thrown off.
2) Defining variables
- Independent variable: (peak p.d.).
- Dependent variable: threshold/maximum frequency at which the mass just remains in contact.
- Controls (examples that matter here): mass value, mass position, plate angle (horizontal), surface condition, waveform, and temperature/heating effects.
3) Data collection method
For each chosen :
- Set while watching the oscilloscope trace. If the generator setting drifts with load, re-adjust until the measured peak is correct.
- Start at low (mass clearly in contact).
- Increase slowly. Near the threshold, make small increments so you do not overshoot.
- Identify the threshold as the first consistent sign of separation (bouncing, visible gap, audible change, or intermittent loss of steady contact). Record .
- Repeat (at least 3 times) at the same and average the threshold .
- Change and repeat for a range (at least 6 values) to give a meaningful graph.
This repetition is essential because the “just loses contact” judgement introduces random uncertainty.
4) Table and processed quantities
Because the linear form uses and , you should include derived columns in your table:
- / Hz, / ,
- / V (peak), / .
Uncertainties:
- from oscilloscope scale (e.g. half the smallest division converted to volts),
- from frequency display resolution or from repeat scatter.
5) Graph and determination of
Using
Plot:
- y-axis:
- x-axis:
If the suggested relationship is correct:
- points lie close to a straight line,
- line passes through the origin within uncertainty.
Gradient gives:
You can estimate uncertainty in by finding uncertainty in gradient (worst acceptable line method) and propagating it:
6) Safety reasoning
Main hazards are mechanical and electrical:
- The mass may be ejected: use a screen and/or goggles.
- The vibrator can move: clamp it securely.
- Avoid touching the plate while operating.
- Keep voltages within safe limits; do not overload power amplifier; inspect leads.
Key Takeaways
- In planning questions, you must clearly state what you vary, what you measure, and what you control.
- Test a proposed relationship by rearranging it into linear form and plotting a straight-line graph.
- Determine constants from the gradient/intercept, and take repeats plus uncertainty estimates seriously.
- Safety marks come from specific realistic risks and precautions.
Common Mistakes
- Using RMS voltage from a meter when the question specifies peak (leads to a constant factor error).
- Not defining a clear criterion for “maximum frequency” (vague: “when it stops working”).
- Changing more than one variable at a time (e.g. changing mass or position between readings).
- Plotting the wrong graph (e.g. vs ) and then trying to read off without linearisation.
- Forgetting units in table headings (Paper 5 expects proper headings like ).
Things to Be Careful About
- Ensure the waveform is sinusoidal; distortion changes the motion and the threshold.
- The load of the vibrator can cause the generator’s displayed voltage to differ from the actual p.d. across the vibrator, so measure across the vibrator directly.
- Near the threshold, increase in small steps and repeat to reduce overshoot and subjective judgement error.
- Heating can change the vibrator response; allow cooling time or take readings quickly in a consistent order.
- When drawing the best-fit line, use a large triangle for gradient; include error bars if you are estimating gradient uncertainty.
The rest of this paper
1 more questions- Q2Analysis, Conclusions and Evaluation15M