Physics 9702/52 — October/November 2012
Cambridge A-Level · Planning, Analysis and Evaluation · worked solutions for every part, with the mark scheme
Topics Analysis, Conclusions and Evaluation · Planning
As a bar magnet is dropped through a coil, an e.m.f. is induced in the coil. The maximum e.m.f. is induced as the magnet leaves the coil with speed .
It is suggested that is directly proportional to .
Design a laboratory experiment to test the relationship between and . You should draw a diagram, on page 3, showing the arrangement of your equipment. In your account you should pay particular attention to
(a) the procedure to be followed,
(b) the measurements to be taken,
(c) the control of variables,
(d) the analysis of the data,
(e) the safety precautions to be taken.
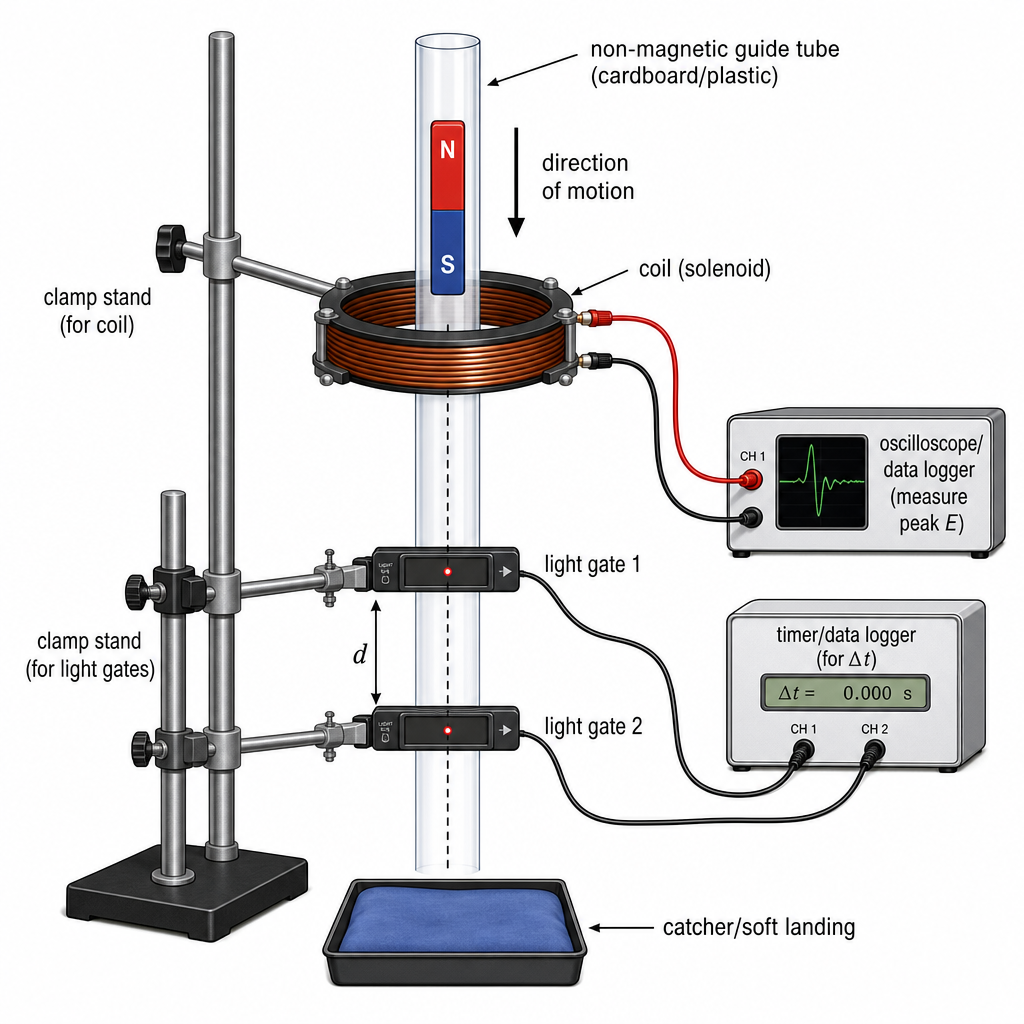
Answer
Variables
- Independent variable: speed of the magnet as it leaves the coil.
- Dependent variable: maximum induced e.m.f. (peak value as magnet leaves coil).
- Controlled variables: same magnet (strength, orientation), same coil (turns/area), coil position and alignment, magnet path through coil centre, coil temperature/resistance, distance between light gates, method of releasing magnet.
(a) Procedure
- Clamp the coil vertically and connect it to an oscilloscope/data logger input.
- Place two light gates just below the bottom end of the coil, separated by a measured distance .
- Release the same bar magnet from rest above the coil using a fixed guide tube so it falls centrally through the coil.
- Use the light gates to record the time interval for the magnet to travel between them.
- Record from the oscilloscope/data logger the peak induced e.m.f. corresponding to the magnet leaving the coil.
- Repeat at least 3 times for each drop height and take a mean.
- Change the release height (or starting position) to obtain a range of speeds and repeat.
(b) Measurements
- Measure between light gates with a ruler/metre rule.
- Measure from the light gate timer/data logger.
- Determine using
- Measure as the maximum (peak) voltage on the trace (or peak-hold output), in volts.
(c) Control of variables
- Use the same magnet and keep its polarity/orientation the same for every drop.
- Keep the coil fixed (same number of turns and area) and ensure the magnet always passes through the centre using a guide tube.
- Keep the light gates fixed relative to the coil so is measured at the same position (just after leaving the coil).
- Avoid heating the coil (low induced currents; allow time between runs if needed).
(d) Analysis of data
- For each run, calculate and pair with the measured .
- Plot a graph of (y-axis) against (x-axis) with error bars from uncertainties in , , and .
- If , the graph should be a straight line through the origin.
- Find gradient of best-fit line so that
- Use repeats to find mean and mean ; compare scatter/uncertainties to judge the model.
(e) Safety precautions
- Clamp apparatus securely; ensure the falling magnet cannot hit feet/hands (use a catcher tray/soft landing).
- Keep strong magnets away from electronic devices, magnetic storage, and people with pacemakers.
- Ensure cables do not create a trip hazard; keep oscilloscope/data logger away from the falling path.
See working
Background Concept
When a magnet moves relative to a coil, the magnetic flux linkage through the coil changes. Faraday's law gives the induced e.m.f.
The minus sign is Lenz's law (direction), but for this experiment we measure the magnitude (peak value) so we can focus on .
If the magnet leaves the coil faster, the flux linkage changes more rapidly, so the peak induced e.m.f. is larger. The suggestion means that, for the same coil and magnet, doubling the exit speed should double the peak e.m.f.
Understanding the Question
You must design an experiment to test whether the maximum induced e.m.f. (specifically when the magnet is leaving the coil) is directly proportional to the speed at that instant.
So you need:
- A way to measure the peak induced e.m.f. reliably.
- A way to measure the magnet's speed at/just after it leaves the coil.
- A method to vary over a sensible range.
- Control variables so that changes in are due to changes in only.
- A graph-based analysis that clearly tests direct proportionality.
Approach
A practical way is:
- Vary by changing the drop height (gravitational potential energy changes the speed at the bottom).
- Measure with an oscilloscope/data logger because the induced voltage is a short pulse.
- Measure using two light gates near the exit of the coil: speed is then found from .
- Plot vs . Direct proportionality is shown by a straight line through the origin; the gradient is the constant of proportionality.
Step-by-Step Reasoning
-
Set up the coil and voltage measurement
- Connect the coil terminals to an oscilloscope or data logger voltage sensor.
- Set a suitable time base so the voltage pulse is visible, and use a peak measurement/peak-hold if available.
- This ensures you capture the maximum e.m.f. as the magnet leaves.
-
Measure the speed at the exit
- Place two light gates a small distance apart just below the coil exit.
- When the magnet passes gate 1 then gate 2, the timer gives .
- Calculate speed:
- Because the gates are close to the coil exit, this is a good approximation to the speed as it leaves the coil.
-
Vary
- Release the magnet from rest at different heights above the coil. Higher release height gives larger speed at the coil exit.
- Use a consistent release method (e.g. a clamp or simple release mechanism) so the magnet is not given an extra push.
-
Take paired readings
- For each height, record the peak e.m.f. from the trace and compute from the light gates.
- Repeat at least three times to reduce random error and obtain a mean value.
-
Control variables
The relationship should only depend on the speed if other factors are fixed:- Same magnet and same orientation (reversing the magnet reverses the polarity of the pulse).
- Same coil (turns and area) and fixed geometry.
- Magnet falls through the centre each time (use a guide tube aligned with the coil).
- Keep gates fixed relative to coil (you must always measure at the same position).
-
Analyse the data
- Create a results table with columns such as , , , , and .
- Plot (y-axis) against (x-axis).
- If , then:
- The plot should be a straight line.
- It should pass through the origin within uncertainties.
- The gradient gives in .
- Include uncertainty estimates (e.g. from ruler resolution, from timer resolution, from trace reading) and show error bars; then judge whether the origin is consistent with the best-fit line.
Key Takeaways
- Use Faraday’s law idea: faster change of flux linkage gives larger induced e.m.f.
- To test proportionality, vary one quantity (), measure the other (), and plot a straight-line graph.
- Good planning is mostly about valid measurement methods and control of variables.
- Repeats and uncertainty/error bars strengthen the conclusion.
Common Mistakes
- Measuring speed too far away from the coil (then is not the “leaving the coil” speed).
- Using a voltmeter instead of an oscilloscope/data logger (a voltmeter may miss the peak because the pulse is brief).
- Forgetting to control magnet orientation or ensuring it passes centrally (changes the flux linkage pattern).
- Saying “straight line” without stating “through the origin” when claiming direct proportionality.
- Not stating how is calculated (missing ).
Things to Be Careful About
- Ensure is measured accurately and gates are aligned so the magnet reliably triggers them.
- Choose a range of drop heights that gives a clear spread in (not all speeds nearly the same).
- Keep the coil and gates securely clamped; vibrations can change alignment.
- Peak voltage readings from a trace should be taken consistently (same zero level, same scale); quote to a sensible resolution.
- Safety: a strong magnet can pinch fingers and can damage electronics/data storage; prevent it from hitting people or equipment when it falls.
The rest of this paper
1 more questions- Q2Analysis, Conclusions and Evaluation15M