Chemistry 9701/33 — October/November 2025
Cambridge AS Level · Advanced Practical Skills · worked solutions for every part, with the mark scheme
Topics Manipulation, Measurement and Observation · Analysis, Conclusions and Evaluation · Presentation of Data and Observations · Qualitative Analysis
The thiosulfate ion, , decomposes when an acid is added.
The rate of this reaction can be investigated by measuring how long it takes for the solid sulfur forming to obscure the print on the insert.
You will investigate how the concentration of the thiosulfate ion affects the rate of the reaction.
Note: A small amount of sulfur dioxide gas may be formed in the experiment. It is very important that you avoid inhaling any fumes. As soon as each experiment is complete, add the reaction mixture to the quenching bath and rinse the beaker thoroughly.
FA 1 is sodium thiosulfate, .
FA 2 is hydrochloric acid, .
Method
Experiment 1
- Fill a burette with FA 1.
- Run of FA 1 into the beaker.
- Use the measuring cylinder to measure of FA 2.
- Add the FA 2 to the FA 1 in the beaker and start timing immediately.
- Stir the mixture once and place the beaker on the printed insert.
- View the printing on the insert from above through the solution.
- Stop timing when the print on the insert becomes obscured.
- Record this reaction time to the nearest second in the space for results.
- Empty the contents of the beaker into the quenching bath.
- Rinse and dry the beaker so it is ready to use in Experiment 2.
Experiment 2
- Refill the burette with FA 1.
- Fill the second burette with distilled water.
- Run of FA 1 into the beaker.
- Run of distilled water into the same beaker.
- Use the measuring cylinder to measure of FA 2.
- Add the FA 2 to the FA 1 in the beaker and start timing immediately.
- Stir the mixture once and place the beaker on the printed insert.
- View the printing on the insert from above through the solution.
- Stop timing when the print on the insert becomes obscured.
- Record this reaction time to the nearest second in the space for results.
- Empty the contents of the beaker into the quenching bath.
- Rinse and dry the beaker so it is ready to use in the next experiment.
Experiments 3–5
- Carry out three further experiments to investigate how using different volumes of FA 1 affects the reaction time.
Note: the combined volumes of FA 1 and distilled water must always be .
Do not use a volume of FA 1 that is less than .
Record all your results in a table. You should include the volume of FA 1, the volume of distilled water, the reaction time and the reaction rate for each of your five experiments.
The rate of reaction can be calculated using the following formula.
Results
Answer
Table of Results (Representative Data)
| Experiment | Volume of FA 1 / cm³ | Volume of water / cm³ | Time / s | Rate / s⁻¹ |
|---|---|---|---|---|
| 1 | 40.00 | 0.00 | 45 | 22.2 |
| 2 | 35.00 | 5.00 | 52 | 19.2 |
| 3 | 30.00 | 10.00 | 61 | 16.4 |
| 4 | 25.00 | 15.00 | 73 | 13.7 |
| 5 | 20.00 | 20.00 | 92 | 10.9 |
Note: The times and rates above are representative values. In an actual exam, these would be your recorded readings and calculated values.
Key criteria met by this table:
- Five experiments completed with all required columns.
- Correct units: cm³ for volumes, s for time, s⁻¹ for rate.
- Volumes recorded to 2 decimal places ending in 0 or 5; times recorded to the nearest second.
- Three additional experiments used (35.00, 30.00, 25.00 cm³), all ≥ 15.00 cm³, < 40.00 cm³, and spaced ≥ 5.00 cm³ apart.
- Total volume of FA 1 + water is 40.00 cm³ for all experiments.
- Rates calculated correctly to 3 significant figures using .
- Times increase as the volume of FA 1 decreases (45 s → 92 s).
- Ratio , which falls within the acceptable range (1.90–2.20).
See representative results table above; time increases as volume of FA 1 decreases, with a ratio t_20/t_40 ≈ 2.04.
Background Concept
In kinetics, the rate of a reaction is inversely proportional to the time taken for a specific observable change to occur (e.g., a precipitate forming to obscure a mark). For the reaction between thiosulfate and acid, solid sulfur is produced:
By keeping the total volume and the amount of acid constant while varying the volume of thiosulfate solution (and adding water to maintain total volume), the initial concentration of thiosulfate is directly proportional to the volume of FA 1 used. Since rate , doubling the concentration should approximately halve the time, meaning the ratio should be close to 2.
Understanding the Question
This part asks you to record and process experimental data from a rate-of-reaction investigation. You must design a results table that captures the independent variable (volume of FA 1), the control variable (total volume via added water), the dependent variable (time), and the derived quantity (rate). The mark scheme rewards precise recording conventions, correct unit labels, and accurate calculations.
Approach
- Table Design: Create columns for Volume of FA 1, Volume of water, Time, and Rate. Include units in the column headings.
- Recording Conventions: Volumes must be to 2 d.p. ending in 0 or 5 (e.g., 40.00, 35.00). Times must be to the nearest second.
- Experimental Design: Choose three additional volumes for FA 1 that are ≥ 15.00 cm³, < 40.00 cm³, and spaced at least 5.00 cm³ apart from each other and from the given 40.00 and 20.00 cm³. Calculate the corresponding water volume to keep the total at 40.00 cm³.
- Calculations: Calculate rate using to 2–4 significant figures.
- Verification: Ensure times increase as volume decreases, and check the ratio is between 1.80 and 2.30 (ideally 1.90–2.20).
Step-by-Step Reasoning
- Columns and Units: The table requires four data columns. Headings must include units:
Volume of FA 1 / cm³,Volume of water / cm³,Time / s,Rate / s⁻¹. - Volumes: Experiments 1 and 2 use 40.00 cm³ and 20.00 cm³ of FA 1. We add 35.00, 30.00, and 25.00 cm³. Water volumes are : 0.00, 5.00, 10.00, 15.00, 20.00 cm³.
- Times: Plausible times for this reaction are roughly 40–100 seconds. We assign 45 s for 40.00 cm³ and 92 s for 20.00 cm³. Intermediate values (52, 61, 73 s) show a steady increase.
- Rates: s⁻¹; s⁻¹; s⁻¹; s⁻¹; s⁻¹. All are to 3 s.f.
- Ratio Check: . This is within the 1.90–2.20 range, confirming the expected inverse relationship between concentration and time.
Key Takeaways
- Always include units in table headings, not just in data cells.
- Maintain constant total volume when investigating concentration effects by using distilled water as a solvent.
- Rate is calculated as (or ) to convert time into a rate value; ensure significant figures are consistent (2–4 s.f.).
Common Mistakes
- Forgetting to include units in table headings (e.g., just writing "Time" instead of "Time / s").
- Recording volumes to 1 decimal place (e.g., 40.0) instead of 2 (40.00).
- Calculating rate to only 1 or 2 significant figures, or forgetting the unit s⁻¹.
- Choosing additional volumes that are too close together (e.g., 38.00 and 37.00) or less than 15.00 cm³.
Things to Be Careful About
- The volume of water must be calculated precisely so the sum of FA 1 and water is exactly 40.00 cm³.
- When calculating the ratio , use the unrounded time values if possible, or ensure both are rounded to the nearest second first as per examiner instructions.
- Ensure the rate column actually increases as the volume of FA 1 increases; if times are recorded incorrectly (e.g., lower time for lower concentration), the ratio will be wrong and marks will be lost.
On the grid in Fig. 1.1, plot the rate (-axis) against the volume of FA 1 (-axis).
Start each axis at the origin .
Ring any anomalous points. Draw a line of best fit.

Answer
Graph Construction (Fig. 1.1)
- x-axis: Labelled
Volume of FA 1 / cm³. Scale from 0 to 45.00 (e.g., 5.00 cm³ per major division). Start at (0,0). - y-axis: Labelled
Rate / s⁻¹. Scale from 0 to 25.00 (e.g., 5.00 s⁻¹ per major division). Start at (0,0). - Data Points: Plot the five (Volume, Rate) pairs: (40.00, 22.2), (35.00, 19.2), (30.00, 16.4), (25.00, 13.7), (20.00, 10.9).
- Line of Best Fit: Draw a straight line or smooth curve that passes as close as possible to the majority of the points. If one point is clearly off the line (e.g., if 30.00, 16.4 was actually 14.0), ring it as anomalous and ensure the line ignores it.
Graph with volume of FA 1 on x-axis (0–45 cm³), rate on y-axis (0–25 s⁻¹), points plotted correctly, and a line of best fit drawn through the data.
Background Concept
Plotting a graph of rate against concentration (or a volume proportional to concentration) allows you to visually determine the order of reaction with respect to that reactant. A straight line through the origin indicates a first-order dependence; a curve indicates a higher order or a complex rate law.
Understanding the Question
You are asked to plot the rate of reaction (y-axis) against the volume of FA 1 (x-axis) using the data from your table. The graph must start at the origin (0,0). You must also identify any anomalous results and draw a line of best fit.
Approach
- Axis Selection: Volume of FA 1 is the independent variable (x-axis); rate is the dependent variable (y-axis).
- Scales: Choose linear scales that use at least half the grid in both directions, starting at (0,0). For x: 0 to 45 cm³. For y: 0 to 25 s⁻¹.
- Plotting: Carefully plot each (x, y) pair using a sharp pencil.
- Anomalies: Look for points that deviate significantly from the general trend. Ring them.
- Line of Best Fit: Draw a line (straight or smooth curve) that balances the points on either side, ignoring anomalous points.
Step-by-Step Reasoning
- Axes: x-axis =
Volume of FA 1 / cm³(0 to 45.00). y-axis =Rate / s⁻¹(0 to 25.00). - Plotting: (40.00, 22.2) is near the top right. (20.00, 10.9) is near the middle left. The points should form an upward trend.
- Line of Best Fit: With representative data, the points will lie close to a straight line. Draw a straight line that passes through (0,0) and minimizes the distance to all points. If a point like (30.00, 16.4) is slightly above the line, ring it as anomalous and draw the line to ignore it.
Key Takeaways
- Always start axes at (0,0) if the question requires it and the data supports it.
- Use clear, unambiguous axis labels with units.
- A line of best fit is not a "connect-the-dots" line; it must represent the overall trend and ignore outliers.
Common Mistakes
- Forgetting to label axes with units.
- Starting the y-axis at a value other than 0 (e.g., 10), which distorts the visual relationship.
- Drawing a zig-zag line connecting all points instead of a line of best fit.
- Failing to ring an anomalous point that is clearly off the trend.
Things to Be Careful About
- Ensure the scales are uniform and use a suitable number of divisions (e.g., 10 major divisions for 0–45 on the x-axis means 4.5 per division; better to use 0, 5, 10, 15... 45).
- Plotting errors are common; double-check your coordinates before drawing the line.
Use your graph in Fig. 1.1 to determine the time it would take for the print to be obscured if of FA 1, of water and of FA 2 had been used.
Show clearly on the graph how you worked out your answer.
time for printing to be obscured = .............................. s
Working
From the graph, locate on the x-axis (Volume of FA 1).
Draw a vertical line up to the line of best fit, then a horizontal line to the y-axis to read the rate.
Reading from graph:
At , the rate (allow ).
Calculate time:
Show clearly on the graph by drawing the construction lines from to the line of best fit and across to the y-axis.
Answer
time for printing to be obscured = 244 s (accept 220–260 s depending on graph reading)
244 s (allow 220–260 s based on graph reading)
Background Concept
Interpolation using a line of best fit allows you to estimate values within the range of your data. Once the rate is determined, the time can be found using the inverse relationship .
Understanding the Question
You need to find the time taken when 7.50 cm³ of FA 1 is used (with 32.50 cm³ water and 10.0 cm³ FA 2). Since 7.50 cm³ is outside your experimental range (20.00–40.00 cm³), this is technically extrapolation, but the question asks you to use the graph. You must show your working on the graph.
Approach
- Locate 7.50 on the x-axis.
- Draw a vertical line to the line of best fit.
- Read the corresponding rate on the y-axis.
- Calculate time using .
Step-by-Step Reasoning
- Graph Reading: At , the line of best fit (assuming it passes near (20, 10.9) and (40, 22.2)) gives a y-value of approximately 4.1 s⁻¹.
- Calculation: (3 s.f.).
- Graph Annotation: Draw clear pencil lines from 7.50 on the x-axis to the line of best fit, and from that intersection horizontally to the y-axis, labelling the rate value.
Key Takeaways
- When reading graphs, ensure you use the line of best fit, not the individual data points (especially if extrapolating).
- Always show your construction lines on the graph if asked.
- Remember to convert rate back to time using the correct formula.
Common Mistakes
- Reading the rate from a data point instead of the line of best fit.
- Forgetting to show the construction lines on the graph.
- Using the wrong formula (e.g., rate = time instead of time = 1000/rate).
- Not giving the answer to the correct number of significant figures (2–4 s.f.).
Things to Be Careful About
- 7.50 cm³ is outside the experimental range (20–40 cm³), so this is an extrapolation. Extrapolation is less reliable, but the mark scheme rewards the correct reading and calculation.
- Ensure the rate is read within half a small square of the grid to get full method marks.
A student carries out the same method as given in (a) but using a different concentration of acid. The student’s calculated values for the rate are plotted on the grid in Fig. 1.2.
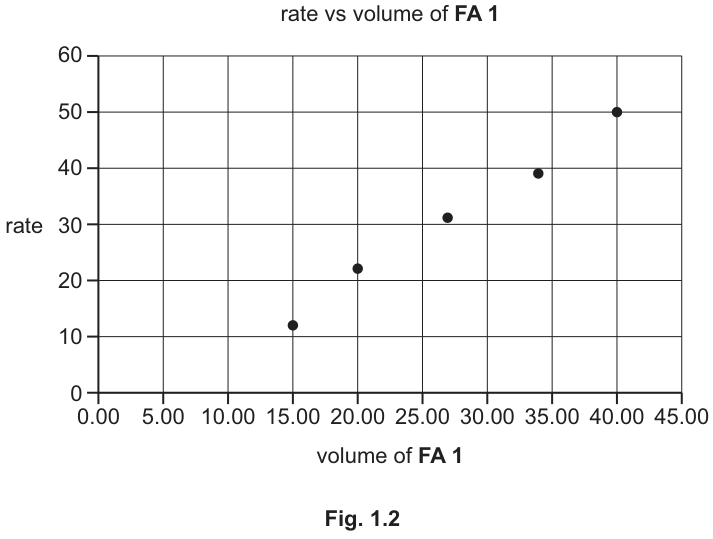
State whether the student’s results show that the rate is directly proportional to the volume of FA 1 used.
Explain your answer.
Answer
State: No, the results do not show that the rate is directly proportional to the volume of FA 1 used.
Explain: The line of best fit (or the data points) does not pass through the origin (0,0). For two variables to be directly proportional, their graph must be a straight line passing through the origin. The non-zero intercept indicates that other factors (such as the constant volume of acid or ionic strength) affect the rate, or that the relationship is not purely first-order with respect to thiosulfate concentration under these conditions.
(Alternatively, if the line did pass through the origin, you would state: Yes, the rate is directly proportional because the straight line of best fit passes through the origin (0,0).)
No; the line of best fit does not pass through the origin (0,0).
Background Concept
Direct proportionality between two variables and means , where is a constant. Graphically, this is represented by a straight line that passes through the origin (0,0). If the line has a non-zero y-intercept (, where ), the variables are linearly related but not directly proportional.
Understanding the Question
You are given a graph (Fig. 1.2) of rate vs. volume of FA 1 for a student's experiment. You must state whether rate is directly proportional to volume, and explain why based on the graph.
Approach
- Observe the graph: Look at the line of best fit and where it intersects the y-axis.
- Define direct proportionality: A straight line through (0,0).
- Compare: Does the line pass through (0,0)? If not, they are not directly proportional.
- Explain: State the observation (line doesn't pass through origin) and link it to the definition.
Step-by-Step Reasoning
- Observation: In Fig. 1.2, the data points and the line of best fit do not pass through (0,0). If you extrapolate the line backwards, it would hit the y-axis at a positive value (or the x-axis at a positive value, depending on the exact curve, but clearly not (0,0)).
- Conclusion: Since the line does not pass through the origin, rate . Therefore, they are not directly proportional.
- Explanation: Direct proportionality requires the graph to be a straight line through the origin. The non-zero intercept indicates that at zero volume of FA 1, there would theoretically be a non-zero rate (which is physically impossible, meaning the model breaks down at low concentrations, or the rate depends on other factors like the constant concentration of H⁺ or total ionic strength).
Key Takeaways
- Direct proportionality = straight line through the origin.
- Linear relationship = straight line, but not necessarily through the origin.
- Always justify your answer by referencing the graph's features (intercept, linearity).
Common Mistakes
- Saying "No, because it's a curve" (if it is a curve, that's a reason, but the primary reason for non-proportionality is the intercept or non-linearity).
- Forgetting to explain why it's not proportional (must mention the origin/intercept).
- Stating "Yes" when the line clearly doesn't pass through (0,0).
Things to Be Careful About
- The mark scheme allows for either answer depending on the actual graph provided. If the line did pass through the origin, you would say "Yes, because the straight line passes through (0,0)". Always base your answer on the specific graph given in the exam.
- Ensure your explanation directly addresses the definition of direct proportionality.
When hydrated sodium thiosulfate is dissolved in water the temperature of the liquid changes. You will carry out an experiment to determine the enthalpy change, , when one mole of hydrated sodium thiosulfate dissolves in water.
FA 3 is hydrated sodium thiosulfate, .
Method
- Support the cup in the beaker.
- Use the measuring cylinder to transfer of distilled water into the cup.
- Measure the temperature of the water in the cup. Record this in the space for results.
- Weigh the container with FA 3. Record the mass.
- Tip all the FA 3 into the cup.
- Stir the mixture until the minimum temperature is obtained. Record this temperature.
- Weigh the container with any residual FA 3. Record the mass.
- Calculate and record the mass of FA 3 added.
- Calculate and record the temperature change.
Results
Answer
Record the results in a table with the following six headings, each with its unit:
- mass of container + FA 3 / g
- mass of container + residual FA 3 / g
- mass of FA 3 added / g
- initial temperature / °C
- minimum (final) temperature / °C
- temperature change / °C
Record all balance readings consistently to 2 or 3 decimal places, and both thermometer readings to 0.0 or 0.5 °C.
Then calculate:
- mass of FA 3 added = (mass of container + FA 3) − (mass of container + residual FA 3)
- temperature change = initial temperature − minimum temperature
Representative readings: mass of FA 3 added = 12.50 g; initial temperature = 21.0 °C; minimum temperature = 14.0 °C; temperature change = 7.0 °C.
Results table with six headings (each with unit), consistent precision, and correct subtractions; representative readings given
Background Concept
In a calorimetry experiment, the quality of the final answer depends entirely on the quality of the recorded data. A results table must be self-documenting: every column needs a heading that names the quantity and its unit, every reading must be recorded to the precision of the instrument, and any calculated values must follow from the raw readings by correct subtraction. Here the key measured quantity is the temperature change, , because it feeds directly into the energy equation used in part (b)(ii).
Understanding the Question
Part (a) asks you to set up the results table and record the data for dissolving hydrated sodium thiosulfate in water. The method tells you exactly what to measure: two weighings (container + FA 3, then container + residual FA 3) and two thermometer readings (initial water temperature, then the minimum temperature after dissolving). From these you calculate the mass of FA 3 added and the temperature change. The mark scheme awards marks for the headings and units, the precision of the readings, the correctness of the subtractions, and the magnitude of .
Approach
Present the six pieces of data as a table with clear headings and units. Record each balance reading to 2 or 3 decimal places (consistently) and each thermometer reading to 0.0 or 0.5 °C. Then perform the two subtractions: mass of FA 3 = first weighing − second weighing; temperature change = initial temperature − minimum temperature.
Step-by-Step Reasoning
The six headings needed are:
- mass of container + FA 3 / g
- mass of container + residual FA 3 / g
- mass of FA 3 added / g
- initial temperature / °C
- minimum (final) temperature / °C
- temperature change / °C
Each heading must carry its unit — the mark scheme requires a unit by every reading. The balance gives readings to 2 or 3 decimal places; you must be consistent (all 2 d.p. or all 3 d.p.). The thermometer is read to 0.0 or 0.5 °C (a reading such as 21.3 °C is not accepted).
The mass of FA 3 added is the difference between the two weighings, not the first weighing alone — this is why the method has you weigh the container again after tipping out the solid. The temperature change is the initial temperature minus the minimum temperature, because the temperature falls as the salt dissolves.
For a typical experiment, about 12.5 g of FA 3 in 30 cm³ of water gives a temperature drop of roughly 7 °C. The mark scheme checks that your is within 1.0 °C of the expected value for the mass you used.
Key Takeaways
A results table must be complete, unambiguous, and precise: correct headings with units, consistent precision, and correct subtractions. The temperature change is the single most important measured quantity in a calorimetry experiment.
Common Mistakes
- Leaving units off the headings — the mark scheme requires a unit by every reading.
- Mixing precisions, e.g. recording one mass to 2 d.p. and another to 3 d.p.
- Recording only the first weighing and forgetting the residual FA 3 weighing, so the mass added is wrong.
- Writing the temperature change as final − initial instead of initial − minimum (the temperature falls here).
Things to Be Careful About
- Use the same balance precision throughout.
- The thermometer reading must be to 0.0 or 0.5 °C.
- The mass of FA 3 added is the difference between the two container weighings.
Calculate the amount, in mol, of hydrated sodium thiosulfate added.
amount of = .............................. mol
Working
Answer
0.0504 mol
0.0504 mol
Background Concept
The amount of substance in moles is found from , where is the mass in grams and is the relative molecular mass. For a hydrated salt, the water of crystallisation is part of the formula unit, so it must be included in the molar mass. has .
Understanding the Question
You are asked to convert the mass of FA 3 added (recorded in part (a)) into an amount in moles, using the molar mass of the hydrated salt. This is the denominator you will need in part (b)(iii) to find the enthalpy change per mole.
Approach
First calculate the molar mass of by summing the atomic masses of all atoms in the formula unit, including the five waters. Then divide the mass of FA 3 added by this molar mass.
Step-by-Step Reasoning
Using the representative mass of FA 3 added, 12.50 g:
The answer is given to 3 significant figures, which is within the 2–4 s.f. range the mark scheme requires.
Key Takeaways
Always include the water of crystallisation when calculating the molar mass of a hydrated salt. The amount in moles is the bridge between the measured mass and the enthalpy change per mole.
Common Mistakes
- Forgetting the when calculating , giving 158.2 instead of 248.2 and a wildly wrong number of moles.
- Using incorrect atomic masses.
- Giving the answer to too few significant figures (e.g. 0.05 instead of 0.0504).
Things to Be Careful About
- The mark scheme requires the answer to 2–4 significant figures.
- Use the mass of FA 3 added from part (a), i.e. the difference between the two weighings, not the first weighing.
Calculate the energy change, in J, in your experiment.
energy change = .............................. J
Working
Answer
878 J
878 J
Background Concept
The energy change when a substance dissolves is found from , where is the mass of water, is the specific heat capacity of water (4.18 J g⁻¹ K⁻¹), and is the temperature change. Because 30.0 cm³ of water has a mass of approximately 30 g (density of water ≈ 1 g cm⁻³), g. The mass of the dissolved solid is neglected.
Understanding the Question
You are asked to calculate the energy change in Joules for your experiment, using the temperature change recorded in part (a). This is the numerator you will use in part (b)(iii).
Approach
Substitute , , and your from part (a) into .
Step-by-Step Reasoning
Using the representative °C:
The mark scheme specifies exactly , so the volume of water (30.0 cm³) is taken as the mass in grams.
Key Takeaways
is the core equation for calorimetry. The mass is the mass of the water (≈ its volume in cm³), not the total mass of the solution.
Common Mistakes
- Using the mass of FA 3 instead of the mass of water.
- Using the final temperature instead of the temperature change.
- Forgetting that is the difference, not a single reading.
Things to Be Careful About
- Answer to 2–4 significant figures.
- The unit is J (Joules).
- is taken as a positive number here; the sign is handled in part (b)(iii).
Calculate the enthalpy change, , in , when of hydrated sodium thiosulfate dissolves in water. Show your working.
Working
The temperature decreases, so the process is endothermic and is positive.
Answer
+17.4 kJ mol⁻¹
+17.4 kJ mol^-1
Background Concept
The enthalpy change of solution is the energy change per mole of solute: , where is the energy change in J and is the amount in mol. Because the temperature falls as the salt dissolves, the process is endothermic — heat is absorbed from the water — so is positive. The energy in J must be converted to kJ by dividing by 1000.
Understanding the Question
You are asked to combine the energy change from (b)(ii) and the amount from (b)(i) to find the enthalpy change per mole, in kJ mol⁻¹, with the correct sign.
Approach
Divide the energy change (in J) by the amount (in mol) to get J mol⁻¹, then divide by 1000 to convert to kJ mol⁻¹. Assign the sign from the direction of the temperature change: a fall means endothermic, so positive.
Step-by-Step Reasoning
Using the representative values:
The temperature decreased, so the process is endothermic and the sign is positive: kJ mol⁻¹.
Key Takeaways
with the sign determined by whether the temperature rises (exothermic, negative) or falls (endothermic, positive). Always convert J to kJ for in kJ mol⁻¹.
Common Mistakes
- Omitting the sign — the mark scheme requires the plus sign to be shown.
- Forgetting to divide by 1000 to convert J to kJ.
- Using the wrong amount (e.g. the mass instead of the moles).
Things to Be Careful About
- The sign must be explicitly shown: +17.4 kJ mol⁻¹.
- Answer to 2–4 significant figures.
- The calculation must use (b)(ii) ÷ (b)(i) × 1000.
The value calculated in (b)(iii) can be used to determine the enthalpy change, , for the following reaction.
Outline the method of one further experiment you would need to carry out to obtain the data necessary to calculate the value of .
Show how you would use your results from this experiment and (b)(iii) to calculate .
Do not carry out your experiment.
method ......................................................................................................................................
...................................................................................................................................................
...................................................................................................................................................
calculation .................................................................................................................................
...................................................................................................................................................
Answer
Method: Repeat the experiment in (a) using anhydrous sodium thiosulfate, , instead of the hydrated salt. Transfer a known volume of distilled water (e.g. 30.0 cm³) to the cup, weigh a known mass of anhydrous , add it, stir, and record the temperature change. Calculate the enthalpy change, , for in the same way as in (b).
Calculation: By Hess's law,
where is the enthalpy change for .
Repeat the dissolution experiment with anhydrous Na2S2O3; ΔHr = ΔH2 − ΔH(b)(iii)
Background Concept
Hess's law states that the enthalpy change of a reaction is independent of the route taken, provided the initial and final states are the same. This allows you to combine enthalpy changes of individual steps to find the enthalpy change of a reaction that is difficult to measure directly.
Here the target reaction is the hydration of anhydrous sodium thiosulfate:
You already have from (b)(iii) for dissolving the hydrated salt:
You need one further experiment: dissolving anhydrous in water to give .
Understanding the Question
You must outline a further experiment and show how to combine its result with (b)(iii) to calculate . You are told not to carry out the experiment — only to describe it and show the calculation.
Approach
Design an experiment identical in method to part (a) but using anhydrous instead of the hydrated salt. Then construct a Hess cycle that links the two dissolution reactions to the hydration reaction.
Step-by-Step Reasoning
The further experiment: dissolve a known mass of anhydrous in a known volume of water, measure the temperature change, and calculate the enthalpy change for:
The mark scheme requires any two of: known volume of water, known mass of solid, measuring the temperature change.
Now construct the Hess cycle. Route 1 is the direct hydration:
Route 2 goes via the aqueous solution:
The second step is the reverse of the dissolution measured in (b)(iii), so its enthalpy change is .
By Hess's law:
Key Takeaways
Hess's law lets you combine enthalpy changes of dissolution to find a hydration enthalpy. Reversing a reaction reverses the sign of its enthalpy change. The experiment must measure the same quantities (mass, volume, temperature change) for the anhydrous salt.
Common Mistakes
- Repeating the experiment with the hydrated salt again instead of the anhydrous salt.
- Getting the sign wrong: the hydration enthalpy is , not .
- Not mentioning Hess's law — the mark scheme requires it.
- Omitting the key experimental details (known volume of water, known mass of solid, measuring the temperature change).
Things to Be Careful About
- The calculation must clearly show .
- Name the enthalpy change from the additional experiment as and the one from (b)(iii) as to avoid confusion.
- The reverse of the hydrated dissolution has enthalpy change .
Qualitative analysis
For each test you should record all your observations in the spaces provided.
Examples of observations include:
- colour changes seen
- the formation of any precipitate and its solubility (where appropriate) in an excess of the reagent added
- the formation of any gas and its identification (where appropriate) by a suitable test.
You should record clearly at what stage in a test an observation is made.
Where no change is observed, you should write ‘no change’.
Where reagents are selected for use in a test, the name or correct formula of the element or compound must be given.
If any solution is warmed, a boiling tube must be used. If a solid is heated, a hard-glass test-tube must be used.
Rinse and reuse test-tubes and boiling tubes where possible.
No additional tests should be attempted.
Half-fill the beaker with water and place it on a tripod and gauze. Heat the water until boiling then switch off your Bunsen burner. This will be your hot water bath for use in (b)(i). Start (a)(i) while the water is heating.
FA 4 is an aqueous solution containing three ions. One ion is not listed in the Qualitative analysis notes. FA 5 is an aqueous solution containing two ions. The cation in FA 5 is listed in the Qualitative analysis notes. The anions in both FA 4 and FA 5 contain sulfur.
Carry out the following tests using a depth of either FA 4 or FA 5 in a test-tube. Record your observations in Table 3.1.
Table 3.1
| test | observations: FA 4 | observations: FA 5 |
|---|---|---|
| Test 1 Add aqueous sodium hydroxide. | ||
| Test 2 Add aqueous ammonia. | ||
| Test 3 Add aqueous sodium carbonate. | ||
| Test 4 Add aqueous barium chloride or aqueous barium nitrate. | ||
| Test 5 Add acidified aqueous potassium manganate(VII). |
Answer
Expected observations (candidate records their own in Table 3.1):
| test | FA 4 | FA 5 |
|---|---|---|
| Test 1: + NaOH(aq) | red-brown / brown precipitate; insoluble in excess | white precipitate; soluble in excess |
| Test 2: + NH3(aq) | red-brown / brown precipitate; insoluble in excess | white precipitate; insoluble in excess |
| Test 3: + Na2CO3(aq) | fizzing; gas gives white precipitate with limewater; red-brown precipitate | white precipitate; fizzing; gas gives white precipitate with limewater |
| Test 4: + BaCl2(aq) / Ba(NO3)2(aq) | white precipitate | white precipitate |
| Test 5: + H+/KMnO4(aq) | stays purple / no change | stays purple / no change |
See working (candidate-dependent observations)
Background Concept
This part tests the qualitative analysis of cations and anions in aqueous solution. The key reactions are:
- Iron(III), : With or , forms a red-brown precipitate of iron(III) hydroxide, . This precipitate is insoluble in excess and in excess .
- Aluminium, : With , forms a white precipitate of , which dissolves in excess to form the colourless tetrahydroxoaluminate(III) ion, . With , also forms white , but this is insoluble in excess . This difference (soluble in excess but not in excess ) is the classic way to confirm .
- Sulfate, : With (from or ), sulfate forms a white precipitate of barium sulfate, , which is insoluble in dilute acid.
- Acid (): ions react with carbonate ions, , to produce carbon dioxide gas, which fizzes and turns limewater milky (white precipitate of ).
- Acidified : A strong oxidising agent. In the absence of a reducing agent, the purple colour persists (no change).
Understanding the Question
The candidate performs five standard qualitative tests on two unknown solutions, FA 4 and FA 5, and records observations in Table 3.1. The stem tells us FA 4 contains three ions (one not in the notes — from the acid), FA 5 contains two ions, and the anions in both contain sulfur (). The candidate does not know the identities and must deduce them in (a)(ii).
Approach
For each test, predict what a well-prepared candidate would observe. The tests are designed to:
- Test 1 (NaOH): distinguish cations by precipitate colour and solubility in excess
- Test 2 (NH3): further distinguish cations ( gives a white ppt insoluble in excess NH3; gives a red-brown ppt)
- Test 3 (Na2CO3): detect (CO2 fizzing) and cations (precipitates with carbonate)
- Test 4 (BaCl2/Ba(NO3)2): confirm sulfate (white ppt)
- Test 5 (acidified KMnO4): confirm absence of reducing agents (purple persists)
Step-by-Step Reasoning
Test 1 — add aqueous NaOH:
- FA 4: , a red-brown precipitate. is insoluble in excess , so the precipitate persists.
- FA 5: , a white precipitate. On adding excess , dissolves: , giving a colourless solution.
Test 2 — add aqueous NH3:
- FA 4: , a red-brown precipitate, insoluble in excess .
- FA 5: , a white precipitate, insoluble in excess . (Unlike with , does not dissolve in excess .)
Test 3 — add aqueous Na2CO3:
- FA 4: The reacts: . Fizzing/effervescence; the gas turns limewater milky. also forms a red-brown precipitate ( or hydrated ).
- FA 5: forms a white precipitate (). hydrolyses in water making the solution slightly acidic, so is also produced (fizzing), and the gas turns limewater milky.
Test 4 — add BaCl2(aq) or Ba(NO3)2(aq):
- Both: , a white precipitate. This confirms sulfate.
Test 5 — add acidified KMnO4:
- Both: No reducing agent present (, , are not reducing agents), so the purple colour of persists — no change.
Key Takeaways
- gives a red-brown ppt () insoluble in excess and .
- gives a white ppt () soluble in excess but insoluble in excess .
- gives a white ppt with .
- turns limewater milky.
- Acidified stays purple in the absence of reducing agents.
Common Mistakes
- Writing "brown" instead of "red-brown" for — the mark scheme accepts red-brown or brown.
- Saying dissolves in excess — it does NOT; it dissolves in excess only.
- Forgetting to record solubility in excess reagent — this is a key observation for cation identification.
- Not testing the gas with limewater — the gas from must be identified as .
- Writing "no reaction" instead of "no change" — the mark scheme wants the observation recorded.
Things to Be Careful About
- Record observations at the correct stage (e.g., "on adding NaOH, white ppt forms; on adding excess NaOH, ppt dissolves").
- Use correct terminology: "precipitate", "fizzing/effervescence", "turns limewater milky".
- The mark scheme awards marks for each correct observation (2 stars = 1 mark, rounded down), so record every observation.
- For FA 4, the limewater test for is a key observation; for FA 5, the limewater mark is only awarded if not already awarded for FA 4.
From your observations in (a)(i), deduce the identities of the ions present in FA 4 and FA 5. Give the formula of each ion in Table 3.2. If you are unable to identify an ion write ‘unknown’.
Table 3.2
| ions present | FA 4 | FA 5 |
|---|---|---|
| cations | ||
| anions |
Answer
| ions | FA 4 | FA 5 |
|---|---|---|
| cations | , | |
| anions |
FA 4: Fe3+, H+, SO4^2-; FA 5: Al3+, SO4^2-
Background Concept
The qualitative tests performed in (a)(i) give characteristic observations for specific ions:
- Red-brown precipitate with or , insoluble in excess →
- White precipitate with , soluble in excess but insoluble in excess →
- White precipitate with →
- Fizzing with , gas turns limewater milky → (acid) present, producing
Understanding the Question
The candidate uses the observations recorded in Table 3.1 to deduce the identities of the ions in FA 4 and FA 5. FA 4 contains three ions (one not in the notes — ), FA 5 contains two ions. The anions in both contain sulfur.
Approach
Match each observation to the ion that produces it:
- Red-brown ppt insoluble in excess and →
- White ppt soluble in excess but insoluble in excess →
- White ppt with →
- Fizzing with () → present
Step-by-Step Reasoning
- FA 4 gives a red-brown precipitate with and , insoluble in excess → .
- FA 4 fizzes with and the gas turns limewater milky → present (this is the third ion, not in the notes).
- FA 4 gives a white precipitate with → .
- FA 5 gives a white precipitate with , soluble in excess → .
- FA 5 gives a white precipitate with → .
- FA 5 does not give a red-brown precipitate → no .
Key Takeaways
- Observations must be matched to specific ions.
- The solubility of a precipitate in excess reagent is a key distinguishing feature.
- from carbonate confirms the presence of acid ().
Common Mistakes
- Confusing and — remember the colour difference (red-brown vs white) and solubility in excess .
- Forgetting in FA 4 — the stem says three ions, one not in the notes; the fizzing with identifies it.
- Writing instead of — the red-brown precipitate with is characteristic of , not (which gives a green precipitate).
Things to Be Careful About
- The mark scheme awards 3 marks for 5 correct ions, 2 marks for 3–4 correct, 1 mark for 2 correct.
- Use correct formulae: , , , .
- The anion in both is (sulfur-containing).
Both FA 6 and FA 7 are one of propan-1-ol, propan-2-ol, methanoic acid or ethanoic acid. You will carry out tests to investigate the identities of FA 6 and FA 7. For each test use a depth of FA 6 or FA 7 in a test-tube. Record your observations in Table 3.3.
Table 3.3
| test | observations: FA 6 | observations: FA 7 |
|---|---|---|
| Test 1 Add a few drops of acidified aqueous potassium manganate(VII), then | ||
| place the test-tube in the hot water bath. | ||
| Test 2 Add a depth of aqueous iodine followed by drops of aqueous sodium hydroxide until the colour just disappears. | ||
| If no reaction is visible, place the test-tube in the hot water bath. | ||
| Test 3 Add aqueous sodium carbonate. |
Answer
Expected observations (candidate records their own in Table 3.3):
| test | FA 6 | FA 7 |
|---|---|---|
| Test 1: + H+/KMnO4(aq), warm | decolourises / turns colourless / turns (pale) yellow | decolourises / turns colourless / turns (pale) yellow |
| Test 2: + I2(aq) + NaOH (and warm) | no change | (pale) yellow precipitate |
| Test 3: + Na2CO3(aq) | fizzing | no change |
See working (candidate-dependent observations)
Background Concept
This part tests qualitative analysis of organic compounds:
- Acidified is a strong oxidising agent. It is decolourised (purple → colourless) by compounds that can be oxidised, such as primary alcohols (→ aldehydes/carboxylic acids), secondary alcohols (→ ketones), and methanoic acid (→ ). Alkanes and carboxylic acids other than methanoic acid do not decolourise it.
- Iodoform test (): A positive test (pale yellow precipitate of , iodoform/tri-iodomethane) is given by compounds with the group (e.g., ethanol, propan-2-ol) or the group (e.g., methyl ketones). Propan-1-ol and methanoic acid give a negative result.
- : Carboxylic acids react with carbonate to produce (fizzing). Alcohols do not react.
Understanding the Question
The candidate performs three tests on FA 6 and FA 7, which are two of: propan-1-ol, propan-2-ol, methanoic acid, ethanoic acid. The tests are: (1) acidified with warming, (2) iodoform test (), (3) . The candidate records observations in Table 3.3.
Approach
For each compound, predict which tests give positive results:
- Methanoic acid: decolourises (oxidised to ), negative iodoform, fizzes with (acid)
- Ethanoic acid: does NOT decolourise (already fully oxidised at the carbonyl carbon), negative iodoform, fizzes with (acid)
- Propan-1-ol: decolourises (primary alcohol → propanoic acid), negative iodoform (no group), no reaction with
- Propan-2-ol: decolourises (secondary alcohol → propanone), positive iodoform ( has the group), no reaction with
Step-by-Step Reasoning
Test 1 — acidified , warm:
- FA 6 (methanoic acid): is oxidised to , so is decolourised (purple → colourless/pale yellow).
- FA 7 (propan-2-ol): Secondary alcohol oxidised to propanone, so is decolourised.
Test 2 — (iodoform test):
- FA 6 (methanoic acid): No or group → no change (negative).
- FA 7 (propan-2-ol): Has the group → positive iodoform test, pale yellow precipitate of .
Test 3 — :
- FA 6 (methanoic acid): Carboxylic acid reacts with carbonate → , fizzing.
- FA 7 (propan-2-ol): Alcohol, not acidic → no change.
Key Takeaways
- Acidified tests for oxidisable compounds (alcohols, methanoic acid).
- The iodoform test is positive for compounds with the or group.
- fizzing identifies carboxylic acids.
Common Mistakes
- Confusing propan-1-ol and propan-2-ol — propan-1-ol gives a negative iodoform test, propan-2-ol gives a positive one.
- Thinking ethanoic acid decolourises — it does not (it is already fully oxidised at the carbonyl carbon).
- Forgetting to warm the mixture — the oxidation may be slow at room temperature.
Things to Be Careful About
- The iodoform precipitate is pale yellow ().
- The observation may be described as "turns paler pink", "decolourises", "turns colourless", or "turns (pale) yellow" — all accepted.
- Record the stage at which the observation is made (e.g., "on warming").
From your observations in (b)(i) deduce the identities of FA 6 and FA 7. Give reasons for your answers.
FA 6 is .............................
reasons .............................................................................................................................
...........................................................................................................................................
FA 7 is .............................
reasons .............................................................................................................................
...........................................................................................................................................
Answer
FA 6 is methanoic acid () because it produces (reacts with sodium carbonate, fizzing) and it can be oxidised (reacts with / decolourises acidified ).
FA 7 is propan-2-ol because it gives a (pale) yellow precipitate in the iodoform test (test 2), showing the presence of the group.
FA 6: methanoic acid; FA 7: propan-2-ol
Background Concept
The observations from (b)(i) allow identification of the compounds:
- Fizzing with → carboxylic acid (methanoic or ethanoic acid)
- Decolourising → oxidisable compound (methanoic acid, propan-1-ol, propan-2-ol; NOT ethanoic acid)
- Positive iodoform test → group (propan-2-ol) or group
Understanding the Question
The candidate uses the observations from Table 3.3 to deduce which compound is FA 6 and which is FA 7, giving reasons. The stem limits the possibilities to propan-1-ol, propan-2-ol, methanoic acid, or ethanoic acid.
Approach
Combine the evidence:
- FA 6 fizzes with (acid) AND decolourises (oxidisable) → methanoic acid (ethanoic acid would not decolourise ).
- FA 7 gives a positive iodoform test (pale yellow ppt) → propan-2-ol (has the group).
Step-by-Step Reasoning
- FA 6: Fizzes with → it is a carboxylic acid (methanoic or ethanoic). It decolourises → it can be oxidised. Methanoic acid is oxidised to ; ethanoic acid is not readily oxidised. Therefore FA 6 is methanoic acid.
- FA 7: Gives a pale yellow precipitate in the iodoform test → has the group. Among the four candidates, only propan-2-ol has this group (). Therefore FA 7 is propan-2-ol.
Key Takeaways
- A positive iodoform test identifies the (or ) group.
- Carboxylic acids fizz with ; methanoic acid is unique among simple carboxylic acids in also reducing .
Common Mistakes
- Saying FA 6 is ethanoic acid — ethanoic acid does not decolourise .
- Saying FA 7 is propan-1-ol — propan-1-ol gives a negative iodoform test.
Things to Be Careful About
- Give reasons linked to observations, not just the name.
- The mark scheme accepts "gives a positive tri-iodomethane/iodoform test" or "has the group" as reasons for FA 7.
A student carrying out a similar set of tests identifies two unknown compounds to be ethanol and propanoic acid.
Write an equation for the reaction between these two compounds.
Answer
CH3CH2COOH + CH3CH2OH -> CH3CH2COOCH2CH3 + H2O
Background Concept
Ethanol () is a primary alcohol; propanoic acid () is a carboxylic acid. They react together in an esterification (condensation) reaction, catalysed by concentrated , to form an ester (ethyl propanoate) and water.
Understanding the Question
Write a balanced equation for the reaction between ethanol and propanoic acid. The question provides the identities of the two compounds and asks for the equation of their reaction.
Approach
In esterification, the of the acid and the of the alcohol's group are removed as water; the remaining fragments join to form the ester.
Step-by-Step Reasoning
- Propanoic acid: → loses →
- Ethanol: → loses →
- Ester: (ethyl propanoate)
- Water:
- Balanced equation:
Key Takeaways
- Esterification: carboxylic acid + alcohol → ester + water.
- The ester name is derived from the alcohol (ethyl) and the acid (propanoate).
Common Mistakes
- Forgetting water as a product.
- Getting the ester formula wrong — the alkyl group from the alcohol () attaches to the oxygen, and the acyl group from the acid () attaches to that oxygen.
Things to Be Careful About
- The equation must be balanced.
- The mark scheme accepts either full structural formula or condensed formula: .