Chemistry 9701/33 — February/March 2024
Cambridge AS Level · Advanced Practical Skills · worked solutions for every part, with the mark scheme
Topics Manipulation, Measurement and Observation · Analysis, Conclusions and Evaluation · Presentation of Data and Observations · Qualitative Analysis
The ionic equation for the reaction between sodium thiosulfate and hydrochloric acid is:
The solid sulfur formed causes the reaction mixture to become cloudy and opaque.
You will carry out experiments to investigate the relationship between the concentration of sodium thiosulfate and the rate of reaction.
Small amounts of gas are released during this reaction. Take care to avoid inhaling this gas. It is important that, as soon as each experiment is complete, the contents of the beaker are emptied into the quenching bath and the beaker is rinsed thoroughly.
FA 1 is sodium thiosulfate, .
FA 2 is hydrochloric acid, .
distilled water
Prepare a table for your results in the Results section on page 4. For each experiment the table should include:
- volume of FA 1 used
- volume of distilled water used
- reaction time
- relative rate.
Relative rate can be calculated using the expression:
Experiment 1
- Label a burette FA 1. Fill the burette with FA 1.
- Transfer of FA 1 into a beaker.
- Place the beaker on the printed insert.
- Use the measuring cylinder to measure of FA 2.
- Add the FA 2 to the FA 1 in the beaker and immediately start the stop-clock. Stir the mixture once.
- Look vertically down through the solution in the beaker at the print on the insert.
- Stop the stop-clock as soon as the print on the insert is no longer visible.
- Record the reaction time to the nearest second.
- Empty the contents of the beaker into the quenching bath.
- Rinse the beaker with water. Dry the beaker so that it is ready to be used in Experiment 2.
Experiment 2
- Transfer of FA 1 into the beaker.
- Label a second burette 'water'. Fill this burette with distilled water.
- Transfer of distilled water into the beaker.
- Place the beaker on the printed insert.
- Use the measuring cylinder to measure of FA 2.
- Add the FA 2 to the solution in the beaker and immediately start the stop-clock. Stir the mixture once.
- Look vertically down through the solution in the beaker at the print on the insert.
- Stop the stop-clock as soon as the print on the insert is no longer visible.
- Record the reaction time to the nearest second.
- Empty the contents of the beaker into the quenching bath.
- Rinse the beaker with water. Dry the beaker so that it is ready to be used in the next experiment.
Experiments 3–5
Carry out three further experiments to investigate how reaction times change with different volumes of FA 1. Do not use a volume of FA 1 less than .
Results
Answer
Construct a single table with four columns, each headed with the quantity and its unit:
| volume of FA 1 / cm | volume of distilled water / cm | (reaction) time / s | rate / s |
|---|---|---|---|
| 25.00 | 0.00 | 36 | 28 |
| 12.50 | 12.50 | 72 | 14 |
| 20.00 | 5.00 | 45 | 22 |
| 17.50 | 7.50 | 51 | 20 |
| 15.00 | 10.00 | 61 | 16 |
(Values above are a representative example; the candidate's own readings are used.)
- All volumes are recorded to two decimal places with the final digit 0 or 5 (e.g. 25.00, 12.50, 20.00).
- All reaction times are recorded to the nearest second.
- Three further volumes of FA 1 are chosen with intervals of at least 2.00 cm and none below 12.50 cm; distilled water is added so that (volume of FA 1 + volume of water) = 25.00 cm in every experiment.
- Relative rate is calculated as to at least 2 significant figures.
- The reaction time decreases as the volume of FA 1 increases for all five experiments.
A four-column table with correct headings and units, volumes to 2 d.p. (ending 0 or 5), times to the nearest second, three additional FA 1 volumes (intervals >= 2.00 cm^3, none < 12.50 cm^3) with water topping up to 25.00 cm^3, rates = 1000/time to 2 s.f., and time decreasing as volume of FA 1 increases.
Background Concept
This is a classic rate-of-reaction practical. Sodium thiosulfate reacts with dilute hydrochloric acid to produce a fine precipitate of sulfur, which clouds the solution. The time taken for the solution to become opaque enough to hide a mark seen through it is a measure of how fast the reaction has proceeded. Because the same amount of sulfur is required to obscure the mark, the reaction time is inversely proportional to the rate, so is used as a convenient rate measure. The concentration of thiosulfate is varied by diluting a fixed total volume (25.00 cm) of thiosulfate plus water with the same volume of acid in every experiment.
Understanding the Question
You must build a results table that records four quantities for five experiments: volume of FA 1, volume of distilled water, reaction time, and relative rate. The command is to prepare the table and carry out the experiments, so marks are awarded for the structure, the precision of the recorded data, the sensible choice of additional volumes, and the correct calculation of the rate column. The final two marks compare the time from Experiment 2 (12.50 cm) with that from Experiment 1 (25.00 cm) via the ratio .
Approach
- Set up a single table with four clearly headed columns including units.
- Record burette volumes to 2 d.p. ending in 0 or 5 (burette precision) and times to the nearest second.
- For the three extra experiments, halve or otherwise reduce the FA 1 volume in steps of at least 2.00 cm but never below 12.50 cm, replacing the removed thiosulfate with water so the combined (FA 1 + water) volume stays 25.00 cm.
- Compute each rate as to 2 s.f.
- Check the trend: more thiosulfate (higher concentration) means a faster reaction and a shorter time.
Step-by-Step Reasoning
- Headings and units (B1): Each column needs both the quantity and its unit. Acceptable forms are "volume of FA 1 / cm" or "volume of FA 1 (cm)" or "volume of FA 1 in cm"; likewise water in cm, time in s (or seconds), and rate in s. Missing units lose this mark.
- Precision (B1): A burette reads to 0.05 cm, so volumes must appear as 25.00, 12.50, 20.00 etc. — two decimal places with the last digit 0 or 5. Times are read from a stop-clock to the nearest whole second. Writing 25 cm or 36.4 s would not satisfy this.
- Choice of additional volumes (B1): Three more experiments are needed. The intervals between chosen FA 1 volumes must be at least 2.00 cm and none may fall below 12.50 cm. Crucially, water must top the mixture back to 25.00 cm so that the acid concentration and total volume are kept constant — only the thiosulfate concentration changes.
- Rate calculation (B1): Apply to every row to at least 2 s.f. (e.g. time 36 s gives 27.78 -> 28 s).
- Trend (B1): The recorded times must decrease as the volume of FA 1 increases across all five experiments; this reflects the higher thiosulfate concentration giving a faster reaction.
- Ratio marks (B2): The examiner forms from the corrected times. A ratio between 1.70 and 2.40 earns one mark; between 1.90 and 2.20 earns both. Halving the concentration roughly halves the rate (first order in thiosulfate), so the time should roughly double — hence a ratio near 2.
Key Takeaways
- Use the correct precision for the apparatus: burette volumes to 2 d.p. ending 0 or 5; stop-clock times to the nearest second.
- When investigating concentration, keep the total volume constant by topping up with water so only the species of interest changes.
- Relative rate is taken as ; a shorter time means a higher rate.
- For a first-order dependence on thiosulfate, halving its concentration approximately doubles the time.
Common Mistakes
- Recording volumes as 25 or 12.5 instead of 25.00 and 12.50 — loses the precision mark.
- Omitting units from the column headings.
- Choosing FA 1 volumes that fall below 12.50 cm or with intervals smaller than 2.00 cm.
- Forgetting to add water to make the (FA 1 + water) total 25.00 cm, which changes the dilution and invalidates the comparison.
- Calculating rates to only one significant figure or using by mistake.
Things to Be Careful About
- Keep the volume of acid (10.0 cm) and the total reaction volume identical in every experiment.
- Rate must be reported with the unit s (or as relative rate) and to at least 2 s.f.
- Ensure the time trend is monotonic with volume of FA 1; an inconsistent set of times will fail the trend mark and may distort the ratio marks.
Plot a graph, on the grid, of relative rate (-axis) against volume of FA 1 (-axis). The graph should not include the origin.
Identify any anomalous point.
Draw a line of best fit.

Answer
Plot relative rate (s) on the -axis against volume of FA 1 (cm) on the -axis.
- Label both axes unambiguously with the quantity and unit and mark the scale numbers.
- Use linear scales based on 1, 2 or 5, chosen so the plotted points fill more than half the grid along each axis (the origin is not plotted).
- Plot all five points from the table accurately, to within half a small square, using at least four points.
- Draw a single straight line of best fit through the points (the relationship is linear because rate is proportional to thiosulfate concentration).
- Circle any anomalous point.
A graph of relative rate against volume of FA 1 with labelled axes and units, linear 1/2/5 scales filling more than half the grid, all points plotted accurately, a line of best fit drawn, and any anomalous point identified.
Background Concept
When the rate of a reaction is directly proportional to the concentration of one reactant (first order in that reactant), plotting rate against the volume of that reactant (at fixed total volume, volume is proportional to concentration) gives a straight line through the origin. The practical grid here is used to display this linear relationship and to read off interpolated values.
Understanding the Question
You must transfer the table from part (a) onto the supplied grid: relative rate on the vertical axis, volume of FA 1 on the horizontal axis, deliberately excluding the origin. Marks are given for axis labelling, scale choice, accurate plotting of every tabulated point, and a line of best fit; anomalous points should be identified.
Approach
Choose scales that spread the data over more than half the grid in both directions using steps of 1, 2 or 5 per square. Plot each (volume, rate) pair to within half a small square. Draw one straight line of best fit that passes as close as possible to all points, ignoring any clearly anomalous point (which you circle).
Step-by-Step Reasoning
- Axes (B1): -axis labelled "(relative) rate" or "rate / s"; -axis labelled "volume of FA 1 / cm" (or thiosulfate / NaSO). Numbers must appear on the scales.
- Scales (B1): Linear, based on 1, 2 or 5 units per major square, and large enough that the points occupy more than half the grid each way. A cramped or awkward scale (e.g. 3 per square) loses this mark.
- Plotting (B1): Every point in the table is plotted correctly to within half a small square; a minimum of four points must appear.
- Line of best fit (B1): A single straight line drawn so the points are evenly distributed about it; do not join the dots. If a point is anomalous it is identified (circled) and not used to draw the line.
Key Takeaways
- Volume of FA 1 is proportional to thiosulfate concentration here, so rate vs volume is linear.
- Good scales use 1, 2 or 5 and fill the grid.
- A line of best fit is a single straight line, not a join-the-dots curve.
Common Mistakes
- Plotting the origin (the question explicitly says not to).
- Using a scale that puts all points in a small corner of the grid.
- Joining the points with straight segments instead of drawing a best-fit line.
- Forgetting units on the axes.
Things to Be Careful About
- Points must match the table exactly; an inaccurate plot propagates into part (c).
- Identify any anomalous point clearly so the examiner knows it was excluded from the line.
Use your graph to predict the reaction time if an experiment is carried out using of FA 1 and distilled water.
Show clearly on the grid how you determined the relative rate.
Working
On the grid, draw a vertical line from 23.50 cm on the -axis up to the line of best fit, then a horizontal line from that point to the -axis to read the relative rate.
For example, if the rate read off at 23.50 cm is 26 s:
Answer
reaction time s (value depends on the candidate's own graph; consistent with reading the line of best fit at 23.50 cm).
reaction time = 1000 / (relative rate read from the line of best fit at 23.50 cm^3), e.g. about 38 s
Background Concept
A line of best fit allows interpolation: a value between measured points can be read from the line. Since relative rate , the reaction time is recovered by .
Understanding the Question
Using the graph from part (b), predict the reaction time when 23.50 cm of FA 1 is used. You must show, on the grid, how the rate was obtained, then convert that rate to a time.
Approach
Read the relative rate off the line of best fit at cm using perpendicular guide lines, then substitute into .
Step-by-Step Reasoning
- M1: Draw the vertical line from 23.50 on the -axis to the best-fit line and the horizontal line from the intersection to the -axis; this shows how the rate was determined.
- M2 (A1): Use with the rate read from the graph to give the time in seconds. The numerical answer depends on the candidate's plotted line, so it is marked for the correct method and a value consistent with their graph.
Key Takeaways
- Interpolation from a line of best fit is done with guide lines, not by joining adjacent points.
- Invert the relative-rate definition to recover the time.
Common Mistakes
- Reading the rate off a plotted point rather than the line of best fit.
- Forgetting to invert: using .
- Not drawing the guide lines on the grid (loses M1).
Things to Be Careful About
- The final time must be consistent with the rate read from the candidate's own line; the examiner checks internal consistency rather than a fixed number.
The final instruction for each experiment is to rinse and dry the beaker.
State the effect on the reaction time of not drying the beaker before carrying out each of Experiments 2–5.
Explain your answer.
Answer
The reaction time would be longer. Any water left in the undried beaker adds to the volume of the reaction mixture, diluting the sodium thiosulfate (lowering its concentration), so the reaction proceeds more slowly and takes longer to become opaque.
Longer; residual water dilutes the reactants (lowers thiosulfate concentration), slowing the reaction.
Background Concept
The rate of this reaction depends on the concentration of thiosulfate. Anything that lowers the effective concentration of the reactants slows the reaction and lengthens the time for the sulfur precipitate to obscure the mark.
Understanding the Question
The method says to rinse and dry the beaker between experiments. You must state the effect of not drying it on the reaction time for Experiments 2-5 and explain why.
Approach
Consider what a wet beaker contributes: extra water. That water dilutes the reaction mixture, reducing thiosulfate concentration, so the rate falls and the time rises.
Step-by-Step Reasoning
- A wet beaker leaves droplets of water inside, increasing the total volume of the reaction mixture beyond the intended value.
- The number of moles of thiosulfate is unchanged but the volume is larger, so its concentration is lower.
- Lower concentration means fewer successful collisions per unit time, hence a slower reaction and a longer reaction time. Both the effect (longer) and the reason (dilution/lower concentration) are required for the mark.
Key Takeaways
- Residual solvent dilutes reactants and reduces concentration.
- Reduced concentration -> reduced rate -> increased reaction time.
Common Mistakes
- Stating only "longer" without the explanation, or only the explanation without the effect.
- Saying the water "adds reactant" or changes the amount of thiosulfate (it changes concentration, not moles).
Things to Be Careful About
- The answer must give both halves: the direction of the change in time and the dilution reason.
A student repeats Experiment 1 but uses a beaker in place of the beaker. All other conditions remain the same.
State whether each statement below is correct.
Explain your answers.
Answer
The student is correct. A 250 cm beaker is wider, so the same volume of mixture forms a shallower layer; a greater mass (and depth) of sulfur must form before the mark underneath is obscured, so the reaction time is longer.
Correct; the wider beaker gives a shallower depth of solution so more sulfur is needed to hide the insert, lengthening the time.
Background Concept
The end-point is judged by the mark on the insert disappearing when viewed from above. The cloudiness that hides it depends on the depth of sulfur suspended in the light path. For a given volume of mixture, a wider beaker gives a shallower column of liquid.
Understanding the Question
A student claims that using a 250 cm beaker instead of a 100 cm beaker (same volumes of solutions) gives a longer time. State whether this is correct and explain.
Approach
Same volume in a wider beaker -> smaller depth of liquid -> the mark is closer to the bottom and more sulfur must form before the line of sight is blocked -> longer time.
Step-by-Step Reasoning
- The volumes of FA 1, water and acid are unchanged, so the moles of reactants and their concentrations are the same as in Experiment 1.
- However, the 250 cm beaker has a larger base area, so the liquid layer is shallower.
- A shallower layer means the path length through the cloud is shorter; to reduce the transmitted light enough to hide the print, more sulfur (a greater depth of precipitate) must accumulate.
- Producing that extra sulfur takes longer, so the recorded time is greater. The student's statement is therefore correct, and the reason is the reduced depth of solution.
Key Takeaways
- The observed time depends on the geometry of the container (depth of the light path), not only on the chemistry.
- A wider beaker at fixed volume gives a shallower layer and a longer time to obscure the mark.
Common Mistakes
- Saying the time is unchanged because the concentrations are the same (ignores the depth effect).
- Attributing the longer time to a slower rate (the rate is the same; see part (ii)).
Things to Be Careful About
- The explanation must mention the depth of the solution/precipitate being less (or the beaker being wider/shallower).
Answer
The student is not correct. The concentrations of the reactants have not changed, so the frequency of successful collisions and the true rate of sulfur production are the same. The longer time is because more sulfur must form to fill the shallower column and hide the insert, not because the rate is slower.
Not correct; concentrations are unchanged so the rate is the same; the longer time is due to more sulfur being needed to obscure the mark, not a slower rate.
Background Concept
Reaction rate is governed by concentration, temperature and the frequency of successful collisions. The observed time to obscure a mark in this experiment is a proxy for rate only when the geometry is fixed; changing the beaker alters the amount of product needed to block the view without altering the chemistry.
Understanding the Question
A student attributes the longer time in the 250 cm beaker to a slower rate of production of sulfur. Decide whether this statement is correct and explain.
Approach
Check what actually controls the rate: the concentrations. Since these are unchanged, the rate is unchanged; the longer time must come from the geometry (more sulfur required), so the statement is wrong.
Step-by-Step Reasoning
- Using the same volumes of FA 1, water and acid means the reactant concentrations are identical to Experiment 1.
- By collision theory, identical concentrations (and temperature) give the same frequency of successful collisions, so the rate of sulfur formation is the same.
- The time is longer only because the shallower layer in the wider beaker requires a greater amount of sulfur to accumulate before the print is hidden. The rate is therefore not slower.
- Hence the student's explanation is incorrect; the correct reason is the larger amount of sulfur needed, not a reduced rate.
Key Takeaways
- Distinguish the measured quantity (time to obscure) from the underlying rate.
- Rate depends on concentration; container geometry affects how much product is needed to give the visual end-point.
Common Mistakes
- Agreeing with the student and claiming the rate is slower (concentrations are unchanged).
- Confusing "relative rate" (the proxy) with the true rate.
Things to Be Careful About
- The answer must state the student is not correct and justify it by noting the concentrations (and so the rate) are unchanged, with the longer time arising from needing more sulfur to obscure the insert.
In this experiment you will determine the enthalpy change, , for the reaction between aqueous copper(II) sulfate and magnesium.
FA 3 is copper(II) sulfate, .
FA 4 is magnesium powder, .
Method
- Support the cup in the beaker.
- Use the measuring cylinder to transfer of FA 3 into the cup.
- Weigh the stoppered container of FA 4. Record the mass.
- Measure the temperature of FA 3 in the cup. Record the temperature.
- Add the FA 4 to the FA 3 in the cup and stir the mixture constantly.
- Measure and record the maximum temperature reached.
- Reweigh the stoppered container and any residual FA 4. Record the mass.
- Calculate and record the mass of FA 4 used.
- Calculate and record the maximum temperature change that occurs during the reaction.
Answer
| Measurement | Value |
|---|---|
| Mass of container + FA 4 / g | 15.240 |
| Mass of container + residue / g | 14.740 |
| Initial temperature of FA 3 / °C | 21.0 |
| Maximum temperature of mixture / °C | 33.0 |
| Mass of magnesium (FA 4) added / g | 0.500 |
| Temperature change, / °C | 12.0 |
Note: Values shown are representative examples. Temperature readings must be to the nearest 0.5 °C and mass readings to a consistent 2 or 3 decimal places.
See table above. Record masses to 2 or 3 d.p. and temperatures to the nearest 0.5 °C.
Background Concept
In Paper 3 Advanced Practical Skills, candidates are assessed on their ability to collect, record, and process data from experiments. A fundamental requirement is presenting data in a clear, unambiguous table. Headings must combine the physical quantity and its unit (e.g., "Mass / g" or "Temperature / °C"), and all readings must be recorded to the precision dictated by the apparatus used.
For temperature, a standard laboratory thermometer is read to the nearest 0.5 °C. For mass, a digital balance is typically used to 2 or 3 decimal places (e.g., 0.001 g or 0.0001 g), and consistency across all balance readings in the table is mandatory.
Understanding the Question
Part (a) asks you to record the data collected during the enthalpy change experiment. The method specifies weighing the magnesium powder, measuring the initial temperature of the copper(II) sulfate solution, adding the magnesium, and recording the maximum temperature reached. You must set up a table with appropriate headings and record the values with the correct units and precision.
Approach
Construct a two-column table. The left column lists the measurements required by the method, and the right column provides the values. Ensure every heading includes the quantity and its unit. Apply the correct significant figures/decimal places based on the apparatus: temperatures to 0.5 °C, masses to a consistent number of decimal places (2 or 3). Calculate the derived quantities (mass of Mg used and ) and record them in the table.
Step-by-Step Reasoning
- Headings and units: Create headings for each measurement. For example, "Mass of container + FA 4 / g", "Initial temperature of FA 3 / °C", etc. The unit must be part of the heading.
- Recording raw readings:
- Mass readings: Record to 2 or 3 decimal places (e.g., 15.240 g and 14.740 g).
- Temperature readings: Record to the nearest 0.5 °C (e.g., 21.0 °C and 33.0 °C).
- Calculating derived values:
- Mass of Mg (FA 4) used = (Mass of container + FA 4) - (Mass of container + residue). Example: g.
- Temperature change () = Maximum temperature - Initial temperature. Example: °C.
- Consistency check: Ensure all mass readings use the same number of decimal places and that the calculated values are correct.
Key Takeaways
- Always include units in table headings, not in the data cells.
- Match the decimal places of balance readings to the precision of the balance used (usually 2 or 3 d.p.).
- Thermometer readings in A-Level practicals are typically recorded to the nearest 0.5 °C.
Common Mistakes
- Writing the unit in the data cells instead of the heading (e.g., writing "15.240 g" instead of "15.240").
- Recording temperatures to 1 decimal place (e.g., 21.0) when the mark scheme requires 0.5 °C precision (e.g., 21.0, 21.5, 22.0). Note: 21.0 is valid for 0.5 °C, but 21.3 is not.
- Mixing decimal places for mass readings (e.g., 15.24 g and 14.740 g).
Things to Be Careful About
- The examiner will check the calculated against the supervisor's value. Ensure your subtraction is correct.
- "Mass of magnesium added" is a calculated value, not a direct reading, but it must be included in the table with the correct unit (g).
Calculations
Working
The heat energy produced is calculated using:
where (assumed to have a density of , so ), , and is the temperature change from part (a).
Using a representative :
Answer
(Substitute your actual value from part (a) into the expression )
50.0 × 4.18 × ΔT J (e.g., 2508 J for ΔT = 12.0 °C)
Background Concept
The heat energy () absorbed or released by a solution in a simple calorimetry experiment is calculated using the equation:
where:
- is the mass of the solution in grams. For dilute aqueous solutions, the density is assumed to be , so the mass in grams is numerically equal to the volume in cm³.
- is the specific heat capacity of the solution. For dilute aqueous solutions, this is taken as (or J g⁻¹ °C⁻¹).
- is the temperature change in °C or K.
The result is in joules (J). To find the enthalpy change per mole, this value must be converted to kilojoules (kJ) by dividing by 1000.
Understanding the Question
Part (b)(i) asks for the total heat energy produced in the reaction. You are given the volume of FA 3 (50.0 cm³) and the specific heat capacity is implicitly 4.18 J g⁻¹ °C⁻¹. You must use the measured in part (a).
Approach
Substitute the known values into . The mass of the solution is taken as the mass of the aqueous copper(II) sulfate solution (50.0 g), ignoring the small mass of the solid magnesium and the copper produced, as is standard in these calculations unless stated otherwise. Calculate the numerical value using your recorded .
Step-by-Step Reasoning
- Identify the mass of the solution: .
- Identify the specific heat capacity: .
- Use the from part (a). For example, if :
- The answer must be given to 2–4 significant figures. 2508 has 4 sf.
Key Takeaways
- In simple calorimetry, assume the density and specific heat capacity of the solution are the same as water.
- Always use the mass of the solution, not the total mass of all reactants, unless the question specifically instructs otherwise.
Common Mistakes
- Using the total mass of reactants (e.g., adding the mass of Mg) instead of just the mass of the aqueous solution.
- Forgetting to convert J to kJ in part (b)(iii).
- Using the wrong value for (e.g., 4.18 kJ instead of J).
Things to Be Careful About
- The mark scheme allows the answer to 2–4 significant figures. Do not over-round.
- Ensure you use the from your own part (a), not a standard value.
Determine which reactant, FA 3 or FA 4, is in excess for the reaction.
Show your working.
Answer
Moles of FA 3 ():
Moles of FA 4 (Mg):
(Using a representative mass of 0.500 g: )
The reaction stoichiometry is 1:1. Since , FA 3 () is in excess.
Working
Amount of FA 3 =
Amount of FA 4 =
(FA 3) is in excess.
FA 3 () is in excess.
Background Concept
To determine which reactant is in excess, you must calculate the number of moles of each reactant and compare them using the stoichiometric ratio from the balanced chemical equation. The reactant that is completely consumed is the limiting reactant; the other is in excess.
The balanced equation is:
The molar ratio of to Mg is 1:1.
Understanding the Question
Part (b)(ii) asks you to determine which reactant is in excess and show your working. You have the concentration and volume of FA 3, and the mass of FA 4 (from your table in part a).
Approach
- Calculate moles of using .
- Calculate moles of Mg using .
- Compare the two values. Since the ratio is 1:1, the reactant with the larger number of moles is in excess.
Step-by-Step Reasoning
- Moles of FA 3 ():
- Moles of FA 4 (Mg): For a typical mass of 0.500 g:
- Comparison:
The reaction requires 1 mol of Mg for every 1 mol of . Since , there is more than needed. Therefore, (FA 3) is in excess, and Mg is the limiting reactant.
Key Takeaways
- Always use the limiting reactant to calculate the theoretical yield or enthalpy change.
- In this experiment, Mg is typically the limiting reactant because it is added in a small mass, while the solution is in excess to ensure all the Mg reacts.
Common Mistakes
- Using the mass of Mg as the moles (forgetting to divide by ).
- Using the wrong molar mass for Mg (e.g., 12 instead of 24.3).
- Concluding Mg is in excess because it is a solid and there is "more" of it by volume (incorrect reasoning; must compare moles).
Things to Be Careful About
- The mark scheme requires you to show the calculation for both amounts. Even if you know FA 3 is in excess, you must write and .
- Use the candidate's actual mass of Mg in the calculation.
Working
The enthalpy change is calculated using:
where is the heat energy from part (b)(i) in joules, and is the moles of the limiting reactant (Mg) from part (b)(ii).
Convert to kJ:
(Using representative values: , )
Answer
(Sign is negative; value depends on candidate's data, typically between -100 and -150 kJ mol⁻¹)
e.g., -122 kJ mol⁻¹ (sign must be negative)
Background Concept
The enthalpy change of reaction () is the heat energy transferred per mole of limiting reactant. For an exothermic reaction (temperature increases), is negative. For an endothermic reaction (temperature decreases), is positive.
The formula is:
where is the heat energy in joules (converted to kJ by dividing by 1000), and is the number of moles of the limiting reactant that reacted.
The negative sign is included because the heat energy produced by the reaction () is released to the surroundings, so the system loses energy.
Understanding the Question
Part (b)(iii) asks for the enthalpy change in kJ mol⁻¹. You must use the heat energy calculated in (b)(i) and the moles of the limiting reactant (Mg) calculated in (b)(ii). The sign must be negative because the reaction is exothermic (temperature increased).
Approach
- Convert from J to kJ.
- Divide by the moles of Mg (the limiting reactant).
- Apply a negative sign to the result.
Step-by-Step Reasoning
- Heat energy in kJ:
- Moles of limiting reactant (Mg):
- Calculate :
- Significant figures: The answer should be given to 2–4 significant figures. (3 sf) is acceptable.
Key Takeaways
- Always use the moles of the limiting reactant, not the excess reactant.
- Remember to convert J to kJ (divide by 1000).
- The sign of must be negative for an exothermic reaction. The mark scheme explicitly requires a negative sign.
Common Mistakes
- Forgetting to convert J to kJ, giving an answer like .
- Forgetting the negative sign (giving ).
- Using the moles of the excess reactant () instead of Mg.
- Using the total heat energy without dividing by moles.
Things to Be Careful About
- The mark scheme awards M1 for the correct method () and A1 for the correct sign and value.
- Even if your is wrong, you can still get method marks if you use your own value correctly (error carried forward).
A student suggests that the slow rate of the reaction using the method described in (a) means that heat energy is lost from the solution so the temperature change is inaccurate.
Describe how you would change the method and processing of the results to improve the accuracy of the enthalpy change for this reaction. You should not change the quantities of FA 3 or FA 4 used.
You may wish to illustrate your answer with a sketch graph.
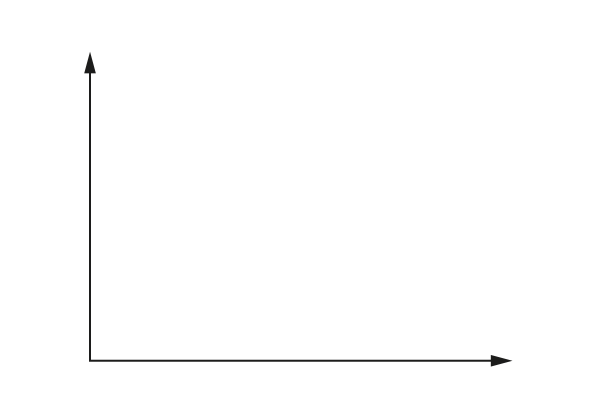
Answer
Method improvements:
- Measure the temperature of FA 3 at regular intervals (e.g., every 30 seconds) before adding FA 4.
- After adding FA 4 and stirring, measure the temperature of the mixture at regular intervals until the temperature is steady or begins to decrease.
Graph and processing:
- Plot a graph of temperature against time.
- Clearly label or indicate the point of addition of FA 4 on the graph.
- Draw a line of best fit for the initial temperature readings (before addition) and another line of best fit for the temperature readings after the peak.
- Extrapolate both lines of best fit to the time of addition of FA 4.
- The difference between the extrapolated temperatures gives the corrected (maximum temperature change), accounting for heat lost during the slow reaction.
See method and graph description above. Extrapolate lines of best fit to find corrected .
Background Concept
In simple calorimetry experiments, heat is inevitably lost to the surroundings (the cup, the beaker, the air) during the reaction. If the reaction is fast, the maximum temperature is reached almost instantly, and the heat loss is minimal. However, if the reaction is slow (as with copper(II) sulfate and magnesium powder), heat is lost continuously while the temperature is still rising. This means the recorded maximum temperature is lower than the true maximum, leading to an underestimated and an underestimated (less negative) enthalpy change.
The standard improvement to correct for this is the extrapolation method.
Understanding the Question
Part (c) asks how to improve the accuracy of the enthalpy change for this slow reaction without changing the quantities of reactants. You must describe changes to the method and the processing of results, and may illustrate with a sketch graph.
Approach
- Method change: Take temperature readings at regular intervals before and after the reaction, rather than just the initial and final temperatures.
- Processing: Plot a temperature-time graph. Draw lines of best fit for the pre-reaction and post-reaction periods. Extrapolate these lines to the time of reaction to find the corrected temperature change.
Step-by-Step Reasoning
- Before adding FA 4: Measure the temperature of FA 3 every 30 seconds (or at regular intervals) for 2–3 minutes. This establishes a baseline cooling (or heating) rate of the solution before the reaction starts.
- At the time of addition: Record the exact time FA 4 is added. This is a critical point on the graph.
- After adding FA 4: Stir constantly and measure the temperature at regular intervals (e.g., every 30 seconds) until the temperature reaches a maximum and then begins to decrease steadily.
- Graph: Plot temperature (y-axis) against time (x-axis). Mark the time of addition of FA 4 with a vertical dashed line or a clear label.
- Lines of best fit:
- Draw a line through the initial temperature points (before addition). This line should have a slight negative gradient (cooling to room temperature).
- Draw a line through the temperature points after the peak (when the solution is cooling steadily). This line should also have a negative gradient.
- Extrapolation: Extend both lines of best fit to the time of addition of FA 4. The difference between the extrapolated temperature on the post-reaction line and the extrapolated temperature on the pre-reaction line gives the corrected .
Key Takeaways
- The extrapolation method corrects for heat loss during the reaction.
- You must take readings before the reaction to establish the baseline temperature trend.
- The point of addition must be clearly marked on the graph.
Common Mistakes
- Saying "use a better insulated cup" or "use a lid" — the question asks to change the method and processing, not the apparatus or quantities.
- Forgetting to take temperature readings before adding FA 4. Without pre-reaction readings, you cannot extrapolate back to find the true initial temperature at the time of addition.
- Not drawing lines of best fit or not extrapolating them to the time of addition.
- Drawing a single curve through all points instead of two separate straight lines of best fit.
Things to Be Careful About
- The sketch graph must have temperature on the y-axis and time on the x-axis.
- The graph must show the initial steady temperature, the rise (or slower rise due to heat loss), the peak, and the subsequent fall.
- You must explicitly state that you extrapolate the lines to find . Merely saying "plot a graph" is not enough; you must explain how the graph is used to find the corrected value.
- The mark scheme requires you to mention measuring temperature at regular intervals before and after, plotting the graph, and extrapolating.
Qualitative analysis
For each test you should record all your observations in the spaces provided.
Examples of observations include:
- colour changes seen
- the formation of any precipitate and its solubility (where appropriate) in an excess of the reagent added
- the formation of any gas and its identification (where appropriate) by a suitable test.
You should record clearly at what stage in a test an observation is made.
Where no change is observed, you should write 'no change'.
Where reagents are selected for use in a test, the name or correct formula of the element or compound must be given.
If any solution is warmed, a boiling tube must be used.
Rinse and reuse test-tubes and boiling tubes where possible.
No additional tests should be attempted.
Each of the solutions FA 5, FA 6 and FA 7 has an anion containing sulfur. All the anions are listed in the Qualitative analysis notes. None of the anions is present in more than one compound.
None of the solutions contain a cation listed in the Qualitative analysis notes.
Use depth of each solution in a test-tube for each test. Record your observations in Table 3.1.
Table 3.1
| test | FA 5 | FA 6 | FA 7 |
|---|---|---|---|
| Test 1 Add a few drops of aqueous acidified potassium manganate(VII) then leave it to stand for 2 minutes. | |||
| Test 2 Add a piece of magnesium ribbon. | |||
| Test 3 Add aqueous barium chloride or aqueous barium nitrate. |
Answer
| Test | FA 5 | FA 6 | FA 7 |
|---|---|---|---|
| Test 1 acidified | Purple solution turns colourless / decolourised | No change; purple colour remains | Purple solution turns colourless / decolourised |
| Test 2 magnesium ribbon | No change | Effervescence / fizzing; gas pops with lighted splint | No change |
| Test 3 barium chloride / barium nitrate | White / off-white / cream / pale yellow precipitate forms | White precipitate | White precipitate |
Observations recorded: FA5 decolourises KMnO4, no Mg reaction, pale/cream ppt with Ba2+; FA6 no KMnO4 reaction, H2 with Mg, white ppt with Ba2+; FA7 decolourises KMnO4, no Mg reaction, white ppt with Ba2+.
Background Concept
This is a qualitative analysis exercise. Three solutions contain sulfur-containing anions: thiosulfate (), sulfate () and sulfite (). The tests distinguish them by redox behaviour, acidity, and precipitation with barium ions.
Acidified potassium manganate(VII), , is a strong oxidising agent. In acid, the purple ion is reduced to colourless . Anions that can be oxidised (thiosulfate and sulfite) decolourise it; sulfate cannot be oxidised, so the purple colour remains.
Magnesium ribbon reacts with aqueous acid to give hydrogen gas: . Only FA 6 is acidic (it is ), so only FA 6 gives effervescence and a positive pop test.
Barium ions precipitate sulfate and sulfite as white and . Thiosulfate also gives a barium salt precipitate, often off-white/cream/pale yellow.
Understanding the Question
You are given three solutions, each containing one sulfur-containing anion. You must carry out three tests and record all observations in Table 3.1. The instruction says to record the stage at which an observation is made, and to write 'no change' when nothing happens. The observations will later be used to identify the anions.
Approach
Run each test mentally for each possible anion. For each solution ask: (1) Does it reduce acidified ? (2) Does it produce hydrogen with magnesium? (3) Does it give a precipitate with barium ions? Then match the pattern to the three anions.
Step-by-Step Reasoning
- Test 1: Add acidified and leave for 2 minutes. Thiosulfate and sulfite are oxidised, so the purple colour disappears. Sulfate is not oxidised, so the purple colour stays. Therefore FA 5 and FA 7 decolourise; FA 6 does not.
- Test 2: Add magnesium ribbon. FA 6 is sulfuric acid, so reacts with Mg to give gas: effervescence and a pop with a lighted splint. FA 5 and FA 7 are sodium salts, not acidic, so no reaction.
- Test 3: Add barium chloride or barium nitrate. Sulfate gives white ; sulfite gives white ; thiosulfate gives a white/off-white/cream/pale yellow precipitate of barium thiosulfate. So FA 6 and FA 7 give white precipitates, while FA 5 gives a pale/cream precipitate.
The expected observations are shown in the solution table.
Key Takeaways
- Acidified is decolourised by reducing anions.
- Magnesium reacts only with acidic solutions, producing (pop test).
- Barium ions precipitate sulfate and sulfite as white solids; thiosulfate gives a paler precipitate.
- Always record 'no change' when no reaction occurs.
Common Mistakes
- Writing 'purple to colourless' for FA 6: sulfate does not reduce .
- Forgetting to record the gas test with a lighted splint for FA 6.
- Saying 'no reaction' instead of 'no change' when nothing is observed.
- Not specifying the stage (e.g. 'after standing for 2 minutes') where relevant.
Things to Be Careful About
- The mark scheme expects the exact observation, including colour terms. For FA 5 Test 3, 'white/off-white/cream/pale yellow precipitate' is accepted; 'white precipitate' alone may not distinguish it from sulfate/sulfite.
- For Test 1, mention both the initial purple colour and its disappearance (or persistence).
- State symbols are not needed in the observation table, but the ionic equation in part (c) must include them.
Use your observations from (a) to identify the formula of each of the anions present in FA 5, FA 6 and FA 7.
| FA 5 | FA 6 | FA 7 |
|---|
Answer
FA 5:
FA 6:
FA 7:
FA5: S2O3^2-, FA6: SO4^2-, FA7: SO3^2-
Background Concept
The observations from part (a) are fingerprints for the three anions. Thiosulfate and sulfite are reducing agents; sulfate is not. Sulfate and sulfite give white barium precipitates; thiosulfate gives a paler precipitate. Only the acidic solution (sulfuric acid) reacts with magnesium.
Understanding the Question
You must convert the recorded observations into the formula of the anion in each solution. This is a deduction task: each observation eliminates or confirms possibilities.
Approach
Use the three tests as a decision tree:
- Does it decolourise acidified ? If yes, anion is thiosulfate or sulfite; if no, sulfate.
- Does it give with Mg? If yes, solution is acidic, so anion is sulfate (as ).
- What colour is the barium precipitate? White suggests sulfate/sulfite; cream/pale yellow suggests thiosulfate.
Step-by-Step Reasoning
- FA 5: decolourises (reducing), does not react with Mg (not acidic), and gives a cream/pale yellow barium precipitate. This matches thiosulfate, .
- FA 6: does not decolourise (not reducing), reacts with Mg to give (acidic), and gives a white barium precipitate. This is sulfate, present as , so anion .
- FA 7: decolourises (reducing), does not react with Mg (not acidic), and gives a white barium precipitate. This matches sulfite, .
Key Takeaways
- Reducing anions decolourise acidified ; non-reducing sulfate does not.
- The barium precipitate colour helps distinguish thiosulfate from sulfate/sulfite.
- An acidic solution is revealed by the magnesium test.
Common Mistakes
- Confusing sulfite and thiosulfate because both reduce . Use the barium precipitate colour: sulfite gives white, thiosulfate gives pale/cream.
- Forgetting the charge on the ion: write , not .
- Thinking sulfate is a reducing agent because it contains sulfur; it is already in its highest common oxidation state (+6) and is not oxidised further.
Things to Be Careful About
- The mark scheme awards 1 mark for two correct and 2 marks for three correct; write all three.
- Use correct formula with charge.
Use your observations from (a), to suggest the identity of the cation present in FA 6.
The cation in FA 6 is ............
Carry out a further test to check whether your suggestion is correct.
Record your test and observations.
State the identity of the cation in FA 6.
The cation in FA 6 is ............
Answer
Suggested cation:
Test: add aqueous sodium carbonate (or use blue litmus paper).
Observation: effervescence / fizzing; the gas produced turns limewater milky (or blue litmus turns red).
Cation in FA 6:
H+ (confirmed by carbonate test: effervescence, CO2 turns limewater milky)
Background Concept
An acidic solution contains ions. A simple test for is to add a carbonate: carbonate reacts with acid to produce carbon dioxide gas, seen as effervescence, and turns limewater milky. Alternatively, an indicator such as blue litmus turns red in acid.
Understanding the Question
Part (a) showed FA 6 reacts with magnesium to give hydrogen, which strongly suggests an acidic solution. You must suggest the cation, then confirm it with a further test and record the observation.
Approach
Identify as the likely cation from the magnesium test. Choose a test that gives a clear positive result for : carbonate (effervescence, ) or a named indicator (colour change).
Step-by-Step Reasoning
- FA 6 is , so the cation is .
- Add a few drops of aqueous sodium carbonate to a fresh sample. Bubbles of are produced: .
- Confirm the gas is by bubbling it through limewater: a white precipitate/milky appearance forms.
- If using litmus: blue litmus paper turns red in acid.
Key Takeaways
- is confirmed by carbonate (effervescence, ) or an indicator colour change.
- Always state both the test and the observation.
Common Mistakes
- Suggesting a metal cation such as : but FA 6 reacts with Mg to give , which requires .
- Performing a test that does not distinguish (e.g. adding NaOH gives no visible change).
- Forgetting to identify the gas as with limewater.
Things to Be Careful About
- The mark scheme requires the cation suggestion AND the chosen reagent for the first mark, and the observation plus gas identification for the second.
- Use 'effervescence' or 'fizzing' for the carbonate test.
Write an ionic equation for one of the reactions in either Test 2 or Test 3 in (a). Include state symbols.
Answer
Choose one ionic equation, e.g.
(Alternative: or .)
Mg(s) + 2H+(aq) -> Mg2+(aq) + H2(g)
Background Concept
An ionic equation shows only the species that actually change. Spectator ions are omitted. For the magnesium test, the active species is ; sulfate is a spectator. For the barium tests, and the anion combine to form an insoluble precipitate.
Understanding the Question
You may choose any one of the reactions from Test 2 or Test 3. You must write a balanced ionic equation with state symbols.
Approach
Pick the simplest reaction. The magnesium–acid reaction is straightforward: Mg metal is oxidised to , and is reduced to . Balance atoms and charges.
Step-by-Step Reasoning
- Magnesium test (FA 6): . Each Mg loses 2 electrons; each gains 1 electron, so two are needed.
- Barium sulfate: . Charges balance: +2 + -2 = 0.
- Barium sulfite: .
Key Takeaways
- Omit spectator ions.
- Balance both atoms and charge.
- Include state symbols: (s), (aq), (g).
Common Mistakes
- Writing the full equation instead of the ionic equation.
- Forgetting state symbols.
- Unbalanced charges, e.g. .
Things to Be Careful About
- The mark scheme accepts any one of the three equations; choose one and write it correctly.
- For the Mg equation, the coefficient of must be 2.
FA 8 is a solid compound.
Gently warm (do not boil) a depth of FA 6 in a boiling tube. Stop warming the FA 6, add all the FA 8 and shake the boiling tube.
Filter the mixture into a second boiling tube. The filtrate will be used in (d)(ii).
Describe the appearance of the residue and the filtrate.
Answer
Residue: red-brown / brown / pink-brown solid.
Filtrate: pale blue solution.
Residue: red-brown solid; filtrate: pale blue solution.
Background Concept
Copper(I) oxide, , is a red-brown solid. With warm dilute acid, copper(I) disproportionates: one copper(I) is oxidised to copper(II) and the other is reduced to copper(0). The copper(II) ion in aqueous solution is blue; the copper metal is red-brown.
Understanding the Question
FA 8 is added to warm FA 6 (dilute sulfuric acid). After shaking and filtering, you must describe the residue (solid left on the filter paper) and the filtrate (solution that passes through).
Approach
Recognise that Cu2O reacts with acid to give Cu2+ (blue solution) and Cu (red-brown solid). The insoluble copper metal is the residue; the blue copper(II) sulfate solution is the filtrate.
Step-by-Step Reasoning
- Warm dilute provides .
- .
- forms blue in solution; copper metal is a red-brown solid.
- Filtration separates the insoluble copper (residue) from the blue solution (filtrate).
Key Takeaways
- Copper(I) disproportionates in acid to copper(II) and copper metal.
- Copper(II) solutions are blue; copper metal is red-brown.
Common Mistakes
- Saying the residue is blue (that is the solution).
- Saying the filtrate is colourless.
- Forgetting that the acid must be warm for the reaction to proceed.
Things to Be Careful About
- The mark scheme accepts red-brown/brown/pink/pink-brown for the residue and pale blue for the filtrate.
- Use 'solid' for residue and 'solution' for filtrate.
To a depth of the filtrate from (d)(i) in a test-tube, add an equal volume of aqueous potassium iodide.
Record your observations. Filter the mixture into a test-tube for use in (d)(iii).
Answer
Brown / yellow-brown / orange-brown mixture (iodine formed).
Brown/yellow-brown mixture.
Background Concept
Copper(II) ions oxidise iodide ions to iodine. The reaction is . Iodine in aqueous solution is brown/yellow-brown, so the mixture appears brown. Copper(I) iodide is a white/cream solid, but the iodine colour dominates.
Understanding the Question
You add aqueous potassium iodide to the blue filtrate from (d)(i), which contains . Record the observation.
Approach
Recognise that is an oxidising agent towards iodide. The brown colour signals iodine formation.
Step-by-Step Reasoning
- The filtrate is blue because of .
- Adding causes redox: is reduced to (which precipitates as CuI), and is oxidised to .
- Aqueous iodine is brown/yellow-brown, so the mixture turns brown.
Key Takeaways
- oxidises iodide to iodine.
- Iodine in solution is brown; this is a qualitative test for oxidising agents.
Common Mistakes
- Writing 'blue precipitate' (the blue colour is from Cu2+ before reaction; after adding KI the mixture is brown).
- Saying 'no change'.
- Confusing the brown colour with a precipitate; the mark scheme accepts a brown mixture.
Things to Be Careful About
- The observation is the colour of the mixture, not a specific precipitate.
- Do not need to identify iodine in the observation, but it helps in explanation.
To a depth of the filtrate from (d)(ii), add aqueous sodium hydroxide.
Record your observations.
Answer
Blue precipitate, insoluble in excess sodium hydroxide.
Blue precipitate, insoluble in excess NaOH.
Background Concept
Adding aqueous sodium hydroxide to a solution containing gives a blue precipitate of copper(II) hydroxide, . Unlike amphoteric hydroxides such as and , copper(II) hydroxide does not dissolve in excess NaOH.
Understanding the Question
The filtrate from (d)(ii) still contains (or at least enough to give the hydroxide test). You add NaOH and record the observation.
Approach
Use the standard cation test: NaOH gives a precipitate with . Test solubility in excess to confirm it is not an amphoteric hydroxide.
Step-by-Step Reasoning
- .
- is blue and insoluble in excess NaOH, so the precipitate remains.
Key Takeaways
- Blue precipitate with NaOH indicates .
- Insolubility in excess NaOH distinguishes copper(II) from amphoteric cations.
Common Mistakes
- Saying the precipitate dissolves in excess (that would be aluminium or zinc).
- Writing 'white precipitate' (copper hydroxide is blue).
- Forgetting to mention 'insoluble in excess'.
Things to Be Careful About
- The mark scheme specifically requires 'blue ppt insoluble in excess'.
- Use 'precipitate' not 'solution'.