Chemistry 9701/34 — October/November 2017
Cambridge AS Level · Advanced Practical Skills · worked solutions for every part, with the mark scheme
Topics Manipulation, Measurement and Observation · Analysis, Conclusions and Evaluation · Presentation of Data and Observations · Qualitative Analysis
Sodium thiosulfate reacts with acid to produce a pale yellow precipitate of sulfur.
You will investigate how the rate of this reaction varies with the concentration of thiosulfate ions.
To do this you will measure the time taken for a fixed amount of sulfur to be formed.
FB 1 is sodium thiosulfate, .
FB 2 is hydrochloric acid, .
Method
Read through the instructions and prepare a table on page 3 for your results before starting any practical work. You will need to include volume of FB 1, volume of water, reaction time and rate of reaction for each of the five experiments.
Experiment 1
- Use the larger measuring cylinder to transfer of FB 1 into the beaker.
- Use the smaller measuring cylinder to measure of FB 2.
- Pour the FB 2 into the FB 1 in the beaker and start timing immediately.
- Stir the mixture in the beaker once and place the beaker on top of the printed insert provided.
- Look down through the solution in the beaker at the print on the insert.
- Stop timing as soon as the precipitate of sulfur makes the print on the insert just invisible.
- Record the reaction time to the nearest second.
- Empty, rinse and dry the beaker so it is ready for use in Experiment 2.
- Rinse the sink with tap water to wash away the products of the reaction.
Experiment 2
- Use the larger measuring cylinder to transfer of FB 1 into the beaker.
- Use the same measuring cylinder to add of distilled water to the beaker.
- Use the smaller measuring cylinder to add of FB 2 to the mixture in the beaker and start timing immediately.
- Stir the mixture in the beaker once and place the beaker on top of the printed insert provided.
- Look down through the solution in the beaker at the print on the insert.
- Stop timing as soon as the precipitate of sulfur makes the print on the insert just invisible.
- Record the reaction time to the nearest second.
- Empty, rinse and dry the beaker so it is ready for use in Experiment 3.
- Rinse the sink with tap water to wash away the products of the reaction.
Experiment 3
Repeat Experiment 2 using of FB 1, of distilled water and of FB 2.
Experiments 4 and 5
Choose suitable volumes that will enable you to investigate further the effect of changing the concentration of thiosulfate ions on the rate of the reaction. You should not use a volume of less than of FB 1.
Results
The rate of the reaction can be calculated as shown.
Calculate the rate of reaction for each experiment and complete the table.
On the grid plot a graph of rate of reaction (-axis) against volume of FB 1 (-axis).
Circle any points that you consider anomalous and draw a line of best fit to show how the rate of the reaction depends on the volume of FB 1.

Use your graph to calculate the time that the reaction would have taken if of FB 1 had been used. Show on the grid how you obtained your answer.
A student broke the beaker when carrying out the experiment and decided to use a petri dish instead. This has a different shape.
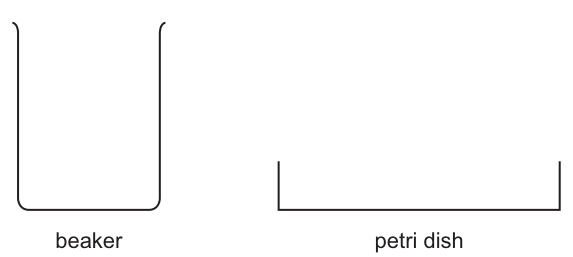
State and explain what effect this would have on the student's results.
Another student suggested that the experiment could be improved by using a less concentrated solution of sodium thiosulfate.
Explain whether this suggestion would improve the accuracy of the results.
Calculate the maximum percentage error in the reaction time for Experiment 1. Show how you obtained your answer.
Using a similar method to (a), explain how you would investigate how the rate of the reaction varies with changes in the concentration of hydrochloric acid.
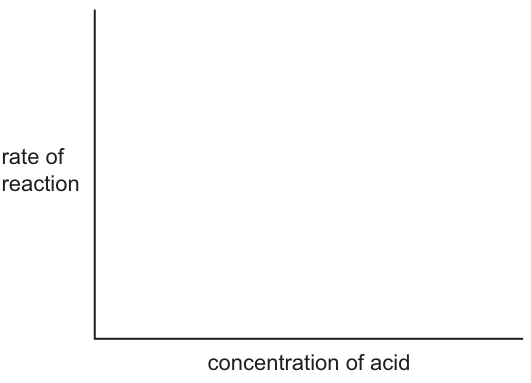
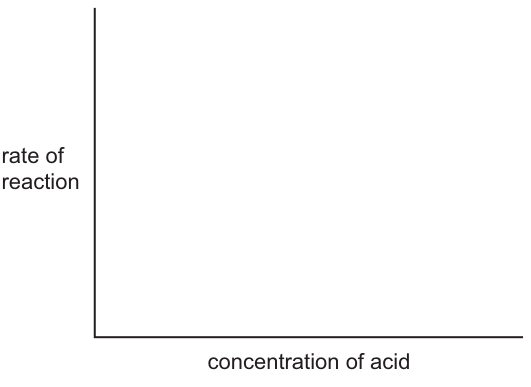
An experiment to investigate the effect of changing the concentration of hydrochloric acid gave results that could be plotted to produce a graph.
On the axes, sketch the graph that would show that:
the rate of reaction was directly proportional to the concentration of acid,
the rate of reaction did not depend on the concentration of acid.
The rest of this paper
1 more questions- Q2Qualitative Analysis · Manipulation, Measurement and Observation · Analysis, Conclusions and Evaluation15M