Chemistry 9701/12 — May/June 2016
Cambridge AS Level · answer key with instant marking and worked solutions
Topics Introduction to Organic Chemistry · Chemical Bonding · Carbonyl Compounds · Atoms, Molecules and Stoichiometry · Atomic Structure · States of Matter · +13 more
Tap an option under each question to check it — your score builds as you go.
The diagram shows the Boltzmann distribution of energies in 1 mole of a gas. The gas can take part in a reaction with an activation energy, .
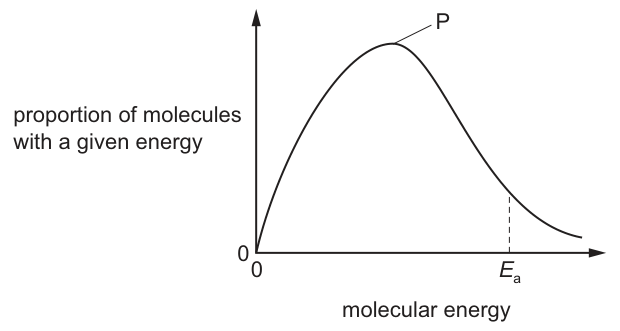
Which statement correctly describes the effect of an increase in temperature?
Options
A Peak P will be higher and fewer molecules will have energy > .
B Peak P will be higher and more molecules will have energy > .
C Peak P will be lower and fewer molecules will have energy > .
D Peak P will be lower and more molecules will have energy > .
Working
An increase in temperature increases the average kinetic energy of the gas molecules. The Boltzmann distribution curve shifts to the right (towards higher energies) and flattens out.
- Since the total number of molecules (area under the curve) is constant, the peak P must become lower.
- The curve extends further to the right, increasing the area under the tail beyond the activation energy . This means more molecules now possess energy greater than .
Answer
D
D
Background Concept
The Boltzmann distribution curve shows the distribution of molecular energies in a gas at a given temperature. The y-axis represents the proportion (or number) of molecules with a given energy, and the x-axis represents the molecular energy. The area under the curve represents the total number of molecules in the sample, which is constant regardless of temperature. The peak of the curve (P) corresponds to the most probable energy (the energy possessed by the largest fraction of molecules). The activation energy () is the minimum energy required for a successful collision. The area under the curve to the right of represents the fraction of molecules with energy , which determines the reaction rate.
Understanding the Question
The question provides a Boltzmann distribution curve at an initial temperature and asks for the effect of increasing the temperature. We need to determine how the peak P changes and how the number of molecules with energy changes.
Approach
We must consider two constraints: (1) the total number of molecules is constant (area under curve is constant), and (2) increasing temperature increases the average kinetic energy of the molecules (curve shifts right). By combining these, we can deduce the new shape of the curve.
Step-by-Step Reasoning
- Average energy increases: When temperature increases, the molecules gain kinetic energy. The average energy increases, so the entire distribution shifts to the right along the x-axis.
- Peak P lowers: The total area under the curve represents the total number of molecules (1 mole in this case), which does not change. As the curve shifts to the right and becomes broader (flatter) to accommodate the higher energies, the peak must decrease in height to keep the total area constant. Therefore, peak P will be lower.
- More molecules have energy : The activation energy is a fixed value for the reaction (temperature does not change , only a catalyst does). Because the curve has shifted to the right and flattened, the area under the curve to the right of the vertical line at has increased. This area represents the proportion of molecules with energy greater than the activation energy. Therefore, more molecules now have energy , which explains why the reaction rate increases with temperature.
Key Takeaways
- Increasing temperature shifts the Boltzmann curve to the right and lowers the peak.
- The area under the curve remains constant (total number of molecules is unchanged).
- The area to the right of increases, meaning a greater proportion of molecules have sufficient energy to react.
Common Mistakes
- Thinking the peak gets higher: This is incorrect because the total area must remain constant. If the curve shifts right and flattens, the peak must lower.
- Thinking fewer molecules have energy : This contradicts the observation that reaction rates increase with temperature. The shift to the right increases the tail area beyond .
- Confusing the effect of temperature with a catalyst: A catalyst lowers (shifting the vertical line left), which also increases the area to the right, but does not change the shape of the Boltzmann curve itself.
Things to Be Careful About
- The y-axis is 'proportion of molecules' or 'number of molecules', not 'rate of reaction'.
- The area under the curve is constant; this is the key to understanding why the peak lowers.
- is fixed unless a catalyst is added; temperature only changes the distribution of energies, not the activation energy threshold itself.
The rest of this paper
39 more questions- Q2Atomic Structure1M
- Q3Atomic Structure1M
- Q4Atoms, Molecules and Stoichiometry1M
- Q5Chemical Bonding1M
- Q6States of Matter1M
- Q7Atoms, Molecules and Stoichiometry1M
- Q8Chemical Energetics1M
- Q9Electrochemistry · Group 171M
- Q10Equilibria1M
- Q11Introduction to Organic Chemistry1M
- Q12Chemical Periodicity1M
- Q13Chemical Bonding · States of Matter1M
- Q14Group 2 · Atoms, Molecules and Stoichiometry1M
- Q15Nitrogen and Sulfur · Equilibria1M
- Q16Group 21M
- Q17Electrochemistry · Nitrogen and Sulfur1M
- Q18Group 171M
- Q19Chemical Bonding1M
- Q20Halogen Compounds · Introduction to Organic Chemistry1M
- Q21Polymerisation1M
- Q22Hydrocarbons1M
- Q23Hydrocarbons1M
- Q24Halogen Compounds1M
- Q25Introduction to Organic Chemistry · Carboxylic Acids and Derivatives1M
- Q26Carbonyl Compounds · Hydroxy Compounds1M
- Q27Carbonyl Compounds1M
- Q28Hydroxy Compounds · Carbonyl Compounds1M
- Q29Introduction to Organic Chemistry1M
- Q30Carboxylic Acids and Derivatives · Hydroxy Compounds1M
- Q31Atoms, Molecules and Stoichiometry1M
- Q32Chemical Bonding · States of Matter1M
- Q33Equilibria · Reaction Kinetics1M
- Q34Chemical Energetics1M
- Q35Atomic Structure1M
- Q36Group 171M
- Q37Introduction to Organic Chemistry · Chemical Bonding1M
- Q38Introduction to Organic Chemistry1M
- Q39Carbonyl Compounds1M
- Q40Carbonyl Compounds1M