Chemistry 9701/13 — October/November 2014
Cambridge AS Level · Multiple Choice (AS Level) · answer key with instant marking and worked solutions
Topics Introduction to Organic Chemistry · Chemical Energetics · Chemical Bonding · States of Matter · Atoms, Molecules and Stoichiometry · Group 2 · +12 more
Tap an option under each question to check it — your score builds as you go.
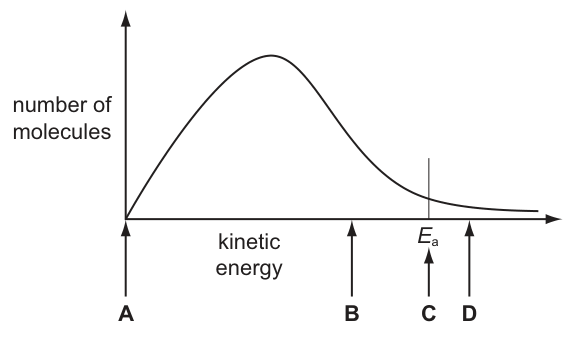
The diagram below represents, for a given temperature, the Boltzmann distribution of the kinetic energy of the molecules in a mixture of two gases that react slowly together.
The activation energy for the reaction, , is marked.
When the reaction is catalysed, the rate of reaction increases a little.
What will be the position of for the catalysed reaction?
Options
A A
B B
C C
D D
Working
A catalyst provides an alternative reaction pathway with a lower activation energy (). On a Boltzmann distribution graph where the x-axis represents kinetic energy, a lower activation energy corresponds to a position to the left of the original value.
In the diagram:
- Position C represents the original .
- Position D is to the right (higher energy), which would imply a higher activation energy.
- Position A is at zero kinetic energy, which is unrealistic for a reaction with an activation energy.
- Position B is to the left of the original (position C), representing a lower activation energy. Since the rate increases only "a little", the decrease in is relatively small, fitting position B.
Answer
B
B
Background Concept
The Boltzmann distribution curve shows the distribution of kinetic energies among molecules in a gas at a constant temperature. The y-axis represents the number of molecules (or fraction of molecules) and the x-axis represents kinetic energy. The curve starts at the origin (zero molecules have zero kinetic energy), rises to a peak (the most probable energy), and then tails off towards the right, showing that a small number of molecules have very high energies.
For a reaction to occur, colliding molecules must possess a minimum amount of energy called the activation energy (). On the graph, is marked as a vertical line. The area under the curve to the right of this line represents the number of molecules with energy greater than or equal to ; these are the molecules capable of reacting upon collision.
A catalyst increases the rate of reaction by providing an alternative reaction pathway with a lower activation energy. It does not change the temperature of the system, so the overall shape of the Boltzmann distribution curve remains the same (the peak and the total area under the curve, representing the total number of molecules, do not move). However, because is lower, the vertical line marking moves to the left. This increases the area under the curve to the right of the new , meaning a larger proportion of molecules now have sufficient energy to react, thus increasing the rate.
Understanding the Question
The question presents a Boltzmann distribution curve with the original activation energy marked. Four positions (A, B, C, D) are indicated on the kinetic energy axis. We are told that a catalyst is added and the rate increases a little. We need to identify the new position of .
- Position A: At the origin (kinetic energy = 0).
- Position B: To the left of the original (lower kinetic energy).
- Position C: At the original line.
- Position D: To the right of the original (higher kinetic energy).
Approach
- Recall the effect of a catalyst: it lowers the activation energy ( decreases).
- Relate this to the graph: a lower means a smaller value on the kinetic energy x-axis, which is to the left of the original position.
- Evaluate the options: Look for a position to the left of the original (position C). Exclude positions that represent zero energy or higher energy.
Step-by-Step Reasoning
- Effect of catalyst: A catalyst lowers the activation energy. Therefore, the new must be less than the original . On the x-axis (kinetic energy), lower values are to the left. So, the new must be to the left of the vertical line currently labeled (which is at position C).
- Evaluating positions:
- Position D is to the right of . This represents a higher activation energy, which would decrease the rate. This is incorrect.
- Position C is the original activation energy. Since the reaction is catalysed, changes. This is incorrect.
- Position A is at the origin (0 kinetic energy). While this is to the left, an activation energy of zero is chemically unrealistic for most reactions. Furthermore, dropping all the way to zero would cause a massive increase in rate, not just "a little".
- Position B is to the left of the original (position C). This represents a lower activation energy. The position is relatively close to the original , consistent with the statement that the rate increases "a little" (a small decrease in leads to a small increase in the fraction of successful collisions).
- Conclusion: Position B represents the new, lower activation energy.
Key Takeaways
- A catalyst lowers the activation energy ().
- On a Boltzmann distribution graph (kinetic energy vs. number of molecules), a lower is represented by a shift of the line to the left.
- The curve itself does not shift; only the vertical line marking moves.
- Lowering increases the area under the curve to the right of , meaning more molecules have sufficient energy to react.
Common Mistakes
- Thinking the curve shifts: Students often think the whole curve moves to the right or left. Remember, the curve represents the energy distribution at a constant temperature. Only the line moves when a catalyst is added. (The curve would shift if temperature changed, but even then, the shape changes, it doesn't just translate).
- Confusing the direction: Thinking that "lower energy" is to the right. On a standard axis, values increase to the right, so lower energy is to the left.
- Choosing A: Assuming the catalyst makes zero. While decreases, it rarely becomes zero. The phrase "increases a little" is a clue that the change is small.
Things to Be Careful About
- Axis labels: Ensure you are reading the x-axis correctly. Here it is "kinetic energy". Lower = lower x-value = left.
- Wording: "Rate increases a little" implies a small change in . If the rate increased massively, might drop significantly (closer to A, though still unlikely to be 0). B is the most reasonable position for a small decrease.
- Position C: Note that in the diagram, C is pointing to the x-axis directly below the line. So C represents the value of the original .
The rest of this paper
39 more questions- Q2Atomic Structure1M
- Q3States of Matter1M
- Q4Electrochemistry1M
- Q5Chemical Energetics1M
- Q6Atoms, Molecules and Stoichiometry1M
- Q7Chemical Bonding1M
- Q8Atoms, Molecules and Stoichiometry1M
- Q9States of Matter1M
- Q10Chemical Energetics1M
- Q11Chemical Energetics1M
- Q12Atoms, Molecules and Stoichiometry1M
- Q13Group 21M
- Q14States of Matter1M
- Q15Group 171M
- Q16Group 21M
- Q17Chemical Periodicity1M
- Q18Chemical Periodicity1M
- Q19Group 21M
- Q20Introduction to Organic Chemistry1M
- Q21Carbonyl Compounds1M
- Q22Hydroxy Compounds1M
- Q23Halogen Compounds1M
- Q24Carboxylic Acids and Derivatives · Hydroxy Compounds1M
- Q25Introduction to Organic Chemistry1M
- Q26Carboxylic Acids and Derivatives1M
- Q27Halogen Compounds · Carboxylic Acids and Derivatives1M
- Q28Polymerisation1M
- Q29Chemical Bonding · Introduction to Organic Chemistry1M
- Q30Introduction to Organic Chemistry1M
- Q31Electrochemistry · Group 171M
- Q32Atomic Structure1M
- Q33Chemical Bonding1M
- Q34Chemical Energetics1M
- Q35Group 17 · Chemical Bonding1M
- Q36Nitrogen and Sulfur1M
- Q37Hydrocarbons · Introduction to Organic Chemistry1M
- Q38Halogen Compounds1M
- Q39Carbonyl Compounds · Hydroxy Compounds · Hydrocarbons1M
- Q40Carbonyl Compounds · Introduction to Organic Chemistry1M