Chemistry 9701/34 — October/November 2012
Cambridge AS Level · Advanced Practical Skills · worked solutions for every part, with the mark scheme
Topics Manipulation, Measurement and Observation · Analysis, Conclusions and Evaluation · Presentation of Data and Observations · Qualitative Analysis
You are to investigate how the rate of reaction between acidified hydrogen peroxide and aqueous iodide ions depends on the concentration of the hydrogen peroxide.
When hydrogen peroxide and potassium iodide are mixed in the presence of an acid, iodine, , is produced and the colour of the solution changes from colourless to a blue-black colour if starch indicator is present.
If the reaction mixture contains sodium thiosulfate, the iodine produced in the reaction above is immediately reduced back to iodide ions. The solution only turns blue-black when all of the sodium thiosulfate has been used up.
FB 1 is hydrogen peroxide, .
FB 2 is potassium iodide, .
FB 3 is sodium thiosulfate, .
FB 4 is sulfuric acid, .
starch indicator
distilled water
Read through the instructions carefully before starting any practical work.
Experiment 1
- Fill a burette with FB 3.
- Use the measuring cylinder labelled A to place of FB 2 and of distilled water into a conical flask.
- Add to the conical flask of FB 3 from the burette and 6 drops of starch indicator.
- Use the measuring cylinder labelled B to place of FB 1 and of FB 4 into a beaker.
- Pour the mixture from the beaker into the conical flask and immediately start timing.
- Swirl the flask to ensure good mixing and place the flask on a white tile.
- Stop timing when a blue-black colour suddenly appears in the solution.
- Record, in the table on page 4, the reaction time, in seconds, to the nearest second.
- Empty, rinse and drain the conical flask.
Experiment 2
- Use the measuring cylinder labelled A to place of FB 2 and of distilled water into a conical flask.
- Add to the conical flask of FB 3 from the burette and 6 drops of starch indicator.
- Use the measuring cylinder labelled B to place of FB 1 and of FB 4 into a beaker.
- Pour the mixture from the beaker into the conical flask and immediately start timing.
- Swirl the flask to ensure good mixing and place the flask on a white tile.
- Stop timing when a blue-black colour suddenly appears in the solution.
- Record, in the table on page 4, the reaction time, in seconds, to the nearest second.
- Empty, rinse and drain the conical flask.
Experiments 3 – 5
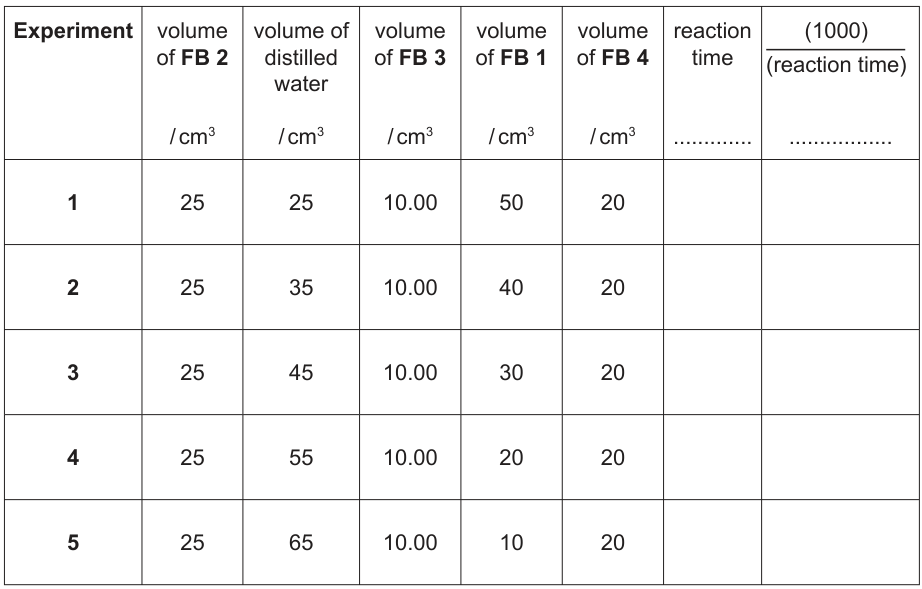
Carry out experiments 3 – 5 in the same way but using the volumes of solutions shown in the table.
Complete the units in the table.
Calculate all values of to three significant figures.
The rate of reaction can be represented by the following formula.
On the next page plot a graph of 'rate' against the volume of FB 1.
Start each of the axes at zero.
Draw the line of best fit.

The concentration of hydrogen peroxide in FB 1 is .
The total volume of each reaction mixture is .
Calculate the initial concentration of hydrogen peroxide for each of the following experiments. Show your working.
| Experiment | volume of FB 1 / | concentration of hydrogen peroxide / |
|---|---|---|
| 1 | 50 | |
| 5 | 10 |
Use your results in (i) to show that the initial concentration of hydrogen peroxide is directly proportional to the volume of FB 1 used in the experiment.
A website states that the rate of reaction between acidified hydrogen peroxide and potassium iodide is directly proportional to the concentration of hydrogen peroxide.
Use your graph to decide whether the statement on the website is correct or not.
Explain your answer.
Experiment 1 was repeated using sodium thiosulfate instead of FB 3.
Suggest how this would affect the reaction time.
Explain your answer using the chemical equations on page 3.
Suggest a factor, other than volumes of solutions used, that could have significantly affected the rate of reaction in each of the experiments.
A student carrying out a similar investigation decides to repeat one of the experiments a number of times. The reaction times for these repeated experiments are listed below.
| run | time / s |
|---|---|
| 1 | 56 |
| 2 | 54 |
| 3 | 62 |
| 4 | 56 |
| 5 | 53 |
From these experimental results calculate an appropriate mean reaction time, correct to 1 decimal place.
Assume that the uncertainty in the mean reaction time is seconds.
Calculate this uncertainty as a percentage of the mean reaction time.
The experimental method you have used can be adapted to investigate how the rate of reaction would vary if the concentration of potassium iodide or the concentration of sulfuric acid were changed.
In the first line of the tables below, the volumes of FB 2, distilled water, FB 3, FB 1 and FB 4 used in Experiment 2 are recorded.
Complete the following table, suggesting volumes for each of the reagents that could be used in a further experiment to investigate how the rate of reaction varies with a change in the volume of potassium iodide, FB 2.
Do not carry out this experiment.
| Experiment | volume of FB 2 / | volume of distilled water / | volume of FB 3 / | volume of FB 1 / | volume of FB 4 / |
|---|---|---|---|---|---|
| 2 | 25 | 35 | 10.00 | 40 | 20 |
Complete the following table, suggesting volumes for each of the reagents that could be used in a further experiment to investigate how the rate of reaction varies with a change in the volume of sulfuric acid, FB 4.
Do not carry out this experiment.
| Experiment | volume of FB 2 / | volume of distilled water / | volume of FB 3 / | volume of FB 1 / | volume of FB 4 / |
|---|---|---|---|---|---|
| 2 | 25 | 35 | 10.00 | 40 | 20 |
The rest of this paper
1 more questions- Q2Qualitative Analysis · Manipulation, Measurement and Observation · Analysis, Conclusions and Evaluation15M