Chemistry 9701/33 — October/November 2011
Cambridge AS Level · Advanced Practical Skills · worked solutions for every part, with the mark scheme
Topics Presentation of Data and Observations · Analysis, Conclusions and Evaluation · Manipulation, Measurement and Observation · Qualitative Analysis
You are to determine the enthalpy change of neutralisation of hydrochloric acid by aqueous sodium hydroxide and also the concentration of the aqueous sodium hydroxide. These can be found by measuring the temperature change when solutions of the acid and alkali are mixed.
FA 1 is aqueous sodium hydroxide, NaOH.
FA 2 is hydrochloric acid, HCl.
Method
- Fill a burette with FA 1. [Care: FA 1 is corrosive]
- Support the plastic cup in a beaker.
- Use a measuring cylinder to transfer of FA 2 into a beaker.
- Use a measuring cylinder to add of distilled water to the acid in the beaker.
- Measure and record, in the table below, the initial temperature of the mixture in the beaker.
- Run of FA 1 from the burette into the plastic cup.
- Add the mixture of acid and water from the beaker to the FA 1 in the plastic cup.
- Stir carefully and measure the highest temperature obtained.
- Record this temperature in the table.
- Rinse the plastic cup with water.
- Repeat the experiment using of FA 2, of distilled water and of FA 1 as shown for experiment 2 in the table.
- Carry out experiments 3 to 7 in the same way.
- Complete the table for each experiment.
Results
| experiment number | 1 | 2 | 3 | 4 | 5 | 6 | 7 |
|---|---|---|---|---|---|---|---|
| volume of FA 2 / | 25 | 25 | 25 | 25 | 25 | 25 | 25 |
| volume of water / | 35 | 30 | 25 | 20 | 15 | 10 | 5 |
| volume of FA 1 / | 5.0 | 10.0 | 15.0 | 20.0 | 25.0 | 30.0 | 35.0 |
| initial temperature of acid mixture / | |||||||
| highest temperature / | |||||||
| temperature change / |
On the grid below plot the temperature change (-axis) against the volume of FA 1 (-axis). Using these points, draw two straight lines that intersect.

Reading from the intersection of the two lines on your graph,
the volume of FA 1 is ............. ,
the temperature change is ............ .
The volume of FA 1 at the intersection represents the volume of FA 1 which neutralised of FA 2.
The reaction between FA 1 and FA 2 is shown in the equation below.
This reaction is exothermic.
Use this information to explain the shape of the graph.
Calculate the amount of heat energy produced in the reaction. Use the temperature change from (c) in calculating your answer.
[Assume that are required to raise the temperature of of any solution by ]
heat energy produced = .................... J
Calculate how many moles of hydrochloric acid are present in of FA 2.
mol of hydrochloric acid = ....................
Use your answers to (e) and (f) to calculate the enthalpy change of neutralisation of hydrochloric acid by aqueous sodium hydroxide.
Give your answer in and include the relevant sign.
enthalpy change of neutralisation = .......... ....................
(sign) (value)
Explain why the total volume of solution used was kept constant in each of the experiments.
Calculate the concentration, in , of the aqueous sodium hydroxide, FA 1.
concentration of FA 1 = ....................
A student thought that the experiment was not accurate because the temperature changes measured were small.
Suggest a modification to the experimental method used in order to give larger changes in temperature.
Experiments 1 to 7 were repeated using sulfuric acid, , instead of the hydrochloric acid, HCl.
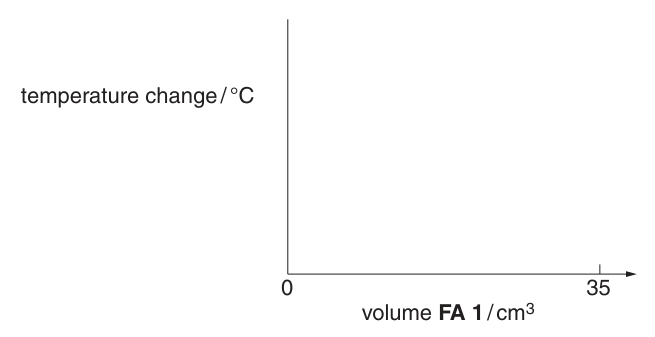
On the axes below indicate an appropriate temperature scale and sketch the graph for the temperature changes you would expect.
The rest of this paper
1 more questions- Q2Qualitative Analysis · Presentation of Data and Observations · Analysis, Conclusions and Evaluation15M