Chemistry 9701/53 — October/November 2025
Cambridge A-Level · Planning, Analysis and Evaluation · worked solutions for every part, with the mark scheme
Topics Analysis, Conclusions and Evaluation · Planning
The concentration of aqueous chloride ions can be found by titration with aqueous silver nitrate, .
The indicator used is aqueous potassium chromate(VI), .
As is added to aqueous chloride ions, a white precipitate of is formed.
When all the chloride ions have reacted, further addition of leads to the formation of a red precipitate of silver chromate(VI), . The first appearance of the red precipitate shows the end-point of the titration.
A student carries out an experiment to determine the number of molecules of water of crystallisation, , in hydrated barium chloride, .
The student makes of to use for the titration.
Calculate the mass of solid silver nitrate, , needed to make of .
Give your answer to two decimal places.
Working
Amount of :
Mass of :
Answer
2.12 g
2.12 g
Background Concept
Concentration is amount of solute per unit volume: , so . The mass of a solid is related to its amount by . Volumes in cm must be converted to dm by dividing by 1000.
Understanding the Question
We need the mass of solid silver nitrate required to prepare 250.0 cm of 0.0500 mol dm AgNO(aq). This is a standard solution-preparation calculation.
Approach
First find the amount of AgNO needed using . Then convert this amount to a mass using the molar mass of AgNO.
Step-by-Step Reasoning
- Volume = 250.0 cm = 0.2500 dm.
- mol.
- g mol.
- g, which is 2.12 g to two decimal places.
Key Takeaways
Use and . Always convert cm to dm before using concentration in mol dm.
Common Mistakes
- Forgetting to divide the volume by 1000, giving 12.5 mol.
- Using an incorrect molar mass for AgNO.
- Rounding to 2.1 g instead of 2.12 g.
Things to Be Careful About
- Use the periodic-table values for atomic masses.
- Give the final answer to two decimal places as requested.
- Include the unit g.
Describe how the student should make of starting from the mass of calculated in (a)(i) in a beaker.
Give the name and size of any key apparatus used.
Write your answer using a series of numbered steps.
Answer
- Add a small volume of distilled water to the 50 cm beaker containing the 2.12 g of AgNO and dissolve the solid.
- Transfer the solution and washings through a funnel into a 250 cm volumetric flask.
- Make up to the calibration mark with distilled water.
- Stopper the flask and invert it several times to mix thoroughly.
Dissolve in water, transfer quantitatively to a 250 cm3 volumetric flask, make up to the mark, and mix.
Background Concept
Preparing a standard solution of exact concentration requires quantitative transfer: every particle of solute must end up in the volumetric flask, and the final volume must be made up exactly to the calibration mark. A 50 cm beaker is too small to hold 250 cm, so the solution must be transferred to a larger vessel.
Understanding the Question
Describe, in numbered steps, how to make 250 cm of 0.0500 mol dm AgNO starting from the solid in a 50 cm beaker. Name and give the size of key apparatus.
Approach
Dissolve the solid, transfer it quantitatively to a 250 cm volumetric flask, make up to the mark with distilled water, and mix thoroughly.
Step-by-Step Reasoning
- Dissolve the AgNO in a small volume of distilled water in the beaker.
- Pour the solution into a 250 cm volumetric flask through a funnel.
- Rinse the beaker and funnel with distilled water and add the washings to the flask; this ensures all solute is transferred.
- Add distilled water until the bottom of the meniscus sits exactly on the calibration mark.
- Stopper and invert the flask several times to ensure a uniform solution.
Key Takeaways
Quantitative transfer and making up to the mark are essential for an accurate concentration. The volumetric flask is the key piece of apparatus.
Common Mistakes
- Using a measuring cylinder instead of a volumetric flask.
- Not washing the beaker and funnel, leaving solute behind.
- Filling above the calibration mark.
Things to Be Careful About
- Use distilled or deionised water.
- Read the meniscus at eye level.
- Name the size: 250 cm volumetric flask.
The student uses the following method.
- step 1: Dissolve of to form of aqueous solution. Label this solution A.
- step 2: Transfer of solution A into a conical flask.
- step 3: Add aqueous sodium sulfate, , to the flask and swirl the mixture to remove barium ions from the solution.
- step 4: Add 2–3 drops of indicator to the flask.
- step 5: Titrate the contents of the flask against .
- step 6: Repeat steps 2 to 5 to collect sufficient data for analysis.
Answer
A 20.0 cm pipette.
20.0 cm3 pipette
Background Concept
A pipette is designed to deliver a fixed, accurate volume of liquid. A burette delivers variable volumes, and a measuring cylinder is less accurate.
Understanding the Question
Suggest a suitable piece of apparatus for transferring exactly 20.0 cm of solution A.
Approach
Identify the volumetric apparatus that delivers a fixed volume.
Step-by-Step Reasoning
A 20.0 cm pipette is calibrated to deliver exactly 20.00 cm, making it suitable for step 2.
Key Takeaways
Use a pipette for fixed-volume transfers.
Common Mistakes
- Suggesting a burette or measuring cylinder, which are not designed for accurate fixed-volume transfer.
Things to Be Careful About
- Include the size: 20.0 cm.
Answer
Barium ions would react with the chromate(VI) indicator, forming a precipitate of , which would interfere with the end-point.
Barium ions react with chromate(VI) ions and interfere with the indicator/end-point.
Background Concept
In this titration, is the indicator. After all chloride ions have reacted, excess reacts with chromate ions to form a red precipitate of , signalling the end-point. Barium ions also form an insoluble chromate, .
Understanding the Question
Explain why barium ions must be removed before the titration. The reason concerns the indicator.
Approach
Identify the reaction between barium ions and chromate ions and its effect on the end-point.
Step-by-Step Reasoning
If remains, it will react with from the indicator to form a precipitate of barium chromate. This would consume the indicator and/or produce a precipitate that obscures the sharp colour change at the end-point.
Key Takeaways
Indicators must be selective; remove ions that react with the indicator itself.
Common Mistakes
- Saying barium reacts with silver nitrate (barium nitrate is soluble).
- Not mentioning chromate ions.
Things to Be Careful About
- Be precise: barium ions react with chromate(VI) ions.
Answer
Potassium chromate(VI) is an irritant/corrosive, so chemically resistant gloves protect the skin.
K2CrO4(aq) is an irritant/corrosive.
Background Concept
Potassium chromate(VI) contains chromium in the +6 oxidation state. Chromate(VI) compounds are irritants and can be corrosive; they may also be harmful if absorbed through the skin.
Understanding the Question
Step 4 involves adding (aq). Explain why gloves should be worn.
Approach
Identify the hazard of the reagent being handled.
Step-by-Step Reasoning
Because (aq) is an irritant/corrosive, wearing chemically resistant gloves prevents skin contact and reduces the risk of harm.
Key Takeaways
Always consider the hazards of reagents when planning practical work and use appropriate PPE.
Common Mistakes
- Giving a vague answer such as “chemicals are dangerous”.
- Blaming AgNO when the question is about step 4.
Things to Be Careful About
- Name the specific hazard: irritant/corrosive.
The student’s results are shown in Table 1.1.
Table 1.1
| rough titration | titration 1 | titration 2 | titration 3 | |
|---|---|---|---|---|
| burette reading (final) / | 20.10 | 40.55 | 20.75 | 20.90 |
| burette reading (initial) / | 0.00 | 20.25 | 0.05 | 0.30 |
| titre / | 20.10 | 20.30 | 20.70 | 20.60 |
The student uses the titres from titrations 2 and 3 shown in Table 1.1 to calculate a mean titre value of .
Answer
Titrations 2 and 3 are the only concordant titres (they agree to within 0.10 cm).
They are the only concordant titres.
Background Concept
In titration, concordant results are those that agree within 0.10 cm of each other. Only concordant titres should be averaged to improve reliability.
Understanding the Question
The student uses titres from titrations 2 and 3 (20.70 and 20.60 cm) to calculate a mean. Explain why the other values are not used.
Approach
Compare the titres and identify which pair is concordant.
Step-by-Step Reasoning
The titres are: rough 20.10, titration 1 20.30, titration 2 20.70, titration 3 20.60. Titrations 2 and 3 differ by 0.10 cm, so they are concordant. Titration 1 (20.30) and the rough titration (20.10) are not concordant with these values, so they are excluded.
Key Takeaways
Use only concordant titres when calculating a mean titre.
Common Mistakes
- Saying “they are closest” without using the term concordant.
- Including the rough titration in the mean.
Things to Be Careful About
- Concordant means within 0.10 cm.
Calculate the percentage error in the titre volume for titration 3.
Show your working.
Working
Titre for titration 3 = 20.60 cm.
Each burette reading has an uncertainty of cm, so the titre has an uncertainty of cm.
Answer
0.485%
0.485%
Background Concept
A burette is typically read to the nearest 0.05 cm. A titre is the difference between the final and initial burette readings, so its absolute uncertainty is the sum of the uncertainties of the two readings: cm. Percentage error is .
Understanding the Question
Calculate the percentage error in the titre for titration 3, which is 20.60 cm. The uncertainty comes from the burette readings.
Approach
Determine the absolute uncertainty in the titre, then divide by the titre and multiply by 100.
Step-by-Step Reasoning
- Titration 3 titre = 20.60 cm.
- Each reading is cm, so the titre uncertainty is cm.
- Percentage error = .
Key Takeaways
When a result is a difference of two measurements, the absolute uncertainties add.
Common Mistakes
- Using only 0.05 instead of 2 × 0.05.
- Dividing by the mean titre 20.65 instead of the titration 3 titre 20.60.
- Forgetting to multiply by 100.
Things to Be Careful About
- Use the titre for titration 3, not the mean.
- Show the working as required.
The equation for the reaction of silver nitrate with barium chloride is shown.
Working
Answer
0.00103 mol
0.00103 mol
Background Concept
The amount of solute in a solution is given by , where is in dm. The mean titre is 20.65 cm, which is 0.02065 dm.
Understanding the Question
Calculate the amount of AgNO present in the mean titre of 20.65 cm of 0.0500 mol dm AgNO.
Approach
Convert the volume to dm and multiply by the concentration.
Step-by-Step Reasoning
mol, which is 0.00103 mol to three significant figures.
Key Takeaways
Always convert cm to dm when using concentration in mol dm.
Common Mistakes
- Forgetting to divide by 1000.
- Using 20.65 as if it were already in dm.
Things to Be Careful About
- Use the mean titre value given (20.65 cm).
- Include the unit mol.
Working
From the equation, 2 mol reacts with 1 mol .
Amount of in 20.0 cm:
In 250 cm:
Answer
0.00645 mol
0.00645 mol
Background Concept
The balanced equation is . Therefore 2 mol AgNO reacts with 1 mol BaCl. The titration was performed on a 20.0 cm aliquot, but the total solution is 250 cm, so the amount must be scaled up by the volume factor.
Understanding the Question
Find the total amount of BaCl in the 250 cm solution A, using the amount of AgNO in the mean titre from (d)(i).
Approach
First use the mole ratio to find moles of BaCl in the 20 cm aliquot, then multiply by 250/20 to scale to the full volume.
Step-by-Step Reasoning
- Moles AgNO in 20 cm = 0.0010325 mol.
- Moles BaCl in 20 cm = 0.0010325 / 2 = 0.00051625 mol.
- In 250 cm: 0.00051625 × (250/20) = 0.006453125 mol, which is 0.00645 mol to three significant figures.
Key Takeaways
Use the stoichiometric ratio before scaling up the volume.
Common Mistakes
- Forgetting the 2:1 mole ratio.
- Scaling before applying the mole ratio incorrectly.
- Using 20.65 cm instead of 20.0 cm for the aliquot volume.
Things to Be Careful About
- The aliquot is 20.0 cm, not the mean titre volume.
- The volume factor is 250/20 = 12.5.
Working
So .
Answer
x = 2
x = 2
Background Concept
The molar mass of a hydrated salt is the mass of one mole of . Since the mass of the hydrated sample and the amount of BaCl it contains are known, . The difference between this molar mass and is the mass of water in one mole, which equals .
Understanding the Question
Use the amount of BaCl in 250 cm from (d)(ii) and the 1.58 g mass of hydrated salt to find .
Approach
Calculate the molar mass of the hydrated salt, subtract the molar mass of anhydrous BaCl, divide by 18, and round to the nearest integer.
Step-by-Step Reasoning
- .
- .
- Mass of water per mole = 244.9 – 208.3 = 36.6 g.
- , so .
Key Takeaways
Water of crystallisation can be found from the difference in molar masses.
Common Mistakes
- Using the mass of anhydrous BaCl instead of the hydrated salt.
- Not rounding to an integer.
- Using incorrect values.
Things to Be Careful About
- must be an integer.
- Show working to earn both method marks.
Another student uses a different experimental method to check the value of obtained by the method described in (b).
Give a brief description of another method, not involving titration, that could be used to determine the value of in the formula . Write your answer using a series of numbered steps.
Your plan should include details of the following:
- the apparatus and method you would use
- the measurements you would make.
You are provided with standard laboratory apparatus.
Answer
- Weigh a clean, dry crucible (and lid) using a balance.
- Add a known mass of (s) to the crucible and weigh again.
- Heat the crucible strongly with a Bunsen burner, using a pipeclay triangle, until the water of crystallisation is driven off.
- Allow to cool in a desiccator, then weigh.
- Repeat heating, cooling and weighing until constant mass is obtained.
- Calculate the mass of water lost = initial mass – final mass.
- Use the moles of water lost and moles of anhydrous to find .
Heat a known mass of hydrated BaCl2 to constant mass, measure mass loss, and calculate x from moles of water lost.
Background Concept
Water of crystallisation can be removed by heating. The mass lost is the mass of water. From the mass of anhydrous BaCl remaining and the mass of water lost, the mole ratio gives .
Understanding the Question
Plan another method, not involving titration, to determine in . Include apparatus, method and measurements.
Approach
Use heating to drive off water, measuring masses before and after. The key is heating to constant mass to ensure all water is removed.
Step-by-Step Reasoning
- Weigh an empty crucible and lid.
- Add a known mass of hydrated salt and weigh again.
- Heat strongly with a Bunsen burner; the pipeclay triangle supports the crucible.
- Cool in a desiccator and weigh.
- Repeat until constant mass, proving complete dehydration.
- Mass of water lost = initial hydrated mass – final anhydrous mass.
- Moles of anhydrous BaCl = final mass / 208.3; moles of water = mass of water / 18.0; .
Key Takeaways
Heating to constant mass is essential for accurate dehydration experiments.
Common Mistakes
- Not heating to constant mass.
- Using the initial hydrated mass to calculate moles of BaCl.
- Forgetting to cool before weighing.
Things to Be Careful About
- Use the anhydrous mass to calculate moles of BaCl.
- Ensure all water is removed before the final weighing.
Effusion is the process in which a gas escapes through a small hole.
A student investigates the relationship between rate of effusion and relative molar mass of a gas using the apparatus shown in Fig. 2.1.
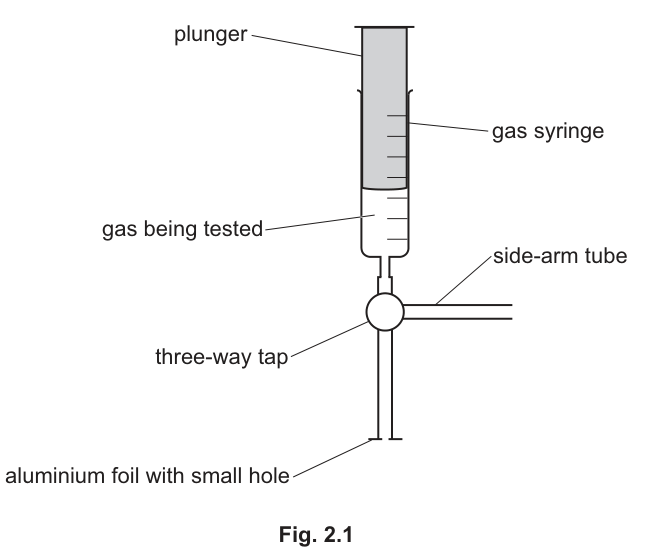
The following method is used:
- step 1: Turn the tap and remove any gas from the syringe through the side-arm tube, by pushing in the plunger.
- step 2: Add of the gas being tested to the syringe through the side-arm tube.
- step 3: Remove the gas from the syringe, through the side-arm tube, by pushing in the plunger.
- step 4: Add of the gas being tested to the syringe through the side-arm tube.
- step 5: Turn the tap to connect the syringe to the tube with the aluminium foil and small hole.
- step 6: Allow the syringe plunger to fall and start a timer when the volume of gas in the syringe reaches .
- step 7: Stop the timer when the volume of gas in the syringe reaches . Record the time taken.
- step 8: Repeat steps 1 to 7 with different gases.
Suggest why the student adds of the gas being tested to the syringe in step 2 and then removes this gas in step 3.
Answer
To ensure no air or other gas remains in the syringe.
To ensure no air or other gas remains in the syringe.
Background Concept
In gas experiments, the apparatus must be completely filled with the gas being tested to avoid contamination from atmospheric air. Air is a mixture of gases (primarily nitrogen and oxygen) with different molar masses. If air remains in the syringe, the effusion rate measured will be an average of the test gas and air, leading to inaccurate results.
Understanding the Question
The student performs steps 2 and 3: adding 50 cm³ of gas and then pushing it out before adding the final 70 cm³. The question asks for the purpose of this 'rinsing' or 'purging' step.
Approach
Think about what is in the syringe before step 2. It contains air. If the student just added 70 cm³ of test gas directly, the syringe would contain a mixture of air and test gas. By adding and removing 50 cm³ first, the air is displaced. Adding another 70 cm³ afterwards ensures the syringe contains only the pure test gas.
Step-by-Step Reasoning
- Before step 2, the syringe and connecting tubes contain air.
- Adding 50 cm³ of test gas in step 2 mixes with the air.
- Removing this mixture in step 3 pushes the contaminated gas out through the side-arm tube.
- This process is repeated (implicitly or by the subsequent addition) to ensure the final 70 cm³ added in step 4 is pure test gas.
- The mark scheme reward is simply stating that this ensures no air or other gas remains.
Key Takeaways
Always purge gas syringes and reaction vessels with the gas being tested to displace atmospheric air. This is a fundamental technique in quantitative gas experiments.
Common Mistakes
Students often write 'to clean the syringe' or 'to remove moisture'. While purging can remove some moisture, the primary chemical reason is to remove air (nitrogen, oxygen, etc.) which would affect the molar mass and effusion rate of the gas mixture.
Things to Be Careful About
Be precise with terminology. Say 'air' or 'atmospheric gas', not just 'impurities'. The mark scheme specifically looks for 'no air / other gas remains'.
The student’s results are shown in Table 2.1.
Table 2.1
| gas | hydrogen, | helium, | neon, | argon, | krypton, |
|---|---|---|---|---|---|
| relative molar mass, | 2.0 | 4.0 | 20.2 | 39.9 | 83.8 |
| time taken / s | 10.8 | 15.3 | 34.5 | 39.7 | 70.4 |
| rate of effusion / |
Complete Table 2.1.
Give the values for to three significant figures.
Give the values for rate of effusion to two decimal places.
Answer
| gas | hydrogen, | helium, | neon, | argon, | krypton, |
|---|---|---|---|---|---|
| relative molar mass, | 2.0 | 4.0 | 20.2 | 39.9 | 83.8 |
| 0.707 | 0.500 | 0.222 | 0.158 | 0.109 | |
| time taken / s | 10.8 | 15.3 | 34.5 | 39.7 | 70.4 |
| rate of effusion / | 4.63 | 3.27 | 1.45 | 1.26 | 0.71 |
sqrt(1/M): 0.707, 0.500, 0.222, 0.158, 0.109; Rate: 4.63, 3.27, 1.45, 1.26, 0.71
Background Concept
Graham's law states that the rate of effusion of a gas is inversely proportional to the square root of its molar mass: . To test this, we calculate (which is ) and the rate of effusion () for each gas.
Understanding the Question
We are given a table with molar masses () and times. We need to calculate two new rows: to 3 significant figures, and rate of effusion to 2 decimal places. Note: The volume of gas effusing is (from steps 6 and 7).
Approach
- For each gas, calculate , then take the square root. Round to 3 s.f.
- Calculate rate = . Round to 2 d.p.
Step-by-Step Reasoning
Hydrogen ():
(3 s.f.)
Rate = (2 d.p.)
Helium ():
(3 s.f.)
Rate = (2 d.p.)
Neon ():
(3 s.f.)
Rate = (2 d.p.)
Argon ():
(3 s.f.)
Rate = (2 d.p.)
Krypton ():
(3 s.f.)
Rate = (2 d.p.)
Key Takeaways
Always pay attention to significant figure instructions. is calculated from , so the number of s.f. in doesn't strictly limit it, but 3 s.f. is standard. Rate is volume/time; volume is exactly 50 cm³ (from 60 to 10), so use the time's precision.
Common Mistakes
Calculating instead of . Forgetting to use the volume change (50 cm³) instead of the total volume (70 cm³) or initial volume (60 cm³). The timer starts at 60 cm³ and stops at 10 cm³, so 50 cm³ has effused.
Things to Be Careful About
The mark scheme requires 3 s.f. for and 2 d.p. for rate. 0.5 must be written as 0.500 to show 3 s.f. 0.710 must be written as 0.71 to show 2 d.p. (trailing zeros after decimal are significant, but here 0.71 is sufficient for 2 d.p.).
Answer
Time taken.
Time taken
Background Concept
In an experiment, the independent variable is the one you change (here, the type of gas, which changes its molar mass ). The dependent variable is the one you measure as a result (here, the time it takes for a specific volume to effuse). Controlled variables are kept constant to ensure a fair test.
Understanding the Question
The question asks to identify the dependent variable. The experiment measures how long it takes for gas to effuse. The time is what is recorded in the table.
Approach
Look at what is being measured and recorded in the results table. The table records 'time taken / s'. This is the dependent variable.
Step-by-Step Reasoning
- The student changes the gas (independent variable).
- The student measures the time it takes for 50 cm³ to effuse.
- Therefore, 'time taken' is the dependent variable.
Key Takeaways
The dependent variable is what you measure. The independent variable is what you change. The controlled variables are what you keep the same.
Common Mistakes
Confusing dependent and independent variables. The rate of effusion is calculated from the time, but the raw measurement is the time. 'Rate of effusion' could also be accepted as it is directly derived, but 'time taken' is the direct measurement.
Things to Be Careful About
Be precise. 'Time' is acceptable, but 'time taken' is better. Don't say 'type of gas' as that is the independent variable.
Identify a variable, other than temperature, that is controlled when carrying out this experiment.
Answer
Size of the hole (in the aluminium foil).
Size of the hole
Background Concept
Graham's law applies to a specific hole size. The rate of effusion depends on the molar mass and the size of the aperture. If the hole size changes between experiments, the comparison is invalid. Temperature is also mentioned as a controlled variable (since kinetic energy depends on temperature).
Understanding the Question
Identify a controlled variable other than temperature. The apparatus has a specific hole in aluminium foil. This hole size must be the same for all gases to make a fair comparison.
Approach
Look at the apparatus. What physical features could affect the rate of effusion? The size of the hole. If the hole is larger, gas escapes faster. This must be kept constant.
Step-by-Step Reasoning
- Effusion rate depends on molar mass and hole size.
- The student tests different gases (changes molar mass).
- To compare rates fairly, the hole size must be the same.
- Therefore, 'size of hole' is a controlled variable.
Key Takeaways
In effusion experiments, the pinhole size is critical. Any change in hole size invalidates the comparison between gases.
Common Mistakes
Saying 'volume of gas'. The volume is 50 cm³ for all tests, so it is controlled, but 'size of hole' is a more fundamental apparatus variable. 'Pressure' is also controlled (atmospheric pressure), but 'size of hole' is more specific to the apparatus setup.
Things to Be Careful About
The mark scheme specifically accepts 'size of hole'. 'Diameter of hole' is also acceptable. Don't say 'area of hole' unless you mean the cross-sectional area of the pinhole.
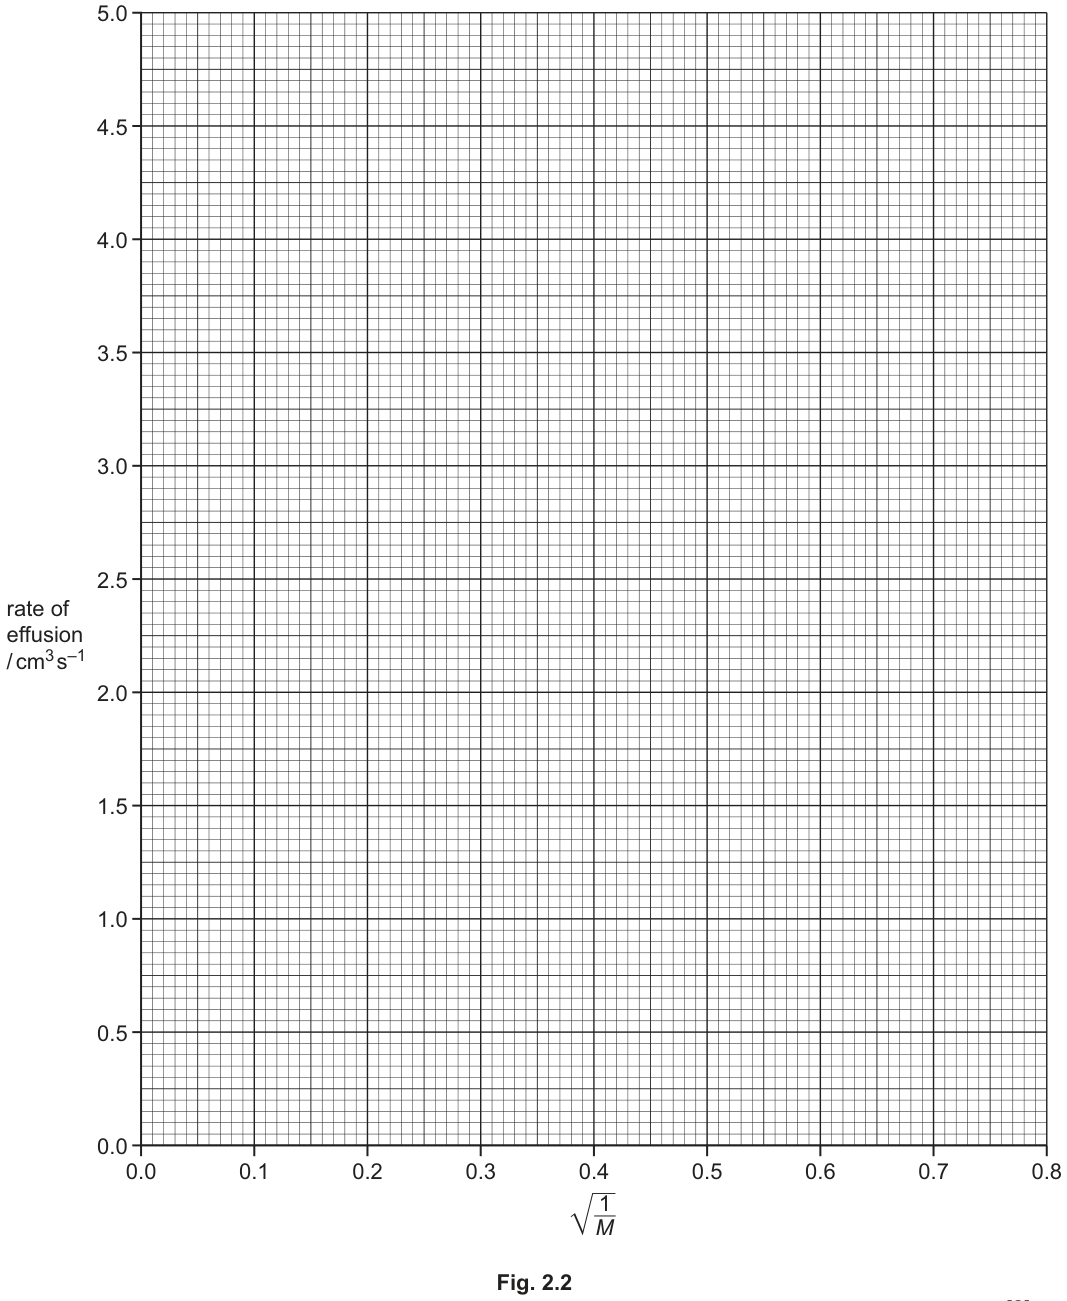
Plot a graph on the grid in Fig. 2.2 to show the relationship between rate of effusion and .
Use a cross () to plot each data point. Draw a suitable line of best fit.
Answer
Plot the following points on the grid in Fig. 2.2 using crosses ():
Draw a straight line of best fit that passes through the origin and as close to all points as possible.
Graph with 5 points plotted and a straight line of best fit through the origin.
Background Concept
Graham's law predicts a linear relationship: . A graph of rate (y-axis) against (x-axis) should be a straight line passing through the origin. The gradient of this line is the constant .
Understanding the Question
Plot the calculated values from part (b)(i) on the given grid. The x-axis is (0.0 to 0.8) and the y-axis is rate of effusion (0.0 to 5.0). Draw a line of best fit.
Approach
- Read the coordinates from the table: .
- Plot each point carefully.
- Draw a straight line through the origin that minimizes the distance to all points.
Step-by-Step Reasoning
Point 1 (Hydrogen): , . This is near the top right.
Point 2 (Helium): , . Mid-right.
Point 3 (Neon): , . Lower left.
Point 4 (Argon): , . This point is slightly below the line (anomalous).
Point 5 (Krypton): , . Bottom left.
The line should start at and go through . The gradient is roughly .
Key Takeaways
When plotting, ensure axes are read correctly. The line of best fit for a proportional relationship must pass through the origin. Don't force the line through an anomalous point; let it represent the general trend.
Common Mistakes
Plotting points incorrectly (swapping x and y). Forcing the line through all points including the anomalous one. Not drawing the line through the origin when the theory predicts it should.
Things to Be Careful About
Use a sharp pencil. Plot crosses (), not dots. The line of best fit should have roughly equal numbers of points on either side (excluding the anomalous point if it's a clear outlier).
Circle one point on the graph in Fig. 2.2 which you consider to be most anomalous.
Suggest one reason for this anomaly. Assume there is no error in .
Answer
Circle the point for argon () as it is the most anomalous (furthest below the line of best fit).
Reason: The measured (recorded) time for argon was greater than the true time taken (or the measured rate was lower than the true rate).
Argon point circled; measured time was greater than the true time.
Background Concept
An anomalous result is a data point that does not fit the general trend or line of best fit. In this experiment, the trend is linear through the origin. If a point is below the line, its y-value (rate) is lower than expected for its x-value (). Since rate = volume / time, a lower rate means a larger time was recorded.
Understanding the Question
Identify the most anomalous point on the graph and explain why, assuming no error in (i.e., molar masses are correct).
Approach
- Look at the graph. Which point is furthest from the line of best fit?
- The argon point (0.158, 1.26) is below the line. The line predicts a rate of ~1.55 for , but the measured rate is 1.26.
- Lower rate = longer time. So the student took too long to stop the timer, or started it late.
Step-by-Step Reasoning
- Identify anomaly: The argon point is clearly below the line of best fit. Hydrogen, helium, neon, and krypton are close to or on the line. Argon is the outlier.
- Analyze direction: The point is below the line, meaning the measured rate (1.26) is lower than the predicted rate (~1.55).
- Relate to measurement: Rate = . A lower calculated rate means the time used in the calculation was larger than it should have been.
- Conclusion: The student recorded a time that was too long (measured time > true time). This could be due to human reaction time starting or stopping the timer late.
Key Takeaways
When analyzing anomalies, determine if the measured value is higher or lower than expected, and link this to the raw measurement (time, volume, temperature, etc.).
Common Mistakes
Saying 'the student made a mistake' without explaining what kind of mistake. Not linking the position of the point (above/below line) to the direction of the error (time too long/short).
Things to Be Careful About
The mark scheme accepts 'measured time > true time' or 'measured rate < true rate'. Be specific about which variable was affected.
Graham’s law of effusion can be expressed as:
State whether or not the student’s results support Graham’s law of effusion.
Explain your answer, using the graph in Fig. 2.2.
Answer
Yes, the results support Graham's law of effusion.
Explanation: The graph of rate of effusion against is a straight line that passes through the origin, showing that the rate is directly proportional to .
Yes; the graph is a straight line through the origin.
Background Concept
Graham's law states: . Mathematically, where is rate and is . This is the equation of a straight line through the origin.
Understanding the Question
State whether the results support the law and explain using the graph.
Approach
- Look at the graph's shape: is it a straight line?
- Look at the intercept: does it pass through (0,0)?
- If both are true, the data supports the law.
Step-by-Step Reasoning
- The graph is approximately a straight line (ignoring the anomalous argon point).
- The line passes through the origin . When (infinite molar mass), rate = 0.
- This direct proportionality confirms Graham's law.
Key Takeaways
To prove a proportional relationship (), the graph of against must be a straight line through the origin.
Common Mistakes
Saying 'yes because the points are close together'. Must mention 'straight line' and 'through the origin'.
Things to Be Careful About
Don't say 'the graph is linear'. Say 'straight line through the origin'. The origin is a key part of the proof for proportionality.
Suggest how the position of the plotted points relative to the line of best fit in Fig. 2.2 is related to the reliability of the results.
Answer
The results are not reliable (or not fully reliable) because there is an anomalous result (for argon) that does not lie on the line of best fit.
The results are not reliable as there is an anomalous result.
Background Concept
Reliability refers to the consistency of results. If there is an anomalous point, it suggests an error occurred in that specific measurement, reducing the overall reliability of the dataset. A reliable experiment would have all points close to the line of best fit.
Understanding the Question
How does the position of points (specifically the anomalous one) relate to reliability?
Approach
- Reliability means consistency.
- An anomalous point shows inconsistency.
- Therefore, reliability is reduced.
Step-by-Step Reasoning
- Most points lie close to the line of best fit, suggesting good reliability for those measurements.
- However, the argon point is anomalous.
- The presence of an anomalous result means the results are not fully reliable.
- To improve reliability, the student should repeat the experiment for argon and check for the error.
Key Takeaways
An anomalous result reduces the reliability of the overall dataset. Reliability requires consistency across all measurements.
Common Mistakes
Saying 'the results are reliable because the line is straight'. Must acknowledge the anomalous point.
Things to Be Careful About
Use the word 'reliable' or 'consistent'. Don't confuse reliability with validity. Validity is about whether the experiment measures what it's supposed to measure (it is valid). Reliability is about consistency (it's compromised by the anomaly).
The student then repeats this method to determine the value of of a sample of natural gas.
The time recorded in step 7 is .
Use the graph in Fig. 2.2 and the student’s result to calculate the value of for this sample.
Working
Step 1: Calculate the rate of effusion for natural gas.
Volume effused =
Time taken =
Step 2: Read from the graph.
On the graph, find on the y-axis. Read across to the line of best fit, then down to the x-axis.
(allow )
Step 3: Calculate .
(Allow depending on reading)
Answer
(Accept range )
19.8 g mol^-1 (range 18-21)
Background Concept
To find the molar mass of an unknown gas using Graham's law, we calculate its rate of effusion, find the corresponding value from the calibration graph (plot of rate vs ), and then solve for .
Understanding the Question
The student tests natural gas. Time = 31.6 s. Calculate using the graph.
Approach
- Calculate rate = .
- Use the graph to find for this rate.
- Square the value to get .
- Invert to get .
Step-by-Step Reasoning
-
Rate calculation:
-
Reading the graph:
Find on the y-axis (rate). Move horizontally to the line of best fit. Move vertically down to the x-axis ().
The value is approximately (neon was with rate , so should be slightly higher, around ).
Let's use . -
Calculating :
If the student reads :
If the student reads :Acceptable range: .
Key Takeaways
When using a graph to find a value, read carefully. The graph is a calibration curve. Once you have the intermediate value (), do the algebra to find the final quantity ().
Common Mistakes
Forgetting to square the x-axis value to get . Forgetting to invert to get . Using the wrong volume (e.g., 60 or 70 instead of 50).
Things to Be Careful About
State symbols are not required for , but units are good practice ( or just 'relative molar mass'). The graph reading will have uncertainty, so a range of answers is acceptable in the mark scheme.
Natural gas is a mixture of mainly methane, , with small amounts of other gases.
Suggest what your calculated value of the of natural gas in (g)(i) tells you about the other gases in the mixture.
Answer
The calculated () is greater than the of methane ().
This suggests that the other gases in the mixture have a greater average molar mass than methane (or greater than 16).
The calculated M > 16, so the other gases have a greater average molar mass than methane.
Background Concept
Natural gas is mainly methane (, ). The experiment gives an average molar mass for the mixture. If the average is higher than 16, the impurities must be heavier gases (higher molar mass) to pull the average up.
Understanding the Question
The calculated is ~19.8. Methane is 16. What does this tell us about the other gases?
Approach
- Compare calculated (19.8) with methane (16).
- Since , the mixture is heavier than pure methane.
- Therefore, the other gases must be heavier than methane.
Step-by-Step Reasoning
- Pure methane has .
- The natural gas sample has an average .
- The average is a weighted mean: .
- Since , it must be that .
- Therefore, the other gases have a molar mass greater than 16.
Key Takeaways
The average molar mass of a mixture lies between the molar masses of its components. If the average is higher than the main component, the minor components must be heavier.
Common Mistakes
Saying 'the other gases are heavier'. Must specify 'heavier than methane' or 'molar mass > 16'.
Things to Be Careful About
Be precise. Don't just say 'they are heavier'. Say 'their average molar mass is greater than 16' or 'greater than methane'.
The experiment described in (g) is repeated at a higher temperature.
Suggest how the rate of effusion for this sample of natural gas would change, if at all.
Explain your answer.
Answer
The rate of effusion would increase.
Explanation: At a higher temperature, the gas particles have more kinetic energy and move more quickly (higher average speed), so they effuse through the hole at a faster rate.
Rate increases; gas particles move more quickly at higher temperature.
Background Concept
Effusion rate depends on the speed of gas particles. According to kinetic theory, the average kinetic energy of gas particles is proportional to temperature (). Higher temperature means higher average speed (). Faster particles hit the hole more frequently and pass through more quickly.
Understanding the Question
How does increasing temperature affect the rate of effusion? Explain why.
Approach
- State the effect: rate increases.
- Explain using kinetic theory: higher T -> higher KE -> higher speed -> faster effusion.
Step-by-Step Reasoning
- Effect: Rate of effusion increases.
- Reason: Temperature is a measure of average kinetic energy. At higher , particles have more kinetic energy.
- More kinetic energy means higher average velocity/speed.
- Faster particles effuse through the small hole more quickly.
- Therefore, the rate (volume per time) increases.
Key Takeaways
Temperature affects the speed of gas particles. Higher temperature = faster particles = faster effusion (and higher pressure if volume is constant).
Common Mistakes
Saying 'particles expand' or 'gas expands'. Gases do expand, but effusion is about particle speed, not volume change of the container.
Things to Be Careful About
Use precise terminology: 'kinetic energy', 'average speed', 'move more quickly'. Don't just say 'they move faster' without linking it to temperature/energy.