Chemistry 9701/52 — October/November 2025
Cambridge A-Level · Planning, Analysis and Evaluation · worked solutions for every part, with the mark scheme
Topics Analysis, Conclusions and Evaluation · Planning
Aqueous silver ions, , react slowly with aqueous iron(II) ions, . An equilibrium is established.
The concentration of at equilibrium can be determined by titration with a standard solution of aqueous potassium thiocyanate, .
During the titration, the remaining ions react with ions to form a precipitate of .
When all ions have been removed from solution, excess ions react with to form a complex ion, , which has a red colour.
The appearance of the red colour indicates the end-point.
A student carries out an experiment to determine the equilibrium constant, .
The student makes of to use in the titration.
Working
Answer
0.486 g
0.486 g
Background Concept
To prepare a solution of known concentration, we use the relationship between moles, concentration, and volume:
Rearranging gives . The mass of a substance is then found using its molar mass ():
Understanding the Question
The question asks for the mass of solid potassium thiocyanate (KSCN) required to make 250.0 cm of a 0.0200 mol dm solution. We are given the target volume and concentration, and we need to calculate the mass using the molar mass of KSCN.
Approach
- Convert the volume from cm to dm by dividing by 1000.
- Calculate the moles of KSCN needed using .
- Calculate the molar mass of KSCN by summing the atomic masses of K, S, C, and N.
- Calculate the mass using .
Step-by-Step Reasoning
- Volume conversion: .
- Moles calculation: .
- Molar mass of KSCN: .
- Mass calculation: .
Key Takeaways
Always ensure volume is in dm when using the concentration equation . The molar mass must be calculated accurately using standard atomic weights.
Common Mistakes
- Forgetting to convert cm to dm (dividing by 1000).
- Using the wrong molar mass (e.g., forgetting to include carbon or nitrogen in KSCN).
Things to Be Careful About
- Significant figures: the answer should be given to 3 significant figures, matching the precision of the given concentration (0.0200).
- Ensure all atomic masses are added correctly for the full formula KSCN.
Describe how the student should make of starting from the mass of calculated in (a) in a beaker.
Give the name and size of any key apparatus used.
Write your answer using a series of numbered steps.
Answer
- Dissolve the 0.486 g of solid KSCN in a small volume of distilled water in the 50 cm beaker.
- Transfer the solution to a 250 cm volumetric flask. Rinse the beaker with distilled water and add the rinsings to the flask.
- Add distilled water to the volumetric flask until the meniscus just touches the 250 cm mark. Stopper the flask and invert it several times to ensure the solution is mixed.
See working
Background Concept
Preparing a standard solution of exact concentration requires a volumetric flask. The process involves dissolving the solute, transferring it quantitatively to the flask, and making up to the mark with solvent. "Quantitative transfer" means ensuring all the solute is moved, which is achieved by rinsing the original container.
Understanding the Question
The student must describe the procedure to make 250.0 cm of 0.0200 mol dm KSCN(aq) starting from the solid calculated in part (a). The description must include key apparatus (name and size) and be written as numbered steps.
Approach
Follow the standard laboratory procedure for preparing a standard solution:
- Dissolve the solid in a small amount of solvent.
- Transfer to the volumetric flask and rinse to ensure quantitative transfer.
- Make up to the mark and mix.
Step-by-Step Reasoning
- Step 1: Dissolving in a beaker is standard practice. Use a small volume of distilled water to ensure the solid dissolves completely before transfer.
- Step 2: The key apparatus is a 250 cm volumetric flask (or 250.0 cm). The solution is transferred, and the beaker is rinsed with distilled water to ensure all KSCN is in the flask. This is a crucial mark point for "quantitative transfer".
- Step 3: Distilled water is added to the flask until the bottom of the meniscus aligns with the graduation mark. The flask is then stoppered and inverted to mix the solution uniformly.
Key Takeaways
A standard solution preparation always involves dissolving, quantitative transfer (rinsing), making up to the mark, and mixing. The volumetric flask must be specified with its volume.
Common Mistakes
- Forgetting to mention rinsing the beaker (loses the mark for quantitative transfer).
- Saying "fill with water" instead of "add distilled water to the mark".
- Not specifying the size of the volumetric flask (must be 250 cm).
Things to Be Careful About
- Use the word "distilled" or "deionised" water, not just "water".
- Ensure the steps are logical and numbered.
The student uses the following method to determine .
step 1 Add of aqueous silver nitrate, , into a dry conical flask. Label this flask A.
step 2 Add of aqueous iron(II) sulfate, , into flask A.
step 3 Seal flask A, using a bung.
step 4 Allow flask A to stand for twelve hours.
step 5 Transfer of the mixture from flask A into another conical flask, flask B, without disturbing the precipitate in flask A.
step 6 Titrate the sample in flask B with aqueous potassium thiocyanate, .
step 7 Repeat steps 5 and 6 until concordant values are obtained.
Answer
To prevent oxidation of Fe(aq) ions by oxygen in the air.
To prevent oxidation of Fe^{2+}(aq) by air.
Background Concept
Iron(II) ions, Fe(aq), are easily oxidised by atmospheric oxygen to form iron(III) ions, Fe(aq). This is a common side reaction that can interfere with experiments relying on the concentration of Fe.
Understanding the Question
Flask A contains the equilibrium mixture of Ag, Fe, and Fe. Step 3 involves sealing the flask. We need to suggest why this is done.
Approach
Consider what could react with the contents of the flask if it were open to the air. Fe is a reducing agent and can be oxidised by O in the air.
Step-by-Step Reasoning
- The equilibrium mixture contains Fe(aq) ions.
- If the flask is open, oxygen from the air can dissolve in the solution and oxidise Fe to Fe.
- This would alter the equilibrium concentrations and invalidate the calculation.
- Sealing the flask with a bung prevents air (and thus oxygen) from entering.
Key Takeaways
Always consider the stability of reactants and products in equilibrium experiments. Fe is particularly susceptible to oxidation by air.
Common Mistakes
- Saying "to prevent evaporation" (not the primary reason here).
- Not specifying what is being oxidised (must mention Fe or iron(II)).
Things to Be Careful About
- The mark scheme specifically looks for "avoid oxidation". Be precise.
Answer
To allow sufficient time for the equilibrium to be reached (or established).
To ensure equilibrium is reached.
Background Concept
Many reactions, especially in aqueous solution, are slow. An equilibrium is only established when the forward and reverse reaction rates are equal, and concentrations are constant. Leaving the mixture for an extended period (e.g., 12 hours) ensures this state is achieved.
Understanding the Question
Step 4 involves leaving flask A for twelve hours. We need to suggest the purpose of this waiting period.
Approach
The question states in the preamble that the reaction is "slow". Leaving it for 12 hours allows the slow reaction to proceed until equilibrium is established.
Step-by-Step Reasoning
- The reaction between Ag and Fe is slow.
- The student needs the system to be at equilibrium to measure the equilibrium concentrations and calculate .
- Leaving it for 12 hours ensures that the equilibrium has been reached and concentrations are no longer changing.
Key Takeaways
In equilibrium experiments, sufficient time must be allowed for the system to reach equilibrium, especially if the reaction kinetics are slow.
Common Mistakes
- Saying "to let the precipitate settle" (not the primary reason for the 12-hour wait).
- Not using the word "equilibrium".
Things to Be Careful About
- Use the exact phrasing "equilibrium has been reached" or "established".
Answer
Silver (Ag)
Silver (Ag)
Background Concept
In the equilibrium reaction:
Silver ions are reduced to solid silver, which precipitates out of solution. Iron(II) is oxidised to iron(III).
Understanding the Question
Step 5 mentions transferring the mixture without disturbing the precipitate. We need to identify what this precipitate is.
Approach
Look at the products of the reaction in flask A. Ag(s) is a solid and is insoluble in water, so it forms the precipitate.
Step-by-Step Reasoning
- The reaction produces Ag(s) and Fe(aq).
- Ag(s) is a solid metal that does not dissolve in the aqueous mixture.
- Therefore, the precipitate is silver (Ag).
Key Takeaways
Always check state symbols in the given equations to identify precipitates.
Common Mistakes
- Identifying the precipitate as AgSCN (this is formed later during titration, not in flask A before titration).
- Saying "silver nitrate" or "iron sulfate" (these are the soluble reactants).
Things to Be Careful About
- The question asks for the precipitate in flask A in step 5, before titration. The only solid present is Ag(s).
The student’s results are shown in Table 1.1
Table 1.1
| rough titration | titration 1 | titration 2 | titration 3 | |
|---|---|---|---|---|
| final burette reading / | 22.50 | 21.75 | 31.65 | 32.20 |
| initial burette reading / | 0.00 | 0.00 | 9.75 | 10.20 |
| titre / | 22.50 | 21.75 | 21.90 | 22.00 |
Answer
Yes. Titres 2 and 3 (21.90 and 22.00 cm) are within 0.10 cm of each other.
Yes, titres 2 and 3 are within 0.10 cm^3 of each other.
Background Concept
Concordant titres are results that are within 0.10 cm of each other. This indicates that the titration has been performed accurately and reliably. Typically, at least two concordant titres are required to calculate a mean.
Understanding the Question
We are given a table of burette readings and titres. We need to state if concordant titres have been achieved and explain why.
Approach
Calculate the differences between the titres (excluding the rough titration). If at least two titres are within 0.10 cm of each other, concordant titres have been achieved.
Step-by-Step Reasoning
- Titres are: rough = 22.50, 1 = 21.75, 2 = 21.90, 3 = 22.00.
- Ignore the rough titration.
- Difference between tit 2 and tit 3: cm.
- Since 0.10 cm cm, titres 2 and 3 are concordant.
- (Note: tit 1 is 21.75, which is 0.15 cm from tit 2, so it is not concordant with them, but we only need two concordant values).
Key Takeaways
Concordant titres are within 0.10 cm. Always check the differences between the accurate titres (not the rough).
Common Mistakes
- Including the rough titration in the concordance check.
- Saying "yes, all titres are the same" (they are not).
Things to Be Careful About
- The mark scheme accepts "yes" and the explanation that two titres are within 0.10 cm. Be specific about which titres.
Working
The absolute error for a burette reading is cm. Since a titre requires two readings (initial and final), the total absolute error is cm.
Answer
0.457%
0.457%
Background Concept
Burette readings are typically read to the nearest 0.05 cm. Therefore, the absolute error for a single reading is cm. A titre is the difference between two readings (final - initial), so the maximum absolute error in a titre is cm.
Percentage error is calculated as:
Understanding the Question
Calculate the percentage error in the titre volume for titration 2, which is 21.90 cm.
Approach
- Identify the absolute error for a titre (0.10 cm).
- Apply the percentage error formula using the titre value from titration 2.
Step-by-Step Reasoning
- Absolute error = cm.
- Titre value = 21.90 cm.
- Percentage error = .
Key Takeaways
Always remember that a titre involves two burette readings, so the absolute error is doubled. Show your working clearly.
Common Mistakes
- Using an absolute error of 0.05 cm (forgetting to double it for two readings).
- Not showing working (the mark scheme requires it).
- Rounding too early or using wrong significant figures.
Things to Be Careful About
- The mark scheme specifically shows the working as . Follow this format.
The student repeats the experiment using at a higher concentration. The student obtains smaller titres.
Suggest one reason why a larger titre is better than a smaller titre.
Answer
A larger titre has a lower percentage error (for the same absolute error from the burette readings).
A larger titre has a lower percentage error.
Background Concept
The absolute error in a burette reading is fixed (e.g., cm for a titre). The percentage error is inversely proportional to the measured value:
Therefore, a larger measured value (larger titre) results in a smaller percentage error, making the result more precise.
Understanding the Question
The student uses a higher concentration of KSCN, resulting in smaller titres. We need to suggest why a larger titre is better.
Approach
Relate the titre volume to the percentage error. A larger titre means the fixed absolute error is a smaller fraction of the total volume.
Step-by-Step Reasoning
- The absolute error from the burette is constant (e.g., 0.10 cm).
- If the titre is small (e.g., 5.00 cm), the percentage error is .
- If the titre is large (e.g., 25.00 cm), the percentage error is .
- Therefore, a larger titre gives a lower percentage error and is more accurate/precise.
Key Takeaways
Larger titre volumes reduce the relative (percentage) error in titrations. This is why we often use more concentrated solutions or larger sample volumes to get titres around 20-30 cm.
Common Mistakes
- Saying "it is more accurate" without explaining why (need to mention percentage error).
- Saying "it saves time" (not relevant to accuracy).
Things to Be Careful About
- The mark scheme specifically looks for "percentage error is lower". Use this terminology.
Another student calculates a mean titre of . Use this value to complete the following calculation.
Working
Moles of SCN used:
Moles of Ag in the 10.0 cm sample:
From the equation , the ratio is 1:1.
Concentration of Ag in the equilibrium mixture:
The sample was 10.0 cm taken from the 50.0 cm total mixture in flask A. However, the concentration is the same throughout the mixture (assuming the precipitate is removed and we are titrating the solution).
Answer
0.0437 mol dm
0.0437 mol dm^-3
Background Concept
The titration determines the concentration of Ag ions remaining in the equilibrium mixture. The reaction is:
This is a 1:1 stoichiometric reaction. The moles of SCN used equal the moles of Ag in the aliquot (sample) taken.
Understanding the Question
Using a mean titre of 21.85 cm of 0.0200 mol dm KSCN, calculate the concentration of Ag in the equilibrium mixture in flask A. The sample titrated was 10.0 cm taken from flask A.
Approach
- Calculate moles of SCN used in the titration.
- Use the 1:1 ratio to find moles of Ag in the 10.0 cm sample.
- Calculate the concentration of Ag using the sample volume.
Step-by-Step Reasoning
- Moles of SCN: mol.
- Moles of Ag in sample: Since ratio is 1:1, mol.
- Concentration of Ag: mol dm.
- Note: The concentration in the 10.0 cm sample is the same as the concentration in the entire mixture in flask A (the solution is homogeneous). We do not need to scale up to the full 50 cm because concentration is an intensive property.
Key Takeaways
Concentration is the same throughout a homogeneous solution. Calculate the concentration directly from the sample volume and moles; no dilution factor is needed for concentration.
Common Mistakes
- Multiplying the moles by 5 (to scale up to 50 cm) and then dividing by 50 cm (which is correct but unnecessary; you can just use the sample values directly).
- Forgetting to convert cm to dm.
Things to Be Careful About
- The concentration calculated is for the equilibrium mixture, which is what is needed for the expression.
Working
Initial concentrations in the mixture (after mixing 25.0 cm of each):
Total volume = cm.
Change in concentration:
From the equilibrium equation:
The amount of Ag that reacted =
Since the ratio of Ag reacted to Fe produced is 1:1:
Answer
0.00630 mol dm
0.00630 mol dm^-3
Background Concept
In the equilibrium reaction:
For every 1 mole of Ag that reacts, 1 mole of Fe is produced. The concentration of Fe at equilibrium is equal to the amount of Ag that has been consumed from its initial concentration.
Understanding the Question
Calculate [Fe] in flask A. We know the initial concentrations and the equilibrium concentration of Ag.
Approach
- Calculate the initial concentrations of Ag and Fe after mixing (accounting for the doubling of volume).
- Use the difference between initial and equilibrium [Ag] to find how much reacted.
- This difference equals [Fe] due to the 1:1 stoichiometry.
Step-by-Step Reasoning
- Initial [Ag]: 25.0 cm of 0.100 mol dm diluted to 50.0 cm. mol dm.
- Initial [Fe]: Similarly, mol dm.
- Equilibrium [Ag]: Calculated in part (e)(i) as mol dm.
- Amount of Ag reacted: mol dm.
- Equilibrium [Fe]: Since 1 mol Ag produces 1 mol Fe, mol dm.
Key Takeaways
Use an ICE (Initial, Change, Equilibrium) table approach mentally. The change in reactant concentration equals the change in product concentration (adjusted for stoichiometry).
Common Mistakes
- Forgetting to calculate the initial concentrations after mixing (using 0.100 instead of 0.0500).
- Not using the correct number of significant figures (0.00630, not 0.0063).
Things to Be Careful About
- The volume doubles when mixing equal volumes, so initial concentrations are halved.
- Use the value from part (e)(i) directly.
The formula for the equilibrium constant, , is shown.
Determine the value of .
Give the units of .
Working
Equilibrium concentrations:
Calculate :
Units:
Answer
, units = dm mol
3.30, units = dm^3 mol^-1
Background Concept
The equilibrium constant is calculated using the equilibrium concentrations of the aqueous species. Solids (like Ag(s)) are not included in the expression.
Units are derived by substituting the units of concentration (mol dm) into the expression.
Understanding the Question
Calculate and its units using the equilibrium concentrations. Note that [Fe] must be calculated first.
Approach
- Calculate [Fe] using the initial concentration and the amount reacted (which equals [Fe]).
- Substitute all equilibrium concentrations into the expression.
- Derive the units algebraically.
Step-by-Step Reasoning
- [Fe]: Initial was 0.0500 mol dm. Amount reacted = [Fe] = 0.00630 mol dm. So, mol dm.
- calculation:
- Units:
Key Takeaways
Always calculate all equilibrium concentrations before substituting into . Units must be derived systematically.
Common Mistakes
- Forgetting to calculate [Fe] and using the initial concentration (0.0500) instead.
- Including Ag(s) in the expression.
- Getting the units wrong (e.g., writing mol dm instead of dm mol).
Things to Be Careful About
- The mark scheme shows the calculation as . Note that [Fe] happens to be numerically equal to [Ag] in this case (0.0437), but you must show the correct reasoning.
- Give to 3 significant figures.
Several other students perform the same experiment at different temperatures. The values that they obtain are used to produce the graph in Fig. 1.1.
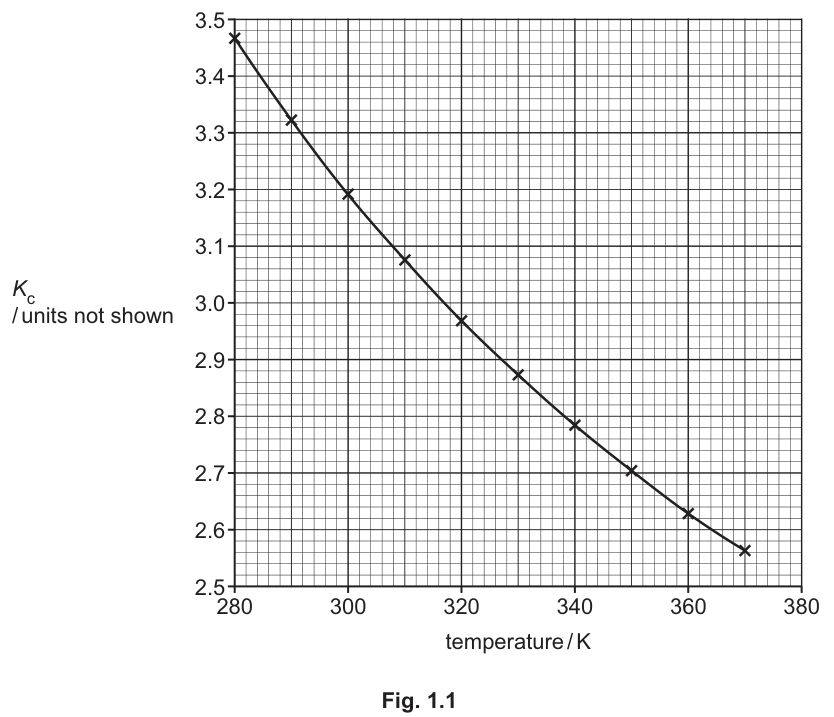
One student suggests that is directly proportional to temperature.
State and explain if the results displayed in Fig. 1.1 support this suggestion.
Answer
No. As temperature increases, decreases (they are not directly proportional; a directly proportional graph would be a straight line through the origin with a positive slope).
No, as temperature increases, Kc decreases.
Background Concept
Direct proportionality between two variables and means , where is a constant. A graph of against would be a straight line passing through the origin (0,0) with a positive gradient.
Understanding the Question
A student suggests is directly proportional to temperature. We need to state if the graph supports this and explain.
Approach
Look at the graph in Fig 1.1. Does increase linearly with temperature? No, it decreases. Therefore, they are not directly proportional.
Step-by-Step Reasoning
- The graph shows on the y-axis and temperature on the x-axis.
- As temperature increases (moves right), decreases (moves down).
- Direct proportionality requires that as one increases, the other increases (positive correlation).
- Therefore, the results do not support the suggestion.
Key Takeaways
Direct proportionality means a linear relationship with a positive gradient through the origin. A decreasing relationship is not directly proportional.
Common Mistakes
- Saying "yes, it's a curve" (not addressing the direction of change).
- Not explaining why it's not directly proportional (must mention that decreases as T increases).
Things to Be Careful About
- The mark scheme looks for "No" and the explanation that decreases as temperature increases.
Another student suggests that the data represented in the graph in Fig. 1.1 is reliable.
Explain how the graph supports this suggestion.
Answer
The data points lie close to a smooth curve (or line of best fit) with no anomalous points, indicating the results are reliable.
There are no anomalous points; data points follow a smooth trend.
Background Concept
Reliable data in an experiment is characterised by consistency and the absence of anomalies. When plotting a graph, if all data points lie close to a line or curve of best fit without any points that deviate significantly (anomalies), the data is considered reliable.
Understanding the Question
Another student suggests the data in Fig 1.1 is reliable. Explain how the graph supports this.
Approach
Look at the scatter of the data points around the curve of best fit. Are there any outliers?
Step-by-Step Reasoning
- The graph shows multiple data points (crosses) plotted.
- A smooth curve has been drawn through them.
- All points lie very close to the curve; there are no points that are far away from the trend (no anomalies).
- This consistency suggests the measurements are reliable and precise.
Key Takeaways
Reliable data shows a clear trend with no outliers. Anomalous points reduce confidence in the results.
Common Mistakes
- Saying "the line is smooth" (the line is drawn by the student; the data points following the line is what matters).
- Not mentioning the absence of anomalies.
Things to Be Careful About
- Focus on the data points and their relationship to the trend, not just the appearance of the curve.
Use the data displayed in Fig. 1.1 to state if the forward reaction is exothermic or endothermic.
Explain your answer.
Answer
The forward reaction is exothermic.
Explanation: As temperature increases, decreases. This means the equilibrium position shifts to the left (towards reactants). According to Le Chatelier's principle, increasing temperature favours the endothermic direction. Since the equilibrium shifts left, the reverse reaction is endothermic, so the forward reaction must be exothermic.
Exothermic; as temperature increases, Kc decreases (equilibrium shifts left).
Background Concept
Le Chatelier's principle states that if a change is made to a system at equilibrium, the position of equilibrium shifts to counteract the change.
- For an exothermic forward reaction (): increasing temperature favours the reverse (endothermic) reaction, so decreases.
- For an endothermic forward reaction (): increasing temperature favours the forward reaction, so increases.
Understanding the Question
Use the graph to determine if the forward reaction is exothermic or endothermic and explain.
Approach
- Observe the trend in the graph: as T increases, decreases.
- Relate this to the position of equilibrium: a decreasing means the equilibrium shifts left (towards reactants).
- Apply Le Chatelier's principle: increasing temperature shifts equilibrium in the endothermic direction. Since it shifts left, the reverse reaction is endothermic, so the forward reaction is exothermic.
Step-by-Step Reasoning
- Graph trend: As temperature increases from 280 K to 370 K, decreases from ~3.42 to ~2.56.
- Meaning of decreasing : . If decreases, the numerator decreases and the denominator increases, meaning equilibrium shifts to the left (towards Ag and Fe).
- Le Chatelier's principle: Increasing temperature adds heat. The system counteracts this by absorbing heat, which means favouring the endothermic direction. Since the equilibrium shifts left, the leftward (reverse) reaction is endothermic.
- Conclusion: If the reverse reaction is endothermic, the forward reaction must be exothermic.
Key Takeaways
- decreases with increasing T exothermic forward reaction.
- increases with increasing T endothermic forward reaction.
Common Mistakes
- Getting the direction of the shift wrong (confusing which way change indicates).
- Not mentioning Le Chatelier's principle or the endothermic/exothermic relationship.
- Saying " decreases so it's exothermic" without explaining why.
Things to Be Careful About
- The explanation must link the graph trend to the shift in equilibrium and then to the enthalpy change. All three steps are important for full marks.
A student carries out an experiment to determine the concentration of aqueous sulfate ions, , in a sample of lake water.
The student uses the following method.
step 1 Transfer of the lake water sample to a beaker and record its conductivity as shown in Fig. 2.1.
step 2 Add of aqueous barium hydroxide, , to the beaker.
step 3 Stir the mixture and record the conductivity of the contents of the beaker as shown in Fig. 2.1.
step 4 Repeat steps 2 and 3 until a total of of has been added to the beaker.
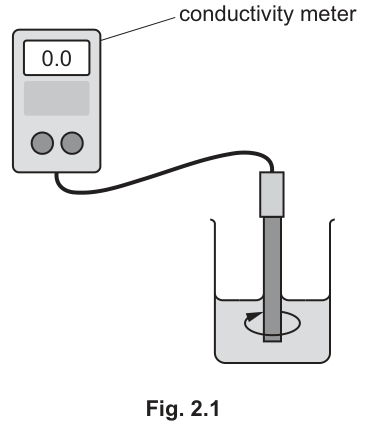
Suggest a suitable piece of apparatus to transfer of the lake water sample to the beaker in step 1.
Answer
volumetric pipette
volumetric pipette
Background Concept
In quantitative analysis, transferring a precise, fixed volume of liquid requires apparatus calibrated to deliver or contain that exact volume at a specific temperature. A volumetric pipette is designed to deliver a specific volume (e.g., 25.00 cm³) with high accuracy (typically ±0.05 cm³ or better). Burettes and measuring cylinders lack the necessary precision for this level of analytical work.
Understanding the Question
The question asks for a suitable piece of apparatus to transfer exactly 25.00 cm³ of lake water in step 1. The value '25.00' implies a need for four significant figures and high precision.
Approach
Identify the standard piece of equipment used in titrations and conductivity experiments to accurately measure and transfer a fixed volume of liquid.
Step-by-Step Reasoning
The volume required is 25.00 cm³, which is a standard volumetric pipette size. A measuring cylinder or beaker would not provide the required precision (usually ±0.5 cm³ or worse). A burette is for variable volumes, not a fixed 25.00 cm³ transfer. Therefore, a 25.00 cm³ volumetric pipette is the correct choice.
Key Takeaways
Always match the apparatus to the required precision: volumetric pipettes for fixed volumes, burettes for variable precise volumes, measuring cylinders for rough volumes.
Common Mistakes
Writing 'pipette' without specifying 'volumetric' (a graduated pipette is less accurate). Writing 'syringe' or 'beaker'.
Things to Be Careful About
Ensure the answer matches the mark scheme exactly: 'volumetric pipette' is the standard term.
is an irritant to skin and eyes. Other than wearing safety goggles, state one safety precaution that the student should take when conducting this experiment.
Answer
wear chemically resistant gloves
wear chemically resistant gloves
Background Concept
Barium hydroxide, Ba(OH)₂(aq), is a strong base and is classified as an irritant to skin and eyes. Standard laboratory risk assessments require personal protective equipment (PPE) to prevent contact with irritants. While safety goggles protect the eyes, the skin is also vulnerable.
Understanding the Question
The question states Ba(OH)₂ is an irritant to skin and eyes and asks for one safety precaution other than wearing safety goggles.
Approach
Identify PPE that protects the skin from chemical irritants.
Step-by-Step Reasoning
Since the hazard is irritation to skin and eyes, and goggles cover the eyes, the remaining primary exposure route is skin contact. Wearing chemically resistant gloves (e.g., nitrile or latex gloves) will prevent the irritant from touching the skin. Wearing a lab coat is also acceptable, but gloves are the most direct answer for skin irritation.
Key Takeaways
Always consider all routes of exposure (eyes, skin, inhalation) when selecting PPE. If eyes are covered, protect skin.
Common Mistakes
Saying 'wear a lab coat' (often accepted, but gloves are more specific to skin irritation). Saying 'avoid contact' (not a specific precaution). Saying 'wear a mask' (not relevant for skin/eye irritants in solution form).
Things to Be Careful About
The mark scheme specifically accepts 'chemically resistant gloves'. 'Gloves' alone is usually acceptable, but 'chemically resistant' is more precise.
The student’s results are given in Table 2.1.
A correction can be applied to the conductivity values to take into account dilution of the solution as its volume increases using the following equation.
Table 2.1
| reading number | volume of added to beaker / | total volume in beaker / | measured conductivity / | corrected conductivity / |
|---|---|---|---|---|
| 1 | 0.00 | 25.00 | 37 000 | 37 000 |
| 2 | 5.00 | 23 000 | 27 600 | |
| 3 | 10.00 | 12 000 | 16 800 | |
| 4 | 15.00 | 2 300 | 3 680 | |
| 5 | 20.00 | 5 000 | ||
| 6 | 25.00 | 12 000 | ||
| 7 | 30.00 | 18 000 | ||
| 8 | 35.00 | 21 000 | ||
| 9 | 40.00 | 24 500 |
Answer
| reading number | volume of 0.100 mol dm⁻³ Ba(OH)₂(aq) added to beaker / cm³ | total volume in beaker / cm³ | measured conductivity / μS cm⁻¹ | corrected conductivity / μS cm⁻¹ |
|---|---|---|---|---|
| 1 | 0.00 | 25.00 | 37 000 | 37 000 |
| 2 | 5.00 | 30.00 | 23 000 | 27 600 |
| 3 | 10.00 | 35.00 | 12 000 | 16 800 |
| 4 | 15.00 | 40.00 | 2 300 | 3 680 |
| 5 | 20.00 | 45.00 | 5 000 | 9 000 |
| 6 | 25.00 | 50.00 | 12 000 | 24 000 |
| 7 | 30.00 | 55.00 | 18 000 | 39 600 |
| 8 | 35.00 | 60.00 | 21 000 | 50 400 |
| 9 | 40.00 | 65.00 | 24 500 | 63 700 |
Working
Total volume in beaker:
For reading 2:
For reading 9:
Corrected conductivity:
For reading 5:
For reading 9:
See table above
Background Concept
In conductivity experiments where a reagent is added to a fixed volume of sample, the total volume increases. This dilution effect reduces the concentration of all ions, lowering the measured conductivity even if no reaction is occurring. To compare conductivity values fairly across different volumes, a correction factor is applied to normalize the values back to the original concentration, as if no dilution had occurred.
Understanding the Question
The student has a table with missing 'total volume in beaker' and 'corrected conductivity' values. The formulas for both are given in the question stem.
Approach
Use the given formulas to calculate the missing values for each reading. Total volume is simply the sum of the initial sample volume and the added reagent volume. Corrected conductivity multiplies the measured value by the ratio of total volume to initial volume.
Step-by-Step Reasoning
Total volume column:
Start with 25.00 cm³. Add the volume of Ba(OH)₂ added for each reading.
- Reading 2:
- Reading 3:
- Reading 4:
- Reading 5:
- Reading 6:
- Reading 7:
- Reading 8:
- Reading 9:
Corrected conductivity column:
Apply .
- Reading 5:
- Reading 6:
- Reading 7:
- Reading 8:
- Reading 9:
Key Takeaways
Always check if a correction factor is needed when volumes change during an experiment. The correction normalizes the data to a common baseline.
Common Mistakes
Forgetting to add the initial 25.00 cm³ when calculating total volume (e.g., writing 5.00 instead of 30.00 for reading 2). Using the wrong ratio in the correction formula (e.g., instead of ).
Things to Be Careful About
Ensure decimal places are consistent (two decimal places for volume, e.g., 30.00, not 30). Check significant figures in calculations; the mark scheme accepts the exact calculated values.
Answer
volume of 0.100 mol dm⁻³ Ba(OH)₂(aq) added to beaker
volume of 0.100 mol dm⁻³ Ba(OH)₂(aq) added to beaker
Background Concept
In an experiment, the independent variable is the quantity that the experimenter deliberately changes or controls to observe its effect on the dependent variable. The dependent variable is the one being measured.
Understanding the Question
The student adds increasing volumes of Ba(OH)₂(aq) to the beaker and measures the conductivity. We need to identify what is being changed.
Approach
Look at the table headers and the method. The volume of Ba(OH)₂ added is set by the student (0, 5, 10, 15... cm³). The conductivity is measured as a result.
Step-by-Step Reasoning
The independent variable is the volume of 0.100 mol dm⁻³ Ba(OH)₂(aq) added to the beaker. This is the variable plotted on the x-axis of the graph in part (c). The dependent variable is the corrected conductivity.
Key Takeaways
The independent variable is what you change; the dependent variable is what you measure.
Common Mistakes
Saying 'conductivity' (this is the dependent variable). Saying 'concentration of sulfate' (this is what we are trying to find, not what we change directly in the table).
Things to Be Careful About
Be precise with the name. 'Volume of Ba(OH)₂' is acceptable, but 'volume of 0.100 mol dm⁻³ Ba(OH)₂(aq) added to beaker' is the most complete and accurate answer.
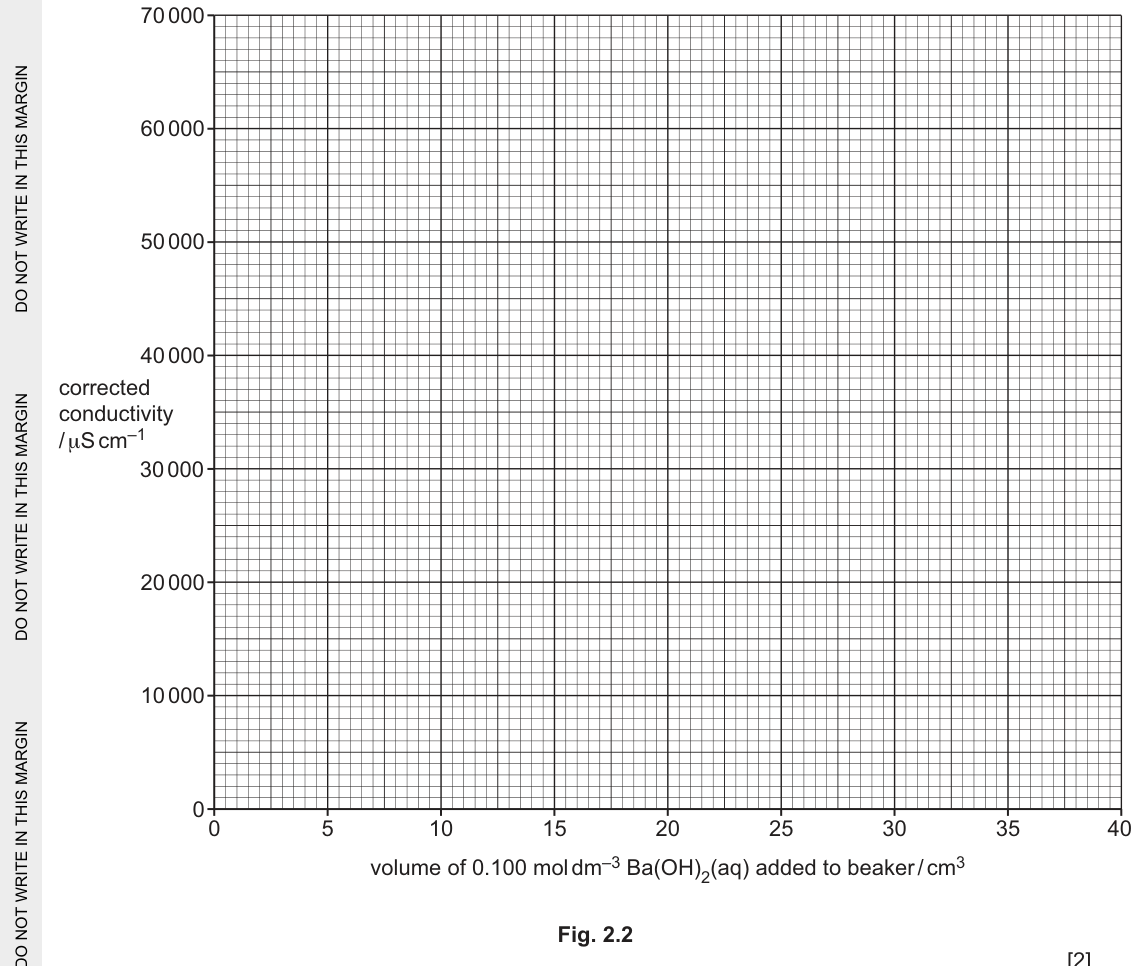
Plot a graph on the grid in Fig. 2.2 to show the relationship between corrected conductivity and volume of added to beaker.
Use a cross () to plot each data point.
Draw a line of best fit using readings 1 to 4 and another line of best fit using readings 5 to 9. Extend the lines so that they intersect.
Answer
See
Working
Plotting points (x, y):
(0, 37000), (5, 27600), (10, 16800), (15, 3680), (20, 9000), (25, 24000), (30, 39600), (35, 50400), (40, 63700)
Lines of best fit:
- Line 1: Through points 1–4 (x = 0 to 15). This line has a negative gradient.
- Line 2: Through points 5–9 (x = 20 to 40). This line has a positive gradient.
- The two lines intersect at approximately x = 17.0 cm³.
See graph with two intersecting lines of best fit
Background Concept
When Ba(OH)₂ is added to a solution containing SO₄²⁻, the reaction occurs. As Ba²⁺ and SO₄²⁻ are removed from the solution to form a precipitate, the conductivity decreases. However, Ba(OH)₂ also introduces OH⁻ ions. Before the equivalence point, the removal of ions (Ba²⁺ and SO₄²⁻) dominates, and conductivity drops. After the equivalence point, excess Ba²⁺ and OH⁻ ions are added, causing conductivity to rise. Plotting corrected conductivity against volume added gives a V-shaped graph. The intersection of the two linear regions (before and after equivalence) gives the exact volume required to react completely with the sulfate.
Understanding the Question
The student must plot the corrected conductivity data from Table 2.1 against the volume of Ba(OH)₂ added. Two lines of best fit are required: one for the decreasing conductivity (readings 1-4) and one for the increasing conductivity (readings 5-9). These lines must intersect.
Approach
- Plot all 9 data points on the grid.
- Draw a straight line of best fit through the first four points (0 to 15 cm³). This line should have a negative gradient.
- Draw a second straight line of best fit through the last five points (20 to 40 cm³). This line should have a positive gradient.
- Extend both lines so they intersect. The x-coordinate of the intersection is the equivalence point volume.
Step-by-Step Reasoning
Plotting:
- x-axis: volume of Ba(OH)₂ added (0 to 40 cm³). Major divisions every 5 cm³.
- y-axis: corrected conductivity (0 to 70 000 μS cm⁻¹). Major divisions every 10 000.
- Plot each (x, y) pair from the completed table.
Lines of best fit:
- Line 1 (readings 1-4): Points are (0, 37000), (5, 27600), (10, 16800), (15, 3680). These form a roughly straight line with a steep negative gradient. Draw a line through them.
- Line 2 (readings 5-9): Points are (20, 9000), (25, 24000), (30, 39600), (35, 50400), (40, 63700). These form a roughly straight line with a positive gradient. Draw a line through them.
- Intersection: The lines cross at approximately x = 16-18 cm³ (e.g., 17.0 cm³). This is the volume where all SO₄²⁻ has reacted.
Key Takeaways
Conductivity titrations produce V-shaped graphs. The equivalence point is found at the intersection of the two linear regions, not necessarily at the minimum data point (which may be slightly off due to dilution or experimental error).
Common Mistakes
- Plotting the wrong axis (e.g., conductivity on x-axis).
- Drawing a single smooth curve through all points instead of two straight lines. The question specifically asks for two lines of best fit that intersect.
- Not extending the lines to intersect. The intersection must be clearly visible.
Things to Be Careful About
- Use crosses (×) for data points as specified.
- Ensure the lines are straight (rulers should be used).
- The intersection point should be read accurately from the grid. A value between 15 and 20 cm³ is expected (typically ~17 cm³).
The point on the graph where the two lines intersect indicates the volume of required to react exactly with the present in of lake water being tested.
Use the graph in Fig. 2.2 to determine the volume of required to react exactly with in the lake water sample.
Answer
17.0 cm³ (accept any value between 15.0 and 19.0 cm³ read from the graph)
17.0 cm³
Background Concept
The intersection of the two lines of best fit in a conductivity titration graph represents the equivalence point. At this point, the amount of titrant added is exactly stoichiometric with the analyte. Before this point, conductivity is dominated by the removal of ions (negative gradient). After this point, conductivity is dominated by the addition of excess ions (positive gradient). The minimum conductivity occurs near this point, but the intersection of the extrapolated linear regions gives the most accurate equivalence volume.
Understanding the Question
The question asks to use the graph from part (c) to determine the volume of Ba(OH)₂ required to react exactly with the SO₄²⁻ in the lake water sample. This is the x-coordinate of the intersection point.
Approach
Read the x-value (volume of Ba(OH)₂ added) where the two lines of best fit intersect on the graph.
Step-by-Step Reasoning
Looking at the completed graph, the line through readings 1-4 (decreasing conductivity) and the line through readings 5-9 (increasing conductivity) intersect at an x-value. Based on the data, the minimum corrected conductivity is at 15.00 cm³ (3680) and the next point is 20.00 cm³ (9000). The intersection will be between 15 and 20 cm³. A typical reading from such a graph would be approximately 17.0 cm³. Any value in the range 15.0-19.0 cm³ is acceptable as it is read from the grid.
Key Takeaways
The intersection of lines in a conductivity graph gives the equivalence point volume, which is more accurate than reading the minimum data point directly.
Common Mistakes
Reading the y-value instead of the x-value. Reading the volume of total solution instead of the volume of Ba(OH)₂ added.
Things to Be Careful About
Ensure the value is read from the x-axis (volume of Ba(OH)₂ added), not the total volume in the beaker. The mark scheme allows a range because it's a graphical reading.
The equation for the reaction taking place in the beaker is shown.
Use your answer in (d)(i) to calculate the concentration of in the lake water sample.
Working
Moles of Ba(OH)₂ added at equivalence point:
Moles of SO₄²⁻:
From the equation , the ratio is 1:1.
Concentration of SO₄²⁻:
Answer
0.0680 mol dm⁻³ (accept values based on candidate's answer in d(i))
0.0680 mol dm⁻³
Background Concept
To find the concentration of an analyte in a titration or precipitation reaction, we use the stoichiometry of the balanced equation. The moles of titrant added at the equivalence point are calculated using . The moles of analyte are then found using the molar ratio from the equation. Finally, concentration is calculated using of the original sample.
Understanding the Question
Using the volume of Ba(OH)₂ from part (d)(i) (e.g., 17.0 cm³), calculate the concentration of SO₄²⁻ in the original 25.00 cm³ lake water sample. The reaction is .
Approach
- Calculate moles of Ba(OH)₂ (or Ba²⁺) added at the equivalence point.
- Use the 1:1 molar ratio to find moles of SO₄²⁻.
- Divide moles of SO₄²⁻ by the volume of the lake water sample (in dm³) to get concentration.
Step-by-Step Reasoning
Step 1: Moles of Ba²⁺
Volume of Ba(OH)₂ = 17.0 cm³ = 0.0170 dm³ (using 17.0 as an example from the graph).
Step 2: Moles of SO₄²⁻
The equation shows 1 mol Ba²⁺ reacts with 1 mol SO₄²⁻.
Step 3: Concentration of SO₄²⁻
Volume of lake water = 25.00 cm³ = 0.02500 dm³.
If the candidate read 16.0 cm³ from the graph: mol. mol dm⁻³. The mark scheme allows error carried forward (ecf) from (d)(i).
Key Takeaways
Always convert volumes to dm³ when using concentration in mol dm⁻³. Remember the 1:1 stoichiometry for Ba²⁺ and SO₄²⁻.
Common Mistakes
- Forgetting to divide volume by 1000 to convert cm³ to dm³.
- Using the total volume in the beaker (e.g., 25 + 17 = 42 cm³) instead of the original sample volume (25.00 cm³) for the concentration calculation.
- Incorrect stoichiometry (e.g., assuming 1:2 ratio because of Ba(OH)₂, but the net ionic equation shows 1:1 for Ba²⁺:SO₄²⁻).
Things to Be Careful About
- Significant figures: The concentration should be given to 3 significant figures (matching the 0.100 mol dm⁻³ and 25.00 cm³ data).
- The mark scheme shows the formula: . Ensure this structure is followed.
The concentration of in a sample of water can also be determined by measuring the mass of precipitate produced when excess is added to the sample.
The student suggests the following method.
step 1 Place of the water sample in a conical flask.
step 2 Add excess to the flask.
step 3 Filter the contents of the flask.
step 4 Dry the residue in a warm oven.
step 5 Measure the mass of residue.
Draw a labelled diagram to describe the arrangement of apparatus that would be needed to complete step 3.
Answer
See
Working
A standard filtration setup consists of:
- A funnel (labelled) placed in a conical flask or beaker (to catch the filtrate).
- Filter paper (labelled) folded and placed inside the funnel.
- The mixture is poured into the funnel lined with filter paper.
Answer
Diagram showing funnel, filter paper, and receiving flask/beaker
Background Concept
Filtration is used to separate an insoluble solid (precipitate) from a liquid. The apparatus consists of a funnel containing filter paper, supported above a receiving vessel (conical flask or beaker). The precipitate (residue) is retained on the filter paper, and the liquid (filtrate) passes through.
Understanding the Question
The question asks for a labelled diagram of the apparatus needed to complete step 3 (filter the contents of the flask). This is the precipitation and filtration method for determining sulfate concentration.
Approach
Draw a simple line diagram showing a funnel with filter paper inside it, positioned above a beaker or conical flask to collect the filtrate. Label the key components.
Step-by-Step Reasoning
Apparatus needed:
- Funnel: A glass or plastic funnel with a long stem.
- Filter paper: Folded into a cone shape and placed inside the funnel.
- Receiving vessel: A conical flask or beaker placed under the funnel to catch the liquid (filtrate).
- Support: The funnel may be supported by a funnel stand (optional but good practice), though the question just asks for the arrangement.
Diagram description:
- Draw a V-shaped funnel with a long vertical stem.
- Inside the funnel, draw a cone shape representing the filter paper.
- Below the funnel, draw a beaker or conical flask to catch the liquid.
- Label 'funnel' and 'filter paper'.
Key Takeaways
Filtration setups are common in quantitative analysis. Always label the funnel and filter paper clearly.
Common Mistakes
- Forgetting to label the components.
- Drawing the filter paper outside the funnel.
- Not including a receiving vessel (beaker/flask) to catch the filtrate.
- Drawing a Büchner funnel or vacuum filtration setup (too complex for this simple gravity filtration).
Things to Be Careful About
The mark scheme specifically looks for 'labelled filter paper in a labelled (filter) funnel'. Ensure both are clearly labelled. A simple line diagram is sufficient; it doesn't need to be artistic.
Suggest a step that the student should add between steps 3 and 4 to improve this method.
Answer
wash the residue with distilled water
wash the residue with distilled water
Background Concept
In gravimetric analysis, after filtration, the precipitate (residue) on the filter paper may still contain traces of the original solution or the excess reagent (Ba(OH)₂). These soluble impurities would add to the mass of the residue if not removed, leading to an overestimation of the analyte concentration. Washing with distilled water removes these soluble impurities.
Understanding the Question
The student's method involves filtering, then drying, then weighing. We need to suggest a step between filtering (step 3) and drying (step 4) to improve the method.
Approach
Identify a standard step in gravimetric analysis that occurs after filtration and before drying to ensure purity of the precipitate.
Step-by-Step Reasoning
After filtering, the precipitate (BaSO₄) is wet and may contain dissolved salts (e.g., excess Ba(OH)₂, or other ions from the lake water). To ensure only BaSO₄ is weighed, the residue must be washed with distilled water (or deionized water) to remove soluble impurities. This is a crucial step for accuracy.
Key Takeaways
Always wash the precipitate in gravimetric analysis to remove soluble impurities.
Common Mistakes
Saying 'rinse with tap water' (tap water contains ions that would contaminate the precipitate). Saying 'dry the residue' (this is already step 4). Saying 'add more Ba(OH)₂' (this is already done in step 2).
Things to Be Careful About
Specify 'distilled water' or 'deionized water', not just 'water'. 'Wash the residue' or 'rinse the precipitate' are acceptable verbs.
Describe what the student can do to ensure that the residue weighed in step 5 is completely dry.
Answer
heat to constant mass
heat to constant mass
Background Concept
In gravimetric analysis, it is essential to ensure that the precipitate is completely dry before weighing, as any remaining water will add to the mass and cause a positive error. The standard technique to ensure complete drying is to heat the residue, cool it, weigh it, and repeat until the mass no longer changes. This is called 'heating to constant mass'.
Understanding the Question
The question asks what the student can do to ensure the residue weighed in step 5 is completely dry.
Approach
Identify the standard laboratory technique for confirming complete drying of a solid.
Step-by-Step Reasoning
Instead of just drying in a warm oven once, the student should heat the residue (e.g., in an oven or using a Bunsen burner if thermally stable, though BaSO₄ is stable), allow it to cool in a desiccator (to prevent reabsorption of moisture), and weigh it. This process is repeated until two consecutive readings are the same (or within a small tolerance, e.g., 0.001 g). This confirms all water has been removed.
Key Takeaways
'Heat to constant mass' is the key phrase for ensuring complete drying in gravimetric analysis.
Common Mistakes
Saying 'leave it to dry overnight' (not rigorous enough). Saying 'use a hot oven' (doesn't confirm it's dry). Saying 'weigh it again' (doesn't specify the condition for knowing it's dry).
Things to Be Careful About
The exact phrase 'heat to constant mass' is the standard mark scheme answer. Mentioning 'cool in a desiccator' is good practice but 'heat to constant mass' is the core requirement.
The mass of residue is used to calculate the concentration of .
Suggest the effect, if any, on the concentration of that is calculated if the residue is not completely dried in step 4.
Explain your answer.
Answer
Effect: The calculated concentration of SO₄²⁻ would be higher than the true value.
Explanation: If the residue is not completely dry, the measured mass will include the mass of water. This makes the mass of the residue (and thus the calculated moles of BaSO₄) greater than it should be. Since moles of SO₄²⁻ are calculated from the mass of BaSO₄, the calculated moles of SO₄²⁻ will be too high, leading to a higher calculated concentration.
higher value; water causes measured mass to be greater
Background Concept
In gravimetric analysis, the concentration of the analyte is calculated from the mass of the precipitate. If the precipitate is not pure (e.g., contains water or other impurities), the measured mass will be incorrect. An overestimation of mass leads to an overestimation of moles, and thus an overestimation of concentration.
Understanding the Question
The question asks for the effect on the calculated concentration of SO₄²⁻ if the residue is not completely dried in step 4, and an explanation.
Approach
- Determine how the error (wet residue) affects the measured mass.
- Trace the effect through the calculation (mass -> moles -> concentration).
Step-by-Step Reasoning
Effect on mass:
If the residue (BaSO₄) is not completely dry, it contains water. The mass measured in step 5 will be . This measured mass is greater than the true mass of BaSO₄.
Effect on moles:
Moles of BaSO₄ are calculated as . Since the mass is too high, the calculated moles of BaSO₄ will be too high.
Effect on concentration:
From the stoichiometry, moles of SO₄²⁻ = moles of BaSO₄. So, calculated moles of SO₄²⁻ will be too high.
Concentration . Since is too high and (25.00 cm³) is unchanged, the calculated concentration of SO₄²⁻ will be higher than the true value.
Key Takeaways
Always consider the direction of the error: extra mass -> extra moles -> extra concentration.
Common Mistakes
Saying 'lower value' (confusing the effect). Saying 'no effect' (ignoring the mass of water). Not explaining the link between mass and concentration.
Things to Be Careful About
The mark scheme requires two parts: the effect ('higher value') and the explanation ('water would cause measured mass / amount of residue to be greater'). Ensure both are present. Don't just say 'mass is higher'; explain that this leads to a higher calculated concentration.