Chemistry 9701/53 — May/June 2025
Cambridge A-Level · Planning, Analysis and Evaluation · worked solutions for every part, with the mark scheme
Topics Planning · Analysis, Conclusions and Evaluation
Grignard reagents have the general formula RMgX, where R is a hydrocarbon group and X is a halogen. The Grignard reagent C₆H₅MgBr is used as an intermediate in the reaction between bromobenzene, C₆H₅Br, and ethanal, CH₃CHO, to prepare 1-phenylethanol, C₆H₅CH(OH)CH₃. An organic solvent, ethoxyethane, is used.
The equations for the three reactions that take place during the preparation are shown.
reaction 1
reaction 2
reaction 3
The preparation involves the following steps.
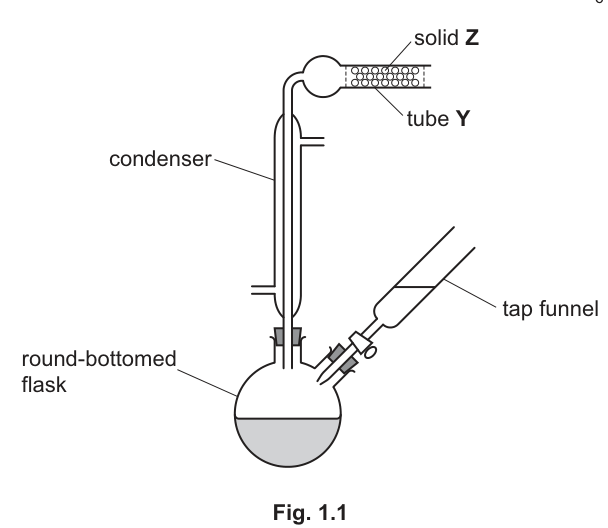
step 1 Set up the apparatus shown in Fig. 1.1 with approximately 1.25 g of Mg powder and of ethoxyethane in the round-bottomed flask.
step 2 Add 0.0500 mol of liquid C₆H₅Br to the round-bottomed flask dropwise using the tap funnel. Leave until reaction 1 is complete.
step 3 Dissolve of CH₃CHO in of ethoxyethane and add this solution to the round-bottomed flask using the tap funnel. Leave until reaction 2 is complete.
step 4 Remove the condenser, tube Y and the tap funnel from the round-bottomed flask.
step 5 Add of dilute hydrochloric acid, , to the round-bottomed flask so that reaction 3 takes place.
step 6 Transfer the contents of the round-bottomed flask to a separating funnel. Allow the liquids to settle so that two layers are formed.
step 7 Open the tap of the separating funnel and run the lower layer into a beaker labelled A. Run the upper layer into a beaker labelled B.
step 8 Allow the ethoxyethane to evaporate from the beaker containing C₆H₅CH(OH)CH₃.
Some relevant data are shown in Table 1.1.
Table 1.1
| substance | density / | boiling point / | hazard |
|---|---|---|---|
| bromobenzene | 1.50 | 156 | flammable, toxic, skin irritant |
| distilled water | 1.00 | 100 | non-hazardous |
| ethoxyethane | 0.714 | 35 | flammable, toxic |
| ethanal | 0.788 | 21 | flammable, eye and respiratory irritant |
| 1-phenylethanol | 1.01 | 204 | flammable, toxic, eye irritant |
Use the information in Table 1.1 to suggest why the following safety precautions are used.
• wearing chemically resistant gloves
• using a fume hood
Answer
- Bromobenzene is a skin irritant, so gloves protect the skin from contact.
- Toxic gas(es) are produced during the preparation, so a fume hood prevents inhalation and accumulation in the laboratory.
See answer above.
Background Concept
When planning any chemical synthesis, especially one involving volatile or reactive organic compounds, identifying hazards is the first step in risk assessment. Table 1.1 provides the hazard information for the key substances: bromobenzene is a skin irritant, toxic, and flammable; ethoxyethane (diethyl ether) is highly flammable and toxic; ethanal is flammable and an irritant; and the product, 1-phenylethanol, is flammable, toxic, and an eye irritant. Grignard reactions also produce hydrogen gas if any moisture is present, which is flammable and explosive in air.
Understanding the Question
The question asks to link specific safety precautions—wearing chemically resistant gloves and using a fume hood—to the hazards listed in the data table. The command word 'suggest' means you must provide a logical reason based on the given information.
Approach
Read the hazard column in Table 1.1 for each relevant substance. Match the physical/chemical hazard (e.g., 'skin irritant', 'toxic') to the function of the safety equipment (gloves prevent skin contact, fume hood removes airborne toxic vapours).
Step-by-Step Reasoning
- Gloves: The table states bromobenzene is a 'skin irritant'. Chemically resistant gloves prevent the liquid from touching and damaging the skin. (1 mark)
- Fume hood: The table notes that bromobenzene and ethoxyethane are 'toxic'. Additionally, the reaction can produce toxic vapours or gases (such as HBr if moisture is present, or volatile organic compounds). A fume hood extracts these toxic gases/vapours, preventing the student from inhaling them and keeping the laboratory atmosphere safe. (1 mark)
Key Takeaways
Safety precautions in organic synthesis are directly dictated by the physical and chemical properties of the reagents and products. Always cross-reference hazard data with appropriate PPE and engineering controls.
Common Mistakes
- Stating 'to protect from fire' for gloves (gloves do not primarily protect against flammability; they protect against chemical contact).
- Vague answers like 'it is dangerous' without specifying the hazard (e.g., toxicity or skin irritation).
Things to Be Careful About
- Ensure you cite a specific hazard from the table (e.g., 'skin irritant' or 'toxic') rather than just saying 'it is hazardous'.
- For the fume hood, mention 'toxic gas' or 'toxic vapour', as these are the primary risks requiring ventilation.
Dry apparatus and reagents are essential for steps 1–3.
Answer
Warm the glassware in an oven (or heat with a heat gun/dry air stream).
Warm in an oven.
Background Concept
Grignard reagents (RMgX) are extremely reactive towards water and protic solvents. They react violently with water to form the corresponding alkane (RH) and magnesium hydroxyhalide (Mg(OH)X):
This destroys the Grignard reagent before it can react with the intended carbonyl compound. Therefore, all glassware and reagents must be rigorously anhydrous (water-free).
Understanding the Question
The question asks for a practical method to dry the glassware shown in Fig. 1.1 (round-bottomed flask, condenser, tap funnel, drying tube) before use. The mark scheme accepts 'warm in an oven'.
Approach
Think of standard laboratory procedures for removing bulk water from glassware prior to air-drying or before use in moisture-sensitive reactions. Heating accelerates evaporation.
Step-by-Step Reasoning
- Glassware that has been washed with water must be dried. The most common and effective method for complex apparatus like this is to place it in a warm oven (typically at 100-110 °C) until all moisture evaporates. Alternatively, a heat gun or a stream of dry air/petroleum ether can be used, but 'warm in an oven' is the standard accepted answer.
Key Takeaways
Moisture is the enemy of Grignard reactions. Always dry glassware thoroughly, typically by warming in an oven, before setting up the reaction.
Common Mistakes
- Suggesting 'leave to air dry' (this takes too long and may not remove all adsorbed water).
- Suggesting 'use a hairdryer' (not standard laboratory practice and may introduce moisture or contaminants).
Things to Be Careful About
- Keep the answer concise. 'Warm in an oven' is sufficient; do not overcomplicate it.
The ethoxyethane contains a small amount of water.
Suggest how the water can be removed from the ethoxyethane before use in steps 1 and 3.
Answer
Fractional distillation.
Fractional distillation.
Background Concept
Ethoxyethane (diethyl ether) is a common solvent for Grignard reactions because it is aprotic and stabilizes the Grignard reagent via coordination to the magnesium. However, it is hygroscopic (absorbs water from the air) and often contains trace water. To remove water from a volatile organic liquid like ethoxyethane (b.p. 35 °C) without losing the solvent, fractional distillation is used. The water (b.p. 100 °C) has a significantly higher boiling point than ethoxyethane, so the ether distils over first, leaving the water behind. Alternatively, drying agents (like anhydrous calcium chloride or molecular sieves) could be used, but fractional distillation is the standard method for purifying bulk solvent.
Understanding the Question
The ethoxyethane contains a small amount of water. The question asks how to remove this water before using the solvent in steps 1 and 3. The command word 'suggest' implies proposing a suitable separation technique.
Approach
Compare the boiling points of ethoxyethane (35 °C) and water (100 °C). Since there is a large difference in boiling points, a distillation-based separation is appropriate. Fractional distillation ensures a clean separation.
Step-by-Step Reasoning
- Ethoxyethane boils at 35 °C, while water boils at 100 °C.
- Fractional distillation will vaporize the ethoxyethane first, which is then condensed and collected, leaving the water in the distillation flask.
- This effectively removes the water contamination from the solvent.
Key Takeaways
When purifying a volatile solvent contaminated with water, fractional distillation is effective if the boiling points differ significantly. For Grignard reactions, the solvent must be strictly anhydrous.
Common Mistakes
- Suggesting 'filtration' (water and ethoxyethane are miscible/liquid-liquid, not solid-liquid).
- Suggesting 'evaporation' (this would lose the ethoxyethane solvent entirely).
Things to Be Careful About
- 'Distillation' alone might be accepted, but 'fractional distillation' is more precise and safer to write given the need for a pure solvent. 'Drying with a drying agent' is also chemically valid but fractional distillation is the mark scheme answer for removing bulk water from a solvent.
Fig. 1.1 shows the apparatus for steps 1–3.
Answer
Draw an arrow pointing inwards at the lower jacket opening of the condenser and label it 'water in'.
Arrow pointing inwards at lower entry, labelled 'water in'.
Background Concept
A Liebig condenser is used to condense vapours back into liquid. To ensure the condenser jacket is completely filled with cooling water and to maximize cooling efficiency (counter-current exchange), cold water must enter at the bottom (lower) outlet and exit at the top (upper) outlet. This prevents air locks and ensures the coldest water meets the coolest vapour at the exit, while the warmest water meets the hottest vapour at the entrance.
Understanding the Question
Fig. 1.1 shows a vertical condenser. The question asks to draw a labelled arrow showing where water enters. The lower opening is the inlet.
Approach
Identify the lower jacket opening on the condenser in Fig. 1.1. Draw an arrow pointing into this opening and add the label 'water in'.
Step-by-Step Reasoning
- The condenser has two side arms (jacket openings).
- Water must enter the bottom arm to fill the jacket against gravity and ensure efficient cooling.
- Draw an arrow pointing into the lower arm.
- Label it 'water in' (or 'cold water in').
Key Takeaways
Always set up condensers with water entering at the bottom and exiting at the top. This is a fundamental practical skill in organic chemistry.
Common Mistakes
- Drawing the arrow at the top opening (this is 'water out').
- Forgetting to label the arrow.
Things to Be Careful About
- The arrow must point inwards (into the condenser), not outwards.
- The label must be clear, e.g., 'water in'.
Answer
To prevent water (from the air) getting into the apparatus.
To prevent water from entering the apparatus.
Background Concept
As established, Grignard reagents react violently with water. The reaction is set up open to the atmosphere at the top (via tube Y) to allow for pressure equalization. However, atmospheric air contains moisture (water vapour). If this moisture enters the reaction flask, it will destroy the Grignard reagent. Tube Y contains a drying agent (solid Z, typically anhydrous calcium chloride or silica gel) which absorbs water vapour from the air before it can enter the reaction mixture.
Understanding the Question
The question asks why 'solid Z' is used in tube Y. Solid Z is a drying agent (desiccant).
Approach
Link the presence of a drying agent in an open system to the need to exclude moisture from the atmosphere, which would otherwise ruin the moisture-sensitive Grignard reaction.
Step-by-Step Reasoning
- The apparatus is open to the air at the top of tube Y.
- Atmospheric air contains water vapour.
- Grignard reagents (C₆H₅MgBr) react with water, destroying the reagent.
- Solid Z (a drying agent/desiccant) absorbs water vapour from the air entering tube Y.
- This prevents water from getting into the reaction flask and reacting with the Grignard reagent.
Key Takeaways
In moisture-sensitive syntheses like Grignard reactions, a drying tube is essential to protect the reagents from atmospheric moisture while maintaining atmospheric pressure.
Common Mistakes
- Saying 'to prevent the reaction from escaping' (the condenser does that; tube Y is open).
- Saying 'to dry the product' (the product is formed later; this is during the Grignard formation and addition).
Things to Be Careful About
- Be precise: 'prevent water from the air entering the apparatus' or 'prevent moisture from entering'. 'To keep it dry' is too vague.
Answer
To avoid pressure build-up in the apparatus.
To prevent pressure build-up.
Background Concept
When a reaction is carried out in a closed or partially closed system, gas evolution or temperature changes can cause pressure to build up. If the system is completely sealed (e.g., with a bung at the end of tube Y), the pressure could increase to the point of blowing the apparatus apart or preventing liquids from being added via the tap funnel.
Understanding the Question
The question asks for one reason why there is no bung at the end of tube Y. Tube Y is open to the atmosphere.
Approach
Consider what happens if the system is sealed. The reaction may produce gas (e.g., H₂ if moisture is present, or volatile ethoxyethane vapour). A sealed system would lead to pressure increase.
Step-by-Step Reasoning
- The reaction involves volatile solvents (ethoxyethane, b.p. 35 °C) which may vaporize.
- If moisture is present, Mg reacts with water to produce hydrogen gas: .
- If the system were sealed with a bung, these gases/vapours would cause pressure to build up.
- This could be dangerous (explosion) or prevent the tap funnel from draining.
- Leaving tube Y open (with the drying agent) allows pressure to equalize with the atmosphere.
Key Takeaways
Always ensure that apparatus for reactions that may produce gas or involve volatile liquids has a pathway for pressure equalization, unless specifically designed as a closed high-pressure system.
Common Mistakes
- Saying 'to let the gas out' (too vague; specify pressure build-up or volatile vapours).
- Saying 'to add more reagents' (reagents are added via the tap funnel, not tube Y).
Things to Be Careful About
- 'Pressure build-up' or 'pressure equalization' is the key phrase. Avoid 'it might explode' unless you explain the pressure mechanism.
In step 1, approximately 1.25 g of Mg powder is needed.
Outline how the student should accurately weigh by difference using a weighing boat so that the exact mass of Mg transferred into the flask is known. Include a results table, with appropriate headings, ready for the student to fill in.
Answer
Method (weighing by difference):
- Weigh the weighing boat containing the Mg powder.
- Transfer the Mg powder into the round-bottomed flask.
- Weigh the weighing boat again (with any residue).
- The difference in mass is the exact mass of Mg transferred.
Results table:
| Measurement / g | |
|---|---|
| Mass of boat + Mg (before transfer) | |
| Mass of boat (+ residue) (after transfer) | |
| Mass of Mg powder (transferred) |
Working
Mass transferred = (Mass of boat + Mg before) - (Mass of boat + residue after)
Answer
See table and method above.
See working.
Background Concept
In quantitative analysis and synthesis, it is often necessary to know the exact mass of a solid transferred, especially when the initial amount is only 'approximately' known (as stated in the question: 'approximately 1.25 g'). 'Weighing by difference' is the standard technique: you weigh the container with the substance, transfer the substance, and then re-weigh the container. The difference gives the exact mass transferred, eliminating the need to weigh the small amount directly on the balance pan (which is prone to error and spillage).
Understanding the Question
The student needs ~1.25 g of Mg. They must outline the procedure for weighing by difference using a weighing boat and provide a results table with appropriate headings and units.
Approach
- Describe the two weighing steps (before and after transfer).
- Create a table with rows for these measurements and a row for the calculated difference.
- Ensure the table has a column header with units (e.g., '/ g' or 'Mass / g').
Step-by-Step Reasoning
- Step 1: Place the weighing boat on the balance and tare (or record mass). Add Mg powder. Weigh the boat + Mg. Record this as 'Mass of boat + Mg (before transfer)'.
- Step 2: Carefully transfer the Mg powder into the round-bottomed flask. Some powder may stick to the boat (residue).
- Step 3: Weigh the boat again. Record this as 'Mass of boat + residue (after transfer)'.
- Calculation: Mass of Mg = (Mass before) - (Mass after).
- Table design: Needs clear headings. A single column with a header like 'Measurement / g' or 'Quantity / g' is sufficient. Rows must logically lead to the final mass.
Key Takeaways
Weighing by difference is a fundamental quantitative technique. Always include units in table headings and ensure the logic of the table (before -> after -> difference) is clear.
Common Mistakes
- Forgetting to include units in the table header (e.g., just 'Mass' instead of 'Mass / g').
- Writing 'Mass of Mg' as a row to be filled in directly (you can't weigh it directly by difference; you calculate it).
- Not describing the 'before' and 'after' weighing steps clearly.
Things to Be Careful About
- The mark scheme specifically looks for the order: 1. boat + Mg weighed, 2. boat weighed after transfer.
- The table must have a column for the values to be filled in (the empty cells in the mark scheme table represent this).
- 'Weighing boat' must be mentioned; do not just say 'weigh the Mg'.
Use the information in Table 1.1 to determine the volume, in , of bromobenzene used in step 2.
[: C₆H₅Br, 156.9]
volume of C₆H₅Br = ..............................
Working
Moles of C₆H₅Br = 0.0500 mol
of C₆H₅Br = 156.9
Density of C₆H₅Br = 1.50 g cm⁻³
Answer
5.23
5.23
Background Concept
This question tests the relationship between moles, mass, molar mass, density, and volume. The formulae are:
where is moles, is mass, is relative molecular mass, is density, and is volume.
Understanding the Question
Given 0.0500 mol of bromobenzene and its density (1.50 g cm⁻³) and (156.9), calculate the volume in cm³.
Approach
- Calculate the mass of bromobenzene using .
- Calculate the volume using .
- Ensure correct significant figures (3 s.f. is appropriate given the data 0.0500 and 1.50).
Step-by-Step Reasoning
- mol
- g
- cm³
- The answer is 5.23 cm³.
Key Takeaways
Always convert to mass first when density is involved. Check units: g / (g cm⁻³) = cm³.
Common Mistakes
- Forgetting to convert moles to mass first.
- Dividing density by mass instead of mass by density.
- Wrong significant figures (5.23 is 3 s.f., which matches the precision of 1.50 and 0.0500).
Things to Be Careful About
- The question asks for the answer in cm³. Ensure the final unit is correct.
- Do not round intermediate values too early. 7.845 / 1.50 = 5.23 exactly.
The bromobenzene is added dropwise in step 2.
Suggest one reason why the bromobenzene is not added all at once.
Answer
To prevent the reaction becoming too violent (or to control the rate of reaction / prevent boiling over / prevent loss of volatile ethoxyethane).
To prevent the reaction becoming too violent.
Background Concept
The formation of a Grignard reagent (Mg + RBr → RMgBr) is an exothermic reaction. If the organic halide (bromobenzene) is added all at once, the rapid release of heat can cause the reaction to become uncontrollable (runaway reaction). This can lead to:
- Boiling over of the volatile solvent (ethoxyethane, b.p. 35 °C).
- Decomposition of reagents.
- Potential safety hazards (fire, explosion if H₂ is generated from moisture).
Adding dropwise allows the heat to be dissipated gradually, maintaining a gentle reflux.
Understanding the Question
Why is bromobenzene added dropwise in step 2? The command word 'suggest' asks for a reason related to reaction control or safety.
Approach
Link the exothermic nature of Grignard formation to the need for controlled addition to manage heat release.
Step-by-Step Reasoning
- The reaction between Mg and bromobenzene is exothermic.
- Adding all the bromobenzene at once would release a large amount of heat rapidly.
- This could make the reaction too violent, causing the volatile ethoxyethane to boil over or the mixture to splatter.
- Adding dropwise controls the rate of reaction and heat evolution.
Key Takeaways
Exothermic reactions, especially those involving volatile solvents, should be controlled by slow addition of reagents to prevent runaway reactions.
Common Mistakes
- Saying 'to save the reagent' (not a valid chemical reason).
- Saying 'to make sure it reacts completely' (adding slowly doesn't affect completeness, only rate).
Things to Be Careful About
- Use terms like 'too violent', 'control rate', or 'prevent boiling over'. 'Exothermic' is a good keyword to include if you explain the heat release.
Suggest why a measuring cylinder is a suitable piece of apparatus to measure of hydrochloric acid in step 5.
Answer
Hydrochloric acid is in excess, so high precision (accuracy) is not required.
Hydrochloric acid is in excess.
Background Concept
In step 5, dilute HCl is added to hydrolyze the Grignard adduct (C₆H₅CH(CH₃)OMgBr) to the final alcohol (C₆H₅CH(OH)CH₃). The reaction requires H⁺ ions. The amount of HCl needed is stoichiometrically small compared to the volume added (40 cm³). Since HCl is added in large excess to ensure complete hydrolysis, the exact volume does not affect the theoretical yield of the product. Therefore, a measuring cylinder (which has lower precision, typically ±0.5-1 cm³) is sufficient; a volumetric pipette or burette (which have higher precision) is unnecessary.
Understanding the Question
Why is a measuring cylinder suitable for measuring 40 cm³ of HCl in step 5? The command word 'suggest' asks for a justification based on the role of HCl in the reaction.
Approach
Consider the stoichiometry of step 3 (hydrolysis). Is HCl the limiting reagent? No, it's added in excess. Therefore, precise measurement is not critical.
Step-by-Step Reasoning
- Step 5 is the acid hydrolysis of the magnesium alkoxide.
- The reaction requires H⁺, but 40 cm³ of dilute HCl is a large volume compared to the amount needed.
- HCl is in excess.
- Since it is in excess, the exact volume does not affect the yield of 1-phenylethanol.
- A measuring cylinder is less precise than a burette or pipette, but its precision is adequate for an excess reagent.
Key Takeaways
The choice of measuring apparatus (measuring cylinder vs. volumetric pipette) depends on whether the reagent is limiting or in excess. Excess reagents do not require high-precision measurement.
Common Mistakes
- Saying 'it is easier to use' (not a scientific justification).
- Saying '40 cm³ is too large for a pipette' (volumetric pipettes can be 50 cm³, and measuring cylinders are chosen for precision, not just size).
Things to Be Careful About
- The key phrase is 'in excess'. Without this, the answer is incomplete.
The separating funnel used in steps 6 and 7 is shown in Fig. 1.2. The final product, 1-phenylethanol, is in the ethoxyethane layer.
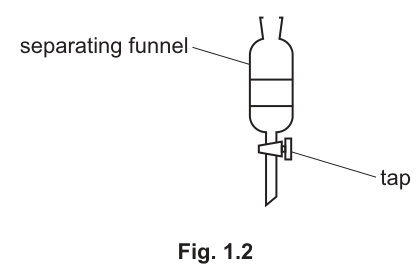
State whether beaker A or beaker B contains the layer with 1-phenylethanol after step 7.
Explain your answer using the information given in Table 1.1.
beaker .................
explanation
Answer
beaker B
explanation: Ethoxyethane (density 0.714 g cm⁻³) is less dense than the aqueous layer (density ~1.00 g cm⁻³), so the ethoxyethane layer floats on top. The upper layer is drained into beaker B.
Beaker B; ethoxyethane is less dense than water.
Background Concept
In step 6, the reaction mixture is transferred to a separating funnel. The mixture contains:
- An organic layer: ethoxyethane (solvent) + 1-phenylethanol (product).
- An aqueous layer: water + Mg²⁺ + Br⁻ + Cl⁻ (from the added HCl and reaction byproducts).
These two liquids are immiscible. The layer order depends on their densities. From Table 1.1: - Ethoxyethane density = 0.714 g cm⁻³
- 1-Phenylethanol density = 1.01 g cm⁻³ (but it's dissolved in ethoxyethane, so the organic layer density is dominated by the solvent, ~0.714 g cm⁻³, or slightly higher, but still < 1.00)
- Distilled water / aqueous layer density ≈ 1.00 g cm⁻³ (or slightly higher due to dissolved salts).
Since the organic layer (ethoxyethane-based) is less dense than the aqueous layer, it will form the upper layer.
Understanding the Question
The final product (1-phenylethanol) is in the ethoxyethane layer. The question asks whether beaker A (lower layer) or beaker B (upper layer) contains the product, and to explain using Table 1.1 data.
Approach
- Identify which layer contains the product (organic layer = ethoxyethane layer).
- Compare the density of the ethoxyethane layer with the aqueous layer using Table 1.1.
- Determine which layer is on top.
- Match the top layer to the correct beaker (upper layer goes into beaker B, lower into A, based on standard separating funnel operation where the lower layer is drained from the tap into the bottom beaker).
Step-by-Step Reasoning
- Product is in ethoxyethane layer (organic layer).
- Density of ethoxyethane = 0.714 g cm⁻³.
- Density of aqueous layer (water + salts) ≈ 1.00 g cm⁻³ (or > 0.714).
- Ethoxyethane is less dense than water, so the organic layer is the upper layer.
- In a separating funnel, the lower layer is drained first into beaker A. The upper layer remains and is poured out from the top into beaker B.
- Therefore, beaker B contains the ethoxyethane layer with 1-phenylethanol.
Key Takeaways
Always compare densities to determine layer order in liquid-liquid extraction. Lower density = upper layer. The lower layer is drained via the tap; the upper layer is poured from the top.
Common Mistakes
- Assuming the organic layer is always on the bottom (this is true for halogenated solvents like dichloromethane, but not for ethoxyethane or hexane).
- Forgetting to reference the density values from the table in the explanation.
Things to Be Careful About
- The explanation must explicitly state 'ethoxyethane is less dense than water' (or the aqueous layer) and reference the densities or the comparison.
- Beaker A is the lower layer (drained first), Beaker B is the upper layer (poured out). Ensure you match this correctly.
The overall reaction can be represented as shown in Fig. 1.3.
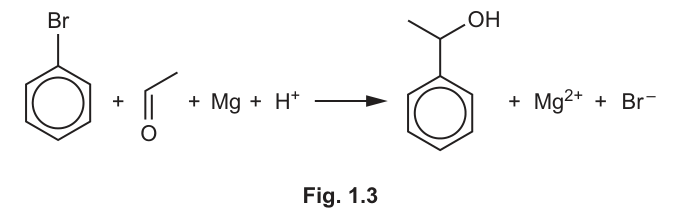
At the end of step 8, 2.17 g of 1-phenylethanol is obtained.
Determine whether bromobenzene or ethanal is the limiting reagent and hence calculate the percentage yield of 1-phenylethanol.
Show your working.
[: C₆H₅CH(OH)CH₃, 122.0]
percentage yield of C₆H₅CH(OH)CH₃ = .............................. %
Working
Moles of reactants:
Limiting reagent:
The reaction ratio is 1:1. Since , bromobenzene is the limiting reagent.
Theoretical yield:
Percentage yield:
Answer
35.6
35.6
Background Concept
Percentage yield is a measure of the efficiency of a reaction:
To find the theoretical yield, you must first identify the limiting reagent. The limiting reagent is the reactant that is completely consumed first, determining the maximum amount of product that can be formed. This requires calculating the moles of each reactant and comparing them using the stoichiometric ratio from the balanced equation.
Understanding the Question
Given:
- mol
- Volume of CH₃CHO = 3.00 cm³, density = 0.788 g cm⁻³, = 44.0 (calculated as 212 + 41 + 16 = 44.0)
- Actual yield of 1-phenylethanol = 2.17 g, = 122.0
Determine the limiting reagent and calculate the percentage yield.
Approach
- Calculate moles of ethanal using volume, density, and .
- Compare moles of bromobenzene and ethanal using the 1:1 stoichiometry.
- Identify the limiting reagent (the one with fewer moles).
- Calculate theoretical mass of product using moles of limiting reagent and of product.
- Calculate percentage yield.
Step-by-Step Reasoning
- Moles of bromobenzene: Given as 0.0500 mol.
- Moles of ethanal:
- Mass = volume × density = g.
- Moles = mass / = mol ≈ 0.0537 mol.
- Limiting reagent: The overall reaction (and the individual steps) shows a 1:1 molar ratio between bromobenzene and ethanal. Since 0.0500 mol < 0.0537 mol, bromobenzene is the limiting reagent. Ethanal is in excess.
- Theoretical yield:
- Moles of product = moles of limiting reagent = 0.0500 mol.
- Theoretical mass = g.
- Percentage yield:
- .
Key Takeaways
Always calculate moles for both reactants to find the limiting reagent. Use the limiting reagent to calculate the theoretical yield. Percentage yield is a direct comparison of actual vs. theoretical.
Common Mistakes
- Using ethanal as the limiting reagent because 3.00 < 0.0500 (comparing volume to moles is invalid).
- Forgetting to calculate the mass of ethanal from its volume and density first.
- Using the wrong values (e.g., using 156.9 for the product instead of 122.0).
- Rounding too early (keep 0.053727... in the calculator until the final step, though here it doesn't affect the 3 s.f. answer much).
Things to Be Careful About
- Significant figures: The data has 3 s.f. (3.00, 0.788, 2.17, 122.0). The answer should be given to 3 s.f. (35.6%).
- Ensure the of ethanal is correct: C₂H₄O = 24 + 4 + 16 = 44.0.
- The question asks to 'determine whether bromobenzene or ethanal is the limiting reagent', so you must state this clearly in your working.
Answer
The product contains unreacted ethanal (as an impurity), which has a C=O bond.
The product contains unreacted ethanal.
Background Concept
Infrared (IR) spectroscopy identifies functional groups based on their characteristic absorption frequencies. A C=O (carbonyl) stretch typically appears around 1700-1750 cm⁻¹. The desired product, 1-phenylethanol (C₆H₅CH(OH)CH₃), is an alcohol and contains an O-H bond (broad peak ~3200-3600 cm⁻¹) and C-O bond, but no C=O bond. Therefore, a pure sample of 1-phenylethanol should not show a C=O peak.
If a C=O peak is detected in the product's IR spectrum, it indicates the presence of a carbonyl-containing impurity. In this synthesis, the reactants are bromobenzene (no C=O), Mg (no C=O), and ethanal (CH₃CHO, which has a C=O bond). If the reaction between the Grignard reagent and ethanal is not complete, or if purification (evaporation of ethoxyethane) does not remove all the ethanal, the final product will be contaminated with unreacted ethanal.
Understanding the Question
The IR spectrum of the final product (after evaporation of solvent) shows a C=O peak. The question asks why. The command word 'suggest' implies providing a plausible reason based on the reaction scheme and purification steps.
Approach
- Identify which substances in the reaction scheme contain a C=O bond.
- Consider the purification steps (evaporation of ethoxyethane). Which C=O-containing substance would remain?
- Conclude that unreacted ethanal is the impurity.
Step-by-Step Reasoning
- The product 1-phenylethanol has no C=O bond.
- Ethanal (CH₃CHO) has a C=O bond.
- Step 8 involves evaporating ethoxyethane (b.p. 35 °C). Ethanal has a boiling point of 21 °C, so it would also evaporate, but if it is bound or if the evaporation is incomplete, or if there is azeotrope formation, some may remain. More simply, the question implies the product is impure.
- The most logical source of the C=O peak is unreacted ethanal that was not fully removed during purification or was present in excess and not separated during the extraction (though extraction should remove it, incomplete reaction or washing issues could leave it).
- The mark scheme simply accepts 'the product contains unreacted ethanal'.
Key Takeaways
If an IR spectrum shows a peak for a functional group not present in the target molecule, the product is impure. Identify the reactant or intermediate that contains that functional group.
Common Mistakes
- Saying 'the product has a C=O bond' (1-phenylethanol is an alcohol, not a ketone/aldehyde).
- Saying 'ethoxyethane has a C=O bond' (ethoxyethane is an ether, C-O-C, no carbonyl).
- Not specifying 'unreacted ethanal' or 'impurity'.
Things to Be Careful About
- Be specific: 'unreacted ethanal' or 'ethanal impurity'.
- Do not suggest that the product itself has a C=O bond; the question states the spectrum 'detected the presence', implying it's an unexpected finding (impurity).
An experiment is carried out to determine the rate constant, , for the hydrolysis of ethyl ethanoate, , using a hydrochloric acid, , catalyst.
The equation for the reaction is shown.
The rate equation for this reaction is shown.
The progress of the reaction is followed by determining how the concentration of acid changes with time.
A portion of the reaction mixture is removed every 5 minutes and titrated with sodium hydroxide, . A final titration is carried out after 180 minutes.
A student carries out the following steps.
step 1 Add of iced water to seven separate small conical flasks. Add a few drops of phenolphthalein indicator to each flask. Phenolphthalein is pink in alkaline conditions and colourless in acidic conditions.
step 2 Use a measuring cylinder to transfer of into a large conical flask.
step 3 Add of to the large conical flask and swirl the flask to mix the contents. Start a stopwatch.
step 4 Transfer of reaction mixture to one of the small conical flasks containing the iced water and indicator. Record the time. Shake the small flask.
step 5 Carry out a single titration of the mixture in the small conical flask using .
step 6 Repeat steps 4 and 5 at the times shown in Table 2.1 using a different small conical flask for each titration.
Give two reasons that explain why the use of iced water in step 4 decreases the rate of reaction.
reason 1
reason 2
Answer
- The solution becomes more dilute (lower concentration of reactants/acid catalyst).
- The temperature is reduced (iced water is cold).
Background Concept
The rate of a chemical reaction depends on the frequency of successful collisions between reactant particles. Two key factors that influence this are concentration and temperature. Increasing concentration increases the number of particles per unit volume, leading to more frequent collisions. Increasing temperature increases the average kinetic energy of the particles, meaning a greater proportion of them possess energy greater than or equal to the activation energy, and they also move faster, increasing collision frequency.
Understanding the Question
The question asks why adding iced water in step 4 (when removing a sample for titration) decreases the rate of reaction. We need to identify the two physical changes that occur when a sample is added to iced water.
Approach
Consider what iced water does to the reaction mixture: it adds solvent (water) and it is cold. Relate these two properties to the collision theory factors of concentration and temperature.
Step-by-Step Reasoning
- Dilution: Adding 70 cm³ of water to the 10 cm³ sample significantly dilutes the mixture. A lower concentration of ethyl ethanoate and H⁺ ions means fewer particles per unit volume, reducing the frequency of collisions and thus decreasing the rate.
- Temperature reduction: Iced water is at a low temperature (around 0-4 °C). Transferring the warm reaction mixture into iced water rapidly cools it down. Lower temperature means particles have less kinetic energy, resulting in fewer collisions with energy ≥ activation energy, decreasing the rate.
Key Takeaways
Quenching a reaction often involves dilution and cooling to slow it down to a negligible rate, allowing accurate measurement of the amount of reactant/product at a specific time.
Common Mistakes
- Saying "the water stops the reaction" (it doesn't stop it completely, just slows it down significantly).
- Confusing the effect of dilution with the effect of temperature.
Things to Be Careful About
Ensure both reasons are distinct: one must relate to concentration/dilution, the other to temperature.
Answer
Appearance of a (permanent) pink colour.
Background Concept
Phenolphthalein is a common acid-base indicator. It is colourless in acidic solutions (pH < 8.2) and pink/magenta in alkaline solutions (pH > 10.0). In a titration of an acid with a strong base like NaOH, the solution starts acidic (colourless). As NaOH is added, it neutralises the acid. At the end-point, a slight excess of NaOH makes the solution alkaline, causing the indicator to turn pink.
Understanding the Question
The question asks for the specific visual observation that signals the end-point of the titrations being carried out. The indicator used is phenolphthalein.
Approach
Recall the colour change of phenolphthalein in the context of titrating an acid with a base.
Step-by-Step Reasoning
The titration involves adding NaOH(aq) to the acidic sample. Initially, the solution is acidic and phenolphthalein is colourless. At the end-point, the acid is completely neutralised, and the first permanent excess of OH⁻ ions causes the phenolphthalein to turn pink. The word 'permanent' is important to distinguish from a temporary colour change that might fade if the CO₂ in the air dissolves and re-acidifies the solution.
Key Takeaways
Always include 'permanent' when describing indicator end-points in titrations to show understanding that a fleeting colour change is not the true end-point.
Common Mistakes
- Saying 'the solution turns pink' without 'permanent'.
- Saying 'colourless to pink' (the question asks for the observation used to determine the end-point, which is the appearance of the pink colour).
Things to Be Careful About
Ensure the colour change is described from the perspective of reaching the end-point (appearance of pink), not just the overall change.
The results of the experiment are shown in Table 2.1.
is the titre at a given time, .
is the final titre at when the reaction is assumed to be complete.
Table 2.1
| 1 | 2 | 3 | 4 |
|---|---|---|---|
| time, / min | titre, | ||
| 0 | 12.00 | ||
| 5 | 16.40 | ||
| 10 | 22.15 | ||
| 15 | 23.45 | ||
| 20 | 26.30 | ||
| 25 | 28.70 | ||
| 180 | 45.70 |
Complete Table 2.1.
Give your answers in column 3 to two decimal places and your answers in column 4 to four significant figures.
Working
Column 3:
Column 4:
| Time / min | Titre, / cm³ | / cm³ | |
|---|---|---|---|
| 0 | 12.00 | 33.70 | 1.528 |
| 5 | 16.40 | 29.30 | 1.467 |
| 10 | 22.15 | 23.55 | 1.372 |
| 15 | 23.45 | 22.25 | 1.347 |
| 20 | 26.30 | 19.40 | 1.288 |
| 25 | 28.70 | 17.00 | 1.230 |
| 180 | 45.70 | — | — |
Answer
See completed table above.
Background Concept
In a first-order reaction with respect to a reactant, the concentration of that reactant decreases exponentially with time. Taking the logarithm of the concentration gives a linear relationship: . In this experiment, the amount of unreacted ester is proportional to , where is the volume of NaOH used to neutralise the acid at time , and is the volume at completion. Thus, plotting against time should give a straight line.
Understanding the Question
The question asks to complete a table by calculating and its logarithm for each time point. is given as 45.70 cm³ (the titre at 180 min). Answers in column 3 must be to two decimal places, and column 4 to four significant figures.
Approach
Subtract each from 45.70 to get column 3. Then use a calculator to find the base-10 logarithm of each column 3 value, rounding to 4 sig figs. Note that at , , so the difference is 0, and is undefined.
Step-by-Step Reasoning
- : . (4 s.f.)
- : . (4 s.f.)
- : . (4 s.f.)
- : . (4 s.f.)
- : . (4 s.f.)
- : . (4 s.f.)
- : . is undefined, so leave blank.
Key Takeaways
When calculating logarithms, the number of significant figures in the result must match the number of significant figures in the original number. Here, 4 s.f. is required.
Common Mistakes
- Forgetting to round to 4 significant figures for the log column.
- Attempting to calculate and getting an error or writing .
Things to Be Careful About
Ensure is correctly identified as 45.70 from the row at min.
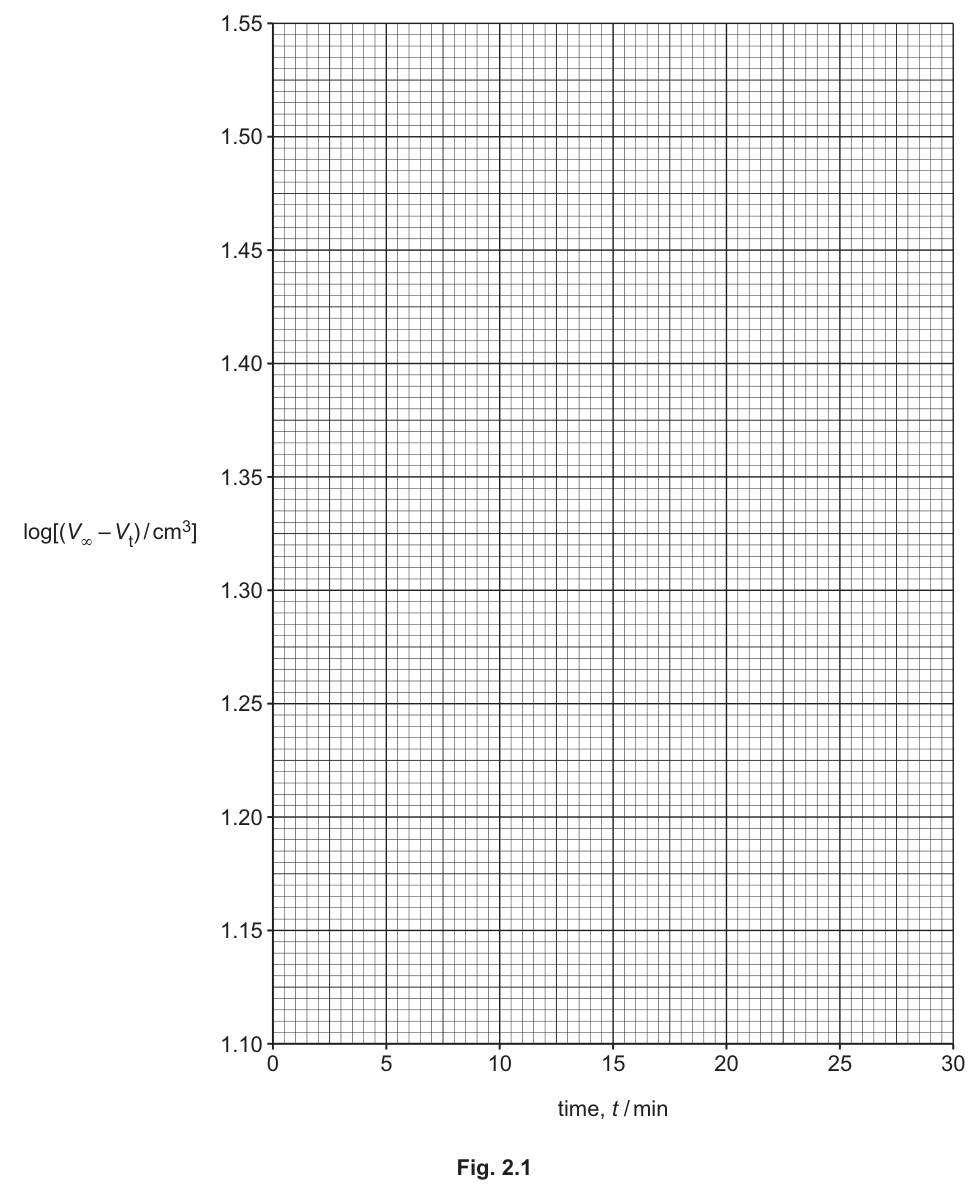
Plot a graph on the grid in Fig. 2.1 to show the relationship between and time, . Use a cross (×) to plot each data point.
Draw a straight line of best fit.
Answer
Working
Plot the following coordinates on the grid in Fig. 2.1:
(0, 1.528), (5, 1.467), (10, 1.372), (15, 1.347), (20, 1.288), (25, 1.230).
Draw a straight line of best fit through the points, excluding the anomalous point at (10, 1.372).
Answer
See diagram for plotted points and line of best fit.
Background Concept
Graphical analysis is used to determine the rate constant from experimental data. For a first-order reaction, a plot of versus time is linear. The gradient of this line is related to the rate constant .
Understanding the Question
The question asks to plot the data from the completed table on the provided grid and draw a straight line of best fit.
Approach
Use the coordinates from column 1 (time) and column 4 (log value). Plot each point accurately using a cross (×). Then draw a straight line that passes as close as possible to the majority of the points, with an equal number of points on either side of the line.
Step-by-Step Reasoning
- Plot (0, 1.528): x=0, y=1.528
- Plot (5, 1.467): x=5, y=1.467
- Plot (10, 1.372): x=10, y=1.372 (this will be identified as anomalous later)
- Plot (15, 1.347): x=15, y=1.347
- Plot (20, 1.288): x=20, y=1.288
- Plot (25, 1.230): x=25, y=1.230
Draw a straight line of best fit. The line should pass through or near (0, 1.528), (5, 1.467), (15, 1.347), (20, 1.288), and (25, 1.230). The point at (10, 1.372) is noticeably below this line and will be circled as anomalous in the next part.
Key Takeaways
When drawing a line of best fit, do not join the points with a straight line. The line should represent the overall trend, and anomalous points should be ignored when drawing it.
Common Mistakes
- Joining the points with a straight line instead of drawing a line of best fit.
- Plotting points inaccurately (e.g., misreading the y-axis scale).
Things to Be Careful About
The y-axis ranges from 1.10 to 1.55, with major markings every 0.05 and minor markings every 0.01. Ensure points are plotted precisely to these minor divisions.
Circle the one point on the graph that you consider to be most anomalous.
Suggest one reason to explain the anomalous point you have circled.
Assume no error was made in the experimental value of the titre.
Answer
Working
The anomalous point is at min, .
Circle this point on the graph.
Reason: The actual time at which the sample was removed was greater than 10 minutes (e.g., delayed in transferring the sample).
Answer
Point circled: (10, 1.372)
Reason: The actual time of the sample removed was higher than the recorded time (10 min).
Background Concept
An anomalous point (or outlier) is a data point that does not fit the general trend of the other data. It can be caused by random errors in measurement or technique. Understanding the experimental procedure helps in diagnosing the cause of such errors.
Understanding the Question
The question asks to identify the most anomalous point on the graph and suggest a reason for it, assuming no error was made in the titre reading itself.
Approach
Look at the plotted points and the line of best fit. The point at min (y = 1.372) is noticeably below the line of best fit compared to the points at and . If the titre is higher than it should be at , then is smaller, and its logarithm is smaller (lower on the y-axis). A higher titre means more acid was present, which means more ester had hydrolysed. This would happen if the reaction had proceeded for longer than the recorded time of 10 minutes.
Step-by-Step Reasoning
- Identify the anomalous point: Visually, the point at (10, 1.372) is the furthest from the line of best fit drawn through the other points. Circle it.
- Explain the reason: The titre at is 22.15 cm³, which is higher than expected. A higher titre means more NaOH was needed to neutralise the acid, implying more CH₃COOH was present. This means more ester had reacted than expected for min. Since the reaction was not quenched instantly or the timing was delayed, the actual time the sample was removed was greater than 10 minutes (e.g., 12 or 13 minutes). The reaction continued during the delay, producing more acid.
Key Takeaways
When explaining an anomalous point, relate it to the specific experimental steps. If a titre is too high for a given time, it usually means the reaction proceeded for longer than recorded.
Common Mistakes
- Saying 'human error' or 'mistake in reading the burette' (the question says assume no error in the titre value).
- Suggesting the reaction was faster (which would be a systematic error, not explaining a single anomalous point).
Things to Be Careful About
Ensure the reason directly explains why the point is below the line (i.e., why the titre was too high / log value too low).
Determine the gradient of your line of best fit in Fig. 2.1.
State the coordinates of both points you use in your calculation. These must be selected from your line of best fit.
Give the gradient to three significant figures.
coordinates 1 .............................................. coordinates 2 ..............................................
gradient = ..............................
Working
Select two points on the line of best fit (not data points):
Coordinates 1: (0, 1.528)
Coordinates 2: (25, 1.230)
Gradient
Answer
coordinates 1: (0, 1.528)
coordinates 2: (25, 1.230)
gradient = -0.0119 min⁻¹
Background Concept
The gradient of a straight line is calculated as the change in the y-coordinate divided by the change in the x-coordinate (). For a line of best fit, you should use coordinates that lie on the line itself, not necessarily the original data points, to get the most accurate gradient.
Understanding the Question
The question asks to determine the gradient of the line of best fit from the graph in part (c)(ii), stating the coordinates used.
Approach
Choose two points on the line of best fit that are far apart to minimise percentage error. Read their coordinates from the axes. Calculate .
Step-by-Step Reasoning
- Select points: Use the y-intercept (0, 1.528) and the point at (25, 1.230), as both lie on or very close to the line of best fit.
- Calculate gradient:
Gradient - Round to 3 significant figures: -0.0119 min⁻¹.
Key Takeaways
Always use points on the line of best fit, not data points, when calculating the gradient. Using points far apart reduces the effect of reading errors.
Common Mistakes
- Using data points that are not on the line of best fit (especially the anomalous point).
- Calculating the gradient as (inverting the fraction).
- Not rounding to 3 significant figures.
Things to Be Careful About
The coordinates must be read accurately from the axes. The y-axis has minor divisions of 0.01, so read to 3 decimal places. The x-axis has minor divisions of 1 min.
The equation of the straight line plotted in Fig. 2.1 is shown.
Use the gradient determined in (c)(iv) to calculate a value for in .
[If you were unable to determine an answer to (c)(iv), then use the value for the gradient. This is not the correct answer.]
..............................
Working
Given equation:
Gradient (with in minutes)
Using gradient from (c)(iv) = :
Convert to s⁻¹:
Answer
Background Concept
For a first-order reaction, the integrated rate law in logarithmic form is . Comparing this to the equation of a straight line , the gradient . If time is in minutes, the gradient is in min⁻¹, and calculated directly will be in min⁻¹. To convert to s⁻¹, divide by 60.
Understanding the Question
The question provides the equation relating the gradient to and asks to calculate in s⁻¹ using the gradient determined in part (c)(iv).
Approach
Rearrange the given equation to solve for . Substitute the gradient value. Remember to convert the time unit from minutes to seconds.
Step-by-Step Reasoning
- Relate gradient to : From , the gradient is .
- Rearrange: .
- Substitute gradient: .
- Convert units: Since , .
- Round to 3 significant figures: .
(Note: If using the fallback gradient of , .)
Key Takeaways
Always check the units of the gradient and ensure the final rate constant is in the required units. The factor 2.303 comes from , converting between natural logarithm and base-10 logarithm.
Common Mistakes
- Forgetting to convert from min⁻¹ to s⁻¹ (dividing by 60).
- Using the wrong sign for the gradient (forgetting that must be positive).
- Not using enough significant figures in intermediate steps.
Things to Be Careful About
The equation given uses base-10 logarithm. The factor 2.303 is . Ensure the gradient used is in the correct units (min⁻¹) before applying the formula.
Use your graph in Fig. 2.1 to state whether you consider the results to be reliable. Give a reason for your answer.
Answer
Not reliable.
Reason: There is an anomalous point in the results.
Background Concept
Reliable results are those that are consistent and reproducible. The presence of an anomalous point (outlier) suggests that there was an error in that specific measurement or procedure, which reduces the overall reliability of the data set unless it can be explained and accounted for.
Understanding the Question
The question asks to state whether the results are reliable and give a reason.
Approach
Refer back to part (c)(iii) where an anomalous point was identified. The presence of this point indicates a lack of reliability.
Step-by-Step Reasoning
- State reliability: The results are not reliable.
- Give reason: There is an anomalous point (at min) that does not fit the line of best fit, indicating an error in that measurement or procedure.
Key Takeaways
An anomalous point automatically makes a data set less reliable because it introduces uncertainty into the determination of the trend (line of best fit).
Common Mistakes
- Saying 'reliable' because most points fit the line.
- Giving a vague reason like 'there was an error' without specifying 'anomalous point'.
Things to Be Careful About
Ensure the reason directly links to the observation made in the previous part.
increases with temperature.
A second experiment is carried out at a higher temperature.
Sketch a suggested line of best fit on Fig. 2.1 for the second experiment.
Answer
Sketch a straight line on Fig. 2.1 that:
- Starts at the same y-intercept as the original line (same initial concentration).
- Has a more negative gradient (steeper downwards slope) than the original line.
Answer
See diagram.
Background Concept
The rate constant increases with temperature (as described by the Arrhenius equation). For a first-order reaction, the gradient of the plot of against time is . A larger means a more negative gradient (steeper line). The initial concentration of the reactant is the same in both experiments, so the y-intercept () must be the same.
Understanding the Question
The question asks to sketch a line of best fit for a second experiment carried out at a higher temperature on the same graph.
Approach
Determine how a higher temperature affects the rate constant , and thus the gradient of the line. Determine how it affects the initial concentration, and thus the y-intercept.
Step-by-Step Reasoning
- Effect on gradient: Higher temperature → higher → more negative gradient (steeper line falling downwards).
- Effect on intercept: The initial amount of ester and acid is the same, so the initial titre difference is the same. Thus, the y-intercept at is the same.
- Sketch: Draw a straight line starting at the same point (0, 1.528) but falling more steeply than the original line.
Key Takeaways
When predicting the effect of changing conditions on a kinetic graph, consider both the gradient (rate) and the intercept (initial conditions).
Common Mistakes
- Changing the y-intercept (forgetting that initial concentration is unchanged).
- Drawing a line with a less negative gradient (confusing the effect of temperature on rate).
- Drawing a curve instead of a straight line (the plot is already logarithmic, so it should remain linear).
Things to Be Careful About
Ensure the sketched line is clearly distinguishable from the original line and that it starts at the correct y-intercept.