Chemistry 9701/52 — May/June 2025
Cambridge A-Level · Planning, Analysis and Evaluation · worked solutions for every part, with the mark scheme
Topics Analysis, Conclusions and Evaluation · Planning
Activated carbon is a form of carbon with the ability to adsorb solutes from solutions. The adsorption of ethanedioic acid molecules, , from dilute ethanedioic acid, , onto the surface of activated carbon is studied in a series of experiments.
Before beginning the experiment, of , solution X, is made. The activated carbon is placed in an oven at for three hours.
The experimental procedure involves the following steps.
- step 1 Prepare of from solution X.
- step 2 Transfer of the into a conical flask.
- step 3 Add of activated carbon to the conical flask and start a stopwatch.
- step 4 Shake the flask and immediately remove a sample from the flask. Determine the mass of non-adsorbed in the sample using chromatography.
- step 5 Repeat step 4 at suitable time intervals until there is no further change in the mass of non-adsorbed in the sample.
Solid ethanedioic acid has the formula .
Working
Answer
8.76 g
Background Concept
To prepare a standard solution of a specific molar concentration, the required number of moles of solute is determined by the formula:
where is the concentration in and is the volume in . When weighing out a hydrated crystalline substance, the water of crystallisation must be included in the relative formula mass () because the water molecules contribute to the total mass of the solid weighed.
The mass of calculated in (a)(i) is placed into a beaker.
Describe the steps taken to prepare of .
Give the name and capacity of any apparatus used.
Write your answer using a series of numbered steps.
Answer
- Add a small volume of distilled water (e.g. ) to the solid in the beaker and stir with a glass rod until completely dissolved.
- Transfer the solution into a volumetric flask using a filter funnel, and rinse the beaker, stirring rod, and funnel several times with distilled water, transferring all washings into the volumetric flask.
- Make the solution up to the mark with distilled water (using a dropping pipette near the mark until the bottom of the meniscus touches the calibration line), stopper the flask, and invert it several times to ensure thorough mixing.
- Dissolve solid in beaker using distilled water. 2. Transfer to 500 cm3 volumetric flask and rinse beaker/rod with distilled water into the flask. 3. Top up to the mark with distilled water, stopper and invert to mix.
Background Concept
Preparing a standard solution requires quantitative transfer to guarantee that every milligram of weighed solid ends up inside the final solution volume, and uniform mixing so that concentration is identical throughout.
is corrosive. Other than wearing eye protection and a lab coat, state one safety precaution that should be taken when using .
Answer
Wear (chemically resistant / nitrile) gloves.
Wear chemically resistant gloves
Background Concept
A corrosive substance attacks and destroys living tissue such as skin on contact. Eye protection shields the eyes and a lab coat protects clothing/arms, but handling corrosive solids or solutions directly poses a high risk of contact with the hands.
Answer
To remove (adsorbed) water / moisture from the surface and pores of the activated carbon.
To remove water from the activated carbon
Background Concept
Activated carbon has an extremely high surface area with many micro- and mesopores. In ambient air, it readily adsorbs moisture from the atmosphere onto these sites. Heating at (above the boiling point of water) desorbs and evaporates this water, ensuring that all active adsorption sites are free and available.
In step 1, solution X is diluted to a concentration of .
Calculate the volume of solution X needed to make of .
Working
Answer
4.0 cm^3
Background Concept
When diluting a solution, the amount of solute in moles remains constant:
Rearranging for the initial volume :
Answer
Burette (or volumetric pipette)
burette
Background Concept
In analytical quantitative work, transferring a precise volume given to three significant figures () requires volumetric glassware designed for precision delivery, such as a burette (graduated to ) or a class A volumetric pipette. Measuring cylinders are not sufficiently precise.
Answer
To ensure the solution is uniformly mixed (homogeneous) so that the sample is representative of the whole mixture.
To ensure a uniformly mixed sample
Background Concept
Adsorption occurs at the solid-liquid interface, creating a concentration gradient near the carbon particles. Shaking disperses the solid, breaks up local concentration gradients, and ensures that the liquid phase is homogeneous before sampling.
The results of the experiment are shown in Table 1.1.
Table 1.1
| time, | mass of non-adsorbed in sample / mg | mass of adsorbed by activated carbon in sample / mg |
|---|---|---|
| 0 | 2.50 | 0.00 |
| 5 | 1.90 | |
| 15 | 1.52 | |
| 30 | 1.43 | |
| 45 | 0.99 | |
| 60 | 0.88 | |
| 90 | 0.81 | |
| 120 | 0.80 | |
| 150 | 0.80 |
Working
Mass of adsorbed = initial mass () mass of non-adsorbed .
- At :
- At :
- At :
- At :
- At :
- At :
- At :
- At :
Answer
| time, | mass of non-adsorbed in sample / mg | mass of adsorbed by activated carbon in sample / mg |
|---|---|---|
| 0 | 2.50 | 0.00 |
| 5 | 1.90 | 0.60 |
| 15 | 1.52 | 0.98 |
| 30 | 1.43 | 1.07 |
| 45 | 0.99 | 1.51 |
| 60 | 0.88 | 1.62 |
| 90 | 0.81 | 1.69 |
| 120 | 0.80 | 1.70 |
| 150 | 0.80 | 1.70 |
0.60, 0.98, 1.07, 1.51, 1.62, 1.69, 1.70, 1.70
Background Concept
By conservation of mass, the total amount of ethanedioic acid initially present in the sample is (the value at ). Any reduction in the mass remaining in solution corresponds to the mass that has been adsorbed onto the activated carbon:
Plot a graph on the grid in Fig. 1.1 to show the relationship between mass of adsorbed by activated carbon in sample and time, . Use a cross () to plot each data point.
Draw a curved line of best fit.
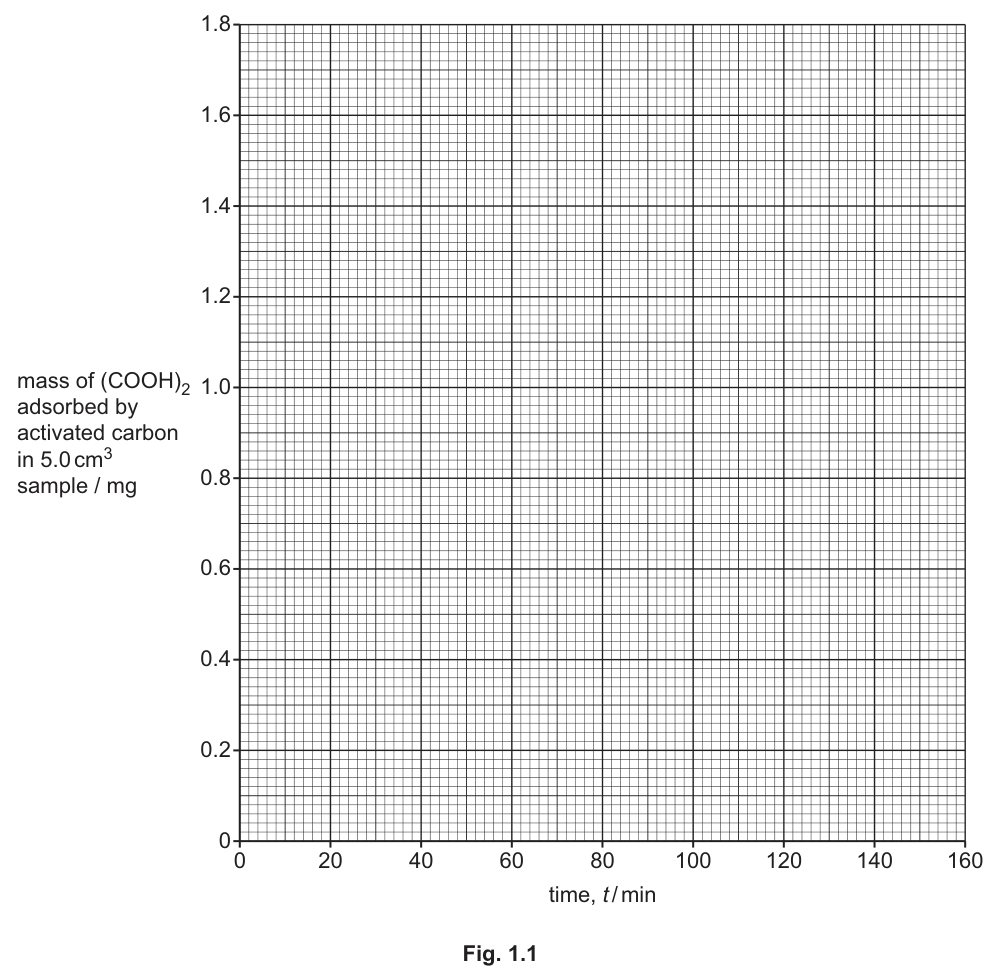
Answer
- Plot all 9 points accurately using a small cross () at each coordinate: , , , , , , , , .
- Draw a smooth continuous curved line of best fit starting at , rising smoothly through all points, deliberately ignoring the anomalous point at , and levelling off asymptotically at by .
All points plotted accurately and smooth curve of best fit drawn ignoring the anomaly at 30 min.
Background Concept
Adsorption kinetics typically follow a curve where the rate is fastest initially when the highest concentration of solute and maximum number of unoccupied active sites are available. Over time, the rate decreases and levels off horizontally when adsorption equilibrium is reached.
Answer
Time (or time of sample removal / ).
time
Background Concept
The independent variable is the factor deliberately chosen and changed by the experimenter (or measured as the progression axis, such as time in rate/kinetic experiments). The dependent variable is the factor measured in response (the mass of acid adsorbed).
Suggest one variable that needs to be controlled that is not stated in the experimental procedure.
Answer
Temperature (of the solution / mixture).
temperature
Background Concept
Adsorption is an equilibrium process and is exothermic. Changes in temperature significantly alter both the rate of adsorption and the equilibrium adsorption capacity. Since temperature was not specified in steps 1 to 5, it must be controlled (e.g. using a thermostatted water bath).
Circle the one point on the graph that you consider to be most anomalous.
Explain the error in timing that may have led to this anomalous point.
Answer
- The point at (mass adsorbed ) is circled.
- The sample was removed earlier than the recorded time of (i.e. actual contact time was less than ), so less had adsorbed.
Point at 30 min circled; actual time sample was removed was less than 30 minutes.
Background Concept
An anomaly on a rate/kinetic curve is a point that deviates significantly from the smooth trend. At , the recorded mass adsorbed is , whereas the smooth curve predicts a value of around . This means significantly less acid had been adsorbed than expected. Because adsorption increases with time, a lower mass adsorbed indicates that the reaction mixture had not been allowed to adsorb for the full 30 minutes—the sample was withdrawn prematurely.
The experiment is repeated using different concentrations of prepared in step 1. The results are shown in Table 1.2.
Table 1.2
| 1 | 2 | 3 | 4 | 5 |
|---|---|---|---|---|
| 2.5 | 0.80 | 1.70 | 34.0 | 0.0235 |
| 5.0 | 2.10 | 2.90 | 58.0 | 0.0362 |
| 7.5 | 4.03 | 3.47 | 69.4 | 0.0581 |
| 10.0 | 6.41 | 3.59 | 71.8 | 0.0893 |
| 12.5 | 8.87 | 3.63 | 72.6 | 0.1222 |
is the initial mass of in sample.
is the mass of non-adsorbed in the final sample at the end of step 5.
is the mass of adsorbed per gram of activated carbon.
A plot of against gives the line of best fit shown in Fig. 1.2.
Use Fig. 1.2 to determine the gradient of the line of best fit.
State the coordinates of both points you used in your calculation.
Include units in your answer.
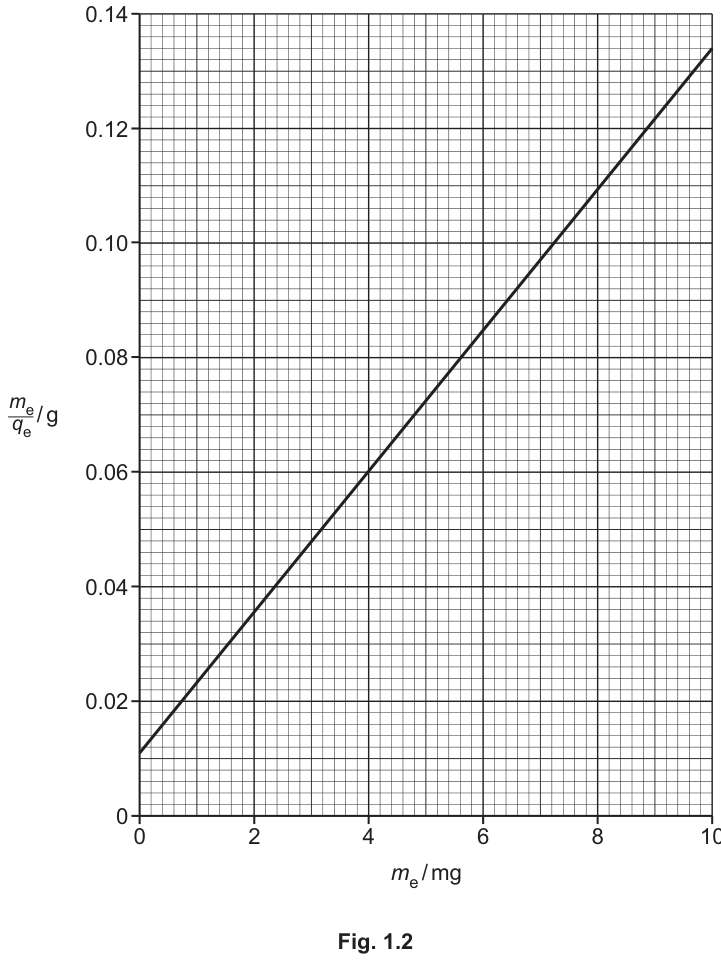
Working
Selecting two points directly on the line of best fit in Fig. 1.2:
Answer
- Coordinates: and
- (accept range )
0.0123 g mg^-1
Background Concept
The gradient of a straight line on a graph is calculated by:
To minimise reading uncertainties, the two selected points must be on the line of best fit and separated by at least half the length of the drawn line.
The unit of the gradient is always the unit of the -axis divided by the unit of the -axis.
The adsorption parameter, , is the maximum mass of adsorbed per gram of activated carbon.
The equation of the line of best fit plotted in Fig. 1.2 is shown.
Use the gradient determined in (h)(i) to calculate the adsorption parameter, .
[If you were unable to determine an answer to (h)(i), then use the value 0.0136 for the gradient. This is not the correct answer.]
Working
Matching the equation to :
Using the calculated gradient of :
(Using the fallback value of : )
Answer
81.3 mg g^-1
Background Concept
The equation provided is a linearised form of the Langmuir adsorption isotherm:
Comparing this with the equation of a straight line, , where and :
Therefore, the maximum adsorption capacity is simply the reciprocal of the gradient.
The experiment is repeated and the value of is calculated to be . The total percentage error from the experimental procedure is .
The data book value of is .
Use this information to determine whether the error in the repeated experiment could be accounted for by experimental errors or is caused by other factors.
Show your working.
Working
Answer
The difference between the experimental value and the data book value is , which is greater than the total experimental percentage error (). Therefore, the error cannot be accounted for by experimental apparatus errors alone; other factors (systematic errors) must have contributed.
Percentage difference = 9.2%, which is greater than the experimental error of 6.5%, so other factors contributed to the error.
Background Concept
When evaluating experimental results against a literature or theoretical reference value, the percentage difference (or relative error) is calculated as:
If the percentage difference between the experimental result and the accepted value is less than or equal to the maximum apparatus percentage error, the discrepancy can be explained entirely by inherent measurement uncertainties. If the percentage difference exceeds the experimental apparatus error, random measurement uncertainties alone cannot account for the deviation, indicating that significant systematic errors or flawed assumptions are present.
The enthalpy change of combustion, , of butane, , can be determined using the apparatus shown in Fig. 2.1.
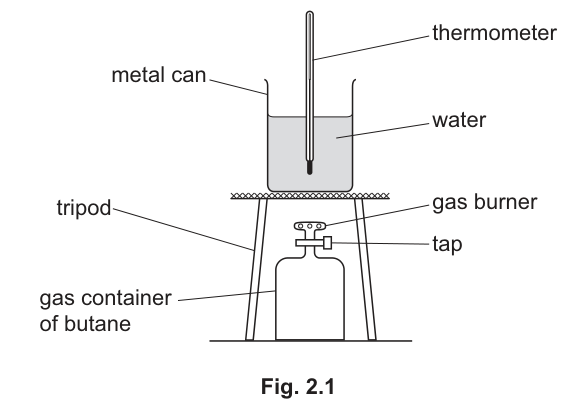
The following steps are carried out.
- step 1 Use a measuring cylinder to transfer of water into a metal can.
- step 2 Place a thermometer into the water. Record the initial temperature of the water in the metal can.
- step 3 Weigh the gas container with burner and record the initial mass.
- step 4 Set up the apparatus as shown in Fig. 2.1.
- step 5 Light the burner and allow the flame to heat the water in the metal can for three minutes.
- step 6 Switch off the burner and record the maximum temperature reached.
- step 7 When cool, reweigh the gas container with burner and record the final mass.
The results are shown in Table 2.1.
Table 2.1
| initial temperature of water / | maximum temperature of water / | change in temperature of water, | initial mass of gas container with burner / g | final mass of gas container with burner / g | mass of butane burned / g |
|---|---|---|---|---|---|
| 19.3 | 76.6 | 183.56 | 181.46 |
Answer
- Change in temperature of water,
- Mass of butane burned
57.3 and 2.10
Background Concept
When recording data from instruments, the precision of a calculated result cannot exceed the precision of the raw measurements. For addition and subtraction, the rule is to round the final answer to the same number of decimal places as the measurement with the fewest decimal places. This preserves the uncertainty inherent in the original readings.
Understanding the Question
The question asks to complete Table 2.1 by calculating the temperature change () and the mass of butane burned. The raw data provided are initial and final temperatures (to 1 decimal place) and initial and final masses (to 2 decimal places).
Approach
Subtract the initial reading from the final reading for both temperature and mass. Ensure the final answers are recorded to the correct number of decimal places as dictated by the source data.
Step-by-Step Reasoning
-
Temperature change ():
The maximum temperature is and the initial temperature is .
Both readings are to 1 decimal place, so the answer is given to 1 decimal place. -
Mass of butane burned:
The initial mass of the container with burner is and the final mass is .
Both readings are to 2 decimal places, so the answer is given to 2 decimal places (the trailing zero is significant and must be kept).
Key Takeaways
Always match the decimal places of calculated differences to the least precise original measurement. Never drop trailing zeros after a decimal point, as they indicate precision (e.g., is less precise than ).
Common Mistakes
- Recording instead of , losing a mark for incorrect significant figures/decimal places.
- Calculating and getting a negative mass without taking the absolute value.
Things to Be Careful About
Ensure you subtract the smaller number from the larger number when finding a difference in mass or temperature to avoid negative values where a positive magnitude is expected. Keep the trailing zero in .
Use the relationship to calculate the energy, , in J, gained by the water.
of water has a mass of .
Working
Answer
(or )
76600 J
Background Concept
The heat energy () gained or lost by a substance is calculated using the equation , where is the mass in grams, is the specific heat capacity in (or ), and is the temperature change in Kelvin or Celsius. For water, the specific heat capacity is . The density of water is approximately , meaning of water has a mass of .
Understanding the Question
Calculate the energy gained by the water in joules. The volume of water is , which converts to a mass of . The specific heat capacity and temperature change are known or calculated in previous parts.
Approach
Substitute the mass of water (), the specific heat capacity of water (), and the temperature change () into the equation .
Step-by-Step Reasoning
-
Identify the values:
- (since )
- (or , the magnitude is the same)
-
Calculate :
-
Round to appropriate significant figures. The given values (, , ) generally have 3 significant figures, so the answer is rounded to 3 significant figures:
Key Takeaways
Always convert volume of water to mass using the given density (). Remember that a temperature change in is numerically identical to a change in K.
Common Mistakes
- Forgetting to convert of water to grams (using instead of is fine here, but if density was different, it would matter).
- Using the wrong specific heat capacity value. is the standard value expected in A-Level Chemistry unless otherwise given.
- Forgetting to convert the final answer to kJ if the question asked for it (though this part asks for J).
Things to Be Careful About
Significant figures: must be rounded to (3 s.f.). Writing or may lose the accuracy mark depending on strictness, though mark schemes often allow unrounded intermediate values. Always carry unrounded values to the next part.
Calculate the enthalpy change of combustion, , of butane, in .
Give your answer to three significant figures.
Working
Molar mass of butane,
Answer
-2120 kJ mol-1
Background Concept
The enthalpy change of combustion () is the energy released when one mole of a substance burns completely in oxygen. It is calculated using , where is the heat energy absorbed by the surroundings (water) in joules, and is the number of moles of fuel burned. The negative sign indicates that combustion is an exothermic process (energy is released from the system to the surroundings).
Understanding the Question
Calculate of butane in to three significant figures. We have the energy gained by the water () and the mass of butane burned (). We need to find the moles of butane and then the energy per mole.
Approach
- Calculate the molar mass of butane ().
- Calculate the moles of butane burned using .
- Calculate using .
- Convert from J to kJ and round to 3 significant figures.
Step-by-Step Reasoning
-
Molar mass of butane ():
Using standard A-Level atomic masses (, ):
-
Moles of butane burned:
-
Enthalpy change of combustion:
The energy released by the combustion is absorbed by the water, so . The energy change for the reaction is .
-
Convert to kJ mol and round:
Rounding to 3 significant figures gives .
Key Takeaways
Always include the negative sign for exothermic reactions. Convert J to kJ by dividing by 1000. Use unrounded intermediate values (like ) in the final calculation to avoid rounding errors.
Common Mistakes
- Forgetting the negative sign (enthalpy change of combustion is always negative for exothermic reactions).
- Forgetting to convert J to kJ (giving instead of ).
- Using the wrong molar mass (e.g., forgetting to multiply H by 10, giving ).
- Rounding intermediate values too early (e.g., using gives , which is wrong).
Things to Be Careful About
The question specifically asks for three significant figures. rounded to 3 s.f. is . Ensure the trailing zero is not counted as significant incorrectly; scientific notation () can avoid ambiguity, but is standard here. Remember that is defined per mole of fuel burned.
Without changing the apparatus, suggest what should be done in step 6 before recording the maximum temperature reached to improve the experimental procedure.
Answer
Stir the water before taking the temperature reading.
Stir the water
Background Concept
In calorimetry experiments, heat is often applied locally (e.g., at the bottom of the can by the burner). Without stirring, the water near the heat source will be hotter than the water at the top or sides. This creates a temperature gradient, meaning a thermometer placed in the water may not record the true average maximum temperature.
Understanding the Question
The question asks for a procedural improvement in step 6 (recording the maximum temperature) without changing the apparatus. We need to ensure the temperature reading is accurate and represents the whole volume of water.
Approach
Stirring ensures that the heat is distributed evenly throughout the water, allowing the thermometer to record the true maximum average temperature.
Step-by-Step Reasoning
- Action: Stir the water gently but continuously during heating, and especially just before recording the maximum temperature.
- Reason: This eliminates temperature gradients and ensures the thermometer measures the average temperature of the entire water volume. Without stirring, the recorded maximum temperature might be lower than the actual average temperature, leading to an underestimation of and .
Key Takeaways
Stirring is a standard improvement in simple calorimetry to ensure thermal equilibrium throughout the liquid.
Common Mistakes
- Suggesting to 'use a better thermometer' (this changes the apparatus).
- Suggesting 'wait longer' (this doesn't help if the water is stratified).
Things to Be Careful About
The question specifies 'without changing the apparatus'. Therefore, suggestions like 'add a lid', 'use a copper can instead of steel', or 'use a digital thermometer' are incorrect. The answer must be an action the student can perform with the existing equipment.
The measuring cylinder has graduations every .
Calculate the percentage error in the measurement of the volume of water.
Show your working.
Working
Smallest division =
Maximum absolute error =
Answer
0.78%
Background Concept
Every measuring instrument has a limit to its precision, defined by its smallest division. The maximum absolute error of a measurement is typically taken as half of the smallest division (assuming the user can estimate to the nearest half-division). The percentage error is a relative measure of this uncertainty, calculated as .
Understanding the Question
Calculate the percentage error in measuring of water using a measuring cylinder with graduations every .
Approach
- Determine the maximum absolute error: half of is .
- Apply the percentage error formula: .
Step-by-Step Reasoning
-
Absolute error:
The measuring cylinder has markings every . The maximum error in reading the meniscus is half of this interval:
-
Percentage error:
Rounding to 2 significant figures (standard for percentage errors in this context, or matching the precision of the inputs): .
Key Takeaways
Percentage error = . Larger measured values reduce the percentage error, which is why using a more precise instrument or measuring a larger volume improves accuracy.
Common Mistakes
- Using the full smallest division () as the absolute error instead of half ().
- Forgetting to multiply by 100 to get a percentage.
- Calculating the error for the wrong volume (e.g., using instead of ).
Things to Be Careful About
Ensure you use the volume actually measured (), not the total capacity of the cylinder ().
A student suggests that the value calculated in (c) is different from the actual value of of butane because of heat lost during the experiment. Suggest one change to the apparatus that would reduce the heat lost.
Answer
Use a lid (or cover) on the metal can.
Use a lid
Background Concept
In simple combustion calorimetry, a significant source of error is heat loss to the surroundings. Heat is lost via conduction through the can, convection from the water surface, and radiation. Minimizing these losses improves the accuracy of the calculated .
Understanding the Question
Suggest one change to the apparatus (not just the procedure) to reduce heat lost. The current apparatus is an open metal can on a tripod.
Approach
Identify the major pathway for heat loss. The open top of the can allows hot water vapor to escape and heat to be lost by convection and evaporation. Covering it with a lid traps the heat.
Step-by-Step Reasoning
- Observation: The metal can is open at the top.
- Heat loss mechanism: Evaporation of water and convection currents carry heat away from the water surface into the air.
- Improvement: Place a lid (e.g., a piece of cardboard with holes for the thermometer and burner, or a dedicated calorimeter lid) on the metal can.
- Effect: This reduces heat loss by evaporation and convection, ensuring more of the combustion energy is transferred to the water.
Key Takeaways
Lids, insulation (e.g., polystyrene cups instead of metal cans), and wind shields are standard apparatus improvements for calorimetry.
Common Mistakes
- Suggesting 'stir the water' (this is a procedural change, not an apparatus change, and was the answer to part d).
- Suggesting 'use a digital thermometer' (this improves precision of reading, not necessarily reducing heat loss).
- Suggesting 'move the burner closer' (this increases heat loss to the air and may cause incomplete combustion).
Things to Be Careful About
The question asks for a change to the apparatus. 'Stir the water' is an action/procedure. 'Use a lid' is an additional piece of apparatus. Be precise with your wording.
The experiment was repeated but the burner was switched off after only two minutes.
Answer
The absolute error in temperature change (or mass of butane burned) remains the same, but the measured value is smaller, so the percentage error increases.
Percentage error increases
Background Concept
Percentage error is inversely proportional to the measured value: . If the absolute error (determined by instrument precision) stays constant but the measured value decreases, the percentage error increases. This reduces the accuracy of the final calculated result.
Understanding the Question
The burner is switched off after 2 minutes instead of 3. This means less heat is transferred to the water, resulting in a smaller temperature change () and less butane burned (smaller mass change). We need to explain why this reduces accuracy.
Approach
Consider the effect of smaller measured values on the percentage error calculation. The precision of the thermometer and balance doesn't change, so the absolute error is constant.
Step-by-Step Reasoning
-
Effect on measurements:
Heating for a shorter time (2 min vs 3 min) results in a smaller temperature rise (e.g., instead of ) and less fuel burned (e.g., instead of ). -
Effect on percentage error:
The absolute error in (e.g., ) and mass (e.g., ) remains the same because the instruments haven't changed.
However, because the measured values ( and mass burned) are smaller, the ratio is larger.
-
Conclusion:
The increased percentage error in the fundamental measurements ( and mass) propagates through the calculation, reducing the accuracy of the final value.
Key Takeaways
Smaller measured values lead to larger percentage errors if the instrument precision is unchanged. This is why calorimetry experiments often aim for a significant temperature rise (e.g., ) to minimize percentage errors.
Common Mistakes
- Saying 'the error is larger' (vague; specify percentage error increases because absolute error is constant while value is smaller).
- Suggesting the thermometer is less accurate (instruments have fixed precision).
Things to Be Careful About
Distinguish between accuracy (closeness to true value, affected by systematic errors and percentage errors) and precision (reproducibility, affected by random errors). Here, the percentage error increases, reducing the reliability/accuracy of the result.
Answer
There is less time for heat to be lost to the surroundings, so a greater proportion of the energy released is transferred to the water.
Less heat loss
Background Concept
In any real calorimetry experiment, heat is continuously lost to the surroundings (air, tripod, can) at a rate proportional to the temperature difference between the system and the surroundings. The longer the experiment runs, the more total heat is lost. This is a systematic error that causes the calculated to be less exothermic (smaller magnitude) than the true value.
Understanding the Question
Despite the increased percentage error (from part i), switching off the burner earlier (2 min instead of 3 min) might actually increase the accuracy of . We need to explain why.
Approach
Consider the cumulative effect of heat loss over time. A shorter experiment duration means less total time for heat to escape to the surroundings.
Step-by-Step Reasoning
-
Heat loss mechanism:
Heat is lost from the water, can, and apparatus to the surrounding air via convection, conduction, and radiation. This loss is continuous and accumulates over time. -
Effect of shorter time:
By switching off the burner after 2 minutes instead of 3, the total duration of the experiment is reduced. Therefore, there is less total time for heat to be lost to the surroundings. -
Effect on accuracy:
Although the percentage error in measurements increases (as discussed in part i), the reduction in cumulative heat loss means that a higher percentage of the energy released by combustion is actually absorbed by the water. This systematic error (heat loss) is reduced, which can improve the overall accuracy of the calculated value, potentially outweighing the increased percentage error from the smaller readings.
Key Takeaways
There is a trade-off in calorimetry: heating for too long increases cumulative heat loss (reducing accuracy), while heating for too short a time increases percentage errors in measurements (also reducing accuracy). An optimal temperature rise (usually ) balances these two effects.
Common Mistakes
- Saying 'less heat is produced' (the rate of heat production is the same; the total time is shorter).
- Confusing this with part (i) and giving a reason about percentage error.
Things to Be Careful About
The question asks why it might contribute to an increase in accuracy. Focus on the reduction of systematic error (heat loss) rather than random error (percentage error).