Chemistry 9701/53 — October/November 2024
Cambridge A-Level · Planning, Analysis and Evaluation · worked solutions for every part, with the mark scheme
Topics Planning · Analysis, Conclusions and Evaluation
A student uses the following method to determine the percentage by mass of the painkiller aspirin, , in some tablets.
step 1 Grind five tablets into a powder.
step 2 Use a weighing boat to accurately weigh by difference approximately of powdered tablets into a pear-shaped flask containing anti-bumping granules.
step 3 Add of aqueous sodium hydroxide, , to the pear-shaped flask, forming mixture A.
step 4 Reflux mixture A for 20 minutes.
step 5 Allow mixture A to cool and then filter into a small beaker. Label the filtrate solution B.
step 6 Add of alkaline aqueous iodine to solution B and leave to stand for 1 hour. A precipitate, C, , will form.
step 7 Filter the resulting mixture under reduced pressure. Wash the residue, C, with a small volume of cold distilled water.
step 8 Allow solid C to dry.
step 9 Weigh solid C and record its mass.
Alkaline aqueous iodine is irritating to the skin and eyes.
Identify an appropriate precaution, other than eye protection and a lab coat, that the student should take when using alkaline aqueous iodine.
Answer
Wear chemically resistant gloves.
Wear chemically resistant gloves.
Background Concept
Alkaline aqueous iodine is a mixture of iodine and sodium hydroxide (or potassium iodide/iodate in alkaline solution). Iodine is a corrosive substance that can stain skin and cause chemical burns. Alkaline solutions are corrosive and can cause severe skin and eye irritation or burns. Standard laboratory safety protocols require personal protective equipment (PPE) to prevent contact with hazardous chemicals.
Understanding the Question
The question asks for a precaution when using alkaline aqueous iodine, explicitly excluding eye protection (goggles) and a lab coat. We need to identify another piece of PPE or a safe working practice that mitigates the specific risks of this reagent.
Approach
Identify the hazards: corrosive/irritating to skin and eyes. Since eye protection and lab coat are excluded, the most direct additional protection for the hands is chemically resistant gloves.
Step-by-Step Reasoning
- The reagent is alkaline aqueous iodine.
- It is stated to be irritating to the skin and eyes.
- Eye protection and a lab coat are already assumed/allowed.
- The hands are most vulnerable to spills and splashes.
- Therefore, wearing chemically resistant gloves (e.g., nitrile or rubber gloves) is the appropriate additional precaution to protect the skin from chemical burns and irritation.
Key Takeaways
Always match the precaution to the specific hazard. For corrosive/irritating liquids, gloves are essential in addition to goggles and a lab coat.
Common Mistakes
- Writing "gloves" without specifying "chemically resistant" or "rubber". Standard cotton gloves offer no protection against alkaline solutions or iodine.
- Suggesting "fume hood" or "good ventilation". While good practice, the primary hazard described is skin/eye irritation from direct contact, making gloves the most direct and expected answer.
Things to Be Careful About
- Read the exclusion carefully: "other than eye protection and a lab coat". Do not repeat these.
- Be specific: "gloves" is often accepted, but "chemically resistant gloves" is more precise and demonstrates understanding of the chemical hazard.
Describe how the student should carry out step 2. Include a results table, with appropriate headings, for the student to fill in.
Answer
Method:
- Measure the mass of the weighing boat plus the powdered tablets before transfer.
- Transfer the powder to the flask.
- Measure the mass of the weighing boat plus any residual solid after transfer.
- The difference gives the mass of solid transferred.
Results Table:
| Mass of boat + solid (before transfer) / g | Mass of boat + residue (after transfer) / g | Mass of solid transferred / g |
|---|---|---|
See working.
Background Concept
Weighing by difference is a standard analytical technique used to accurately determine the mass of a substance transferred from a container. Instead of trying to weigh the substance directly on the receiving vessel (which is prone to spillage and loss), you weigh the source container before and after transfer. The difference is the mass transferred, which is more accurate because it accounts for any material left behind.
Understanding the Question
Step 2 requires weighing approximately 0.4 g of powdered tablets into a pear-shaped flask. The question asks for a description of how to carry this out (the method) and a results table with appropriate headings and units to record the data.
Approach
- Describe the weighing by difference method: weigh boat + solid, transfer, weigh boat + residue.
- Design a table with clear, unambiguous headings that include the correct unit (g) for each column.
Step-by-Step Reasoning
- M1 (Method): The student must measure the mass of the weighing boat with the solid before transfer. Then, after transferring the powder to the flask, measure the mass of the boat with the remaining (residual) solid. The difference is the mass transferred.
- M2 (Table): The table needs three columns. The headings must be unambiguous (e.g., "Mass of boat + solid (before transfer)") and must include the unit "/ g". A third column for the calculated mass transferred is implied and earns the mark.
Key Takeaways
Weighing by difference is more accurate than direct weighing for powders. Tables must have clear headings with units. Units can be in the heading or the column, but must be present.
Common Mistakes
- Writing "weigh the tablets" or "weigh the powder". This is not accurate enough; you cannot weigh a powder directly into a flask without a container, and you need to account for residue.
- Forgetting the unit in the table heading. A table without units is not scientifically valid.
- Writing "Mass of tablets" as a heading. This is ambiguous; it doesn't specify if it's before or after transfer.
Things to Be Careful About
- The mark scheme requires the headings to be unambiguous. Use phrases like "(before transfer)" and "(after transfer)" or "residue / residual solid".
- Ensure the table has enough rows to record at least one set of readings, though the mark scheme primarily rewards the structure and headings.
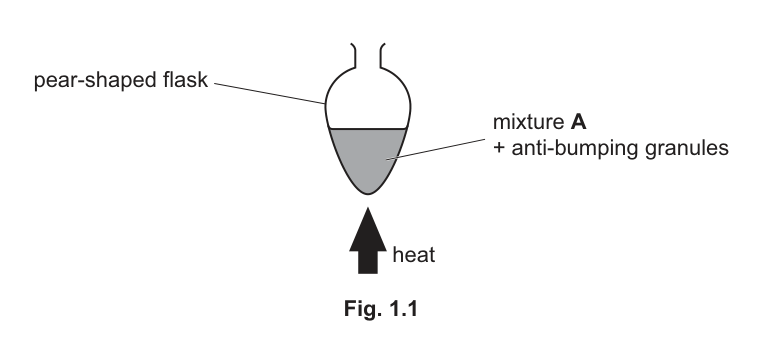
Complete Fig. 1.1 to show how step 4 is carried out in the laboratory.
Label your diagram fully.
Answer
Attach a vertical Liebig condenser to the top of the pear-shaped flask.
Label the water inlet at the bottom of the condenser and the water outlet at the top.
See diagram.
Background Concept
Reflux is a technique used to heat a reaction mixture for an extended period without losing solvent or volatile reactants/products. It involves boiling the mixture and condensing the vapours back into the flask. A Liebig (water) condenser is used, which consists of an inner tube (where vapours travel) and an outer jacket (through which cooling water flows).
Understanding the Question
Step 4 is "Reflux mixture A for 20 minutes". Fig 1.1 shows a pear-shaped flask with mixture A and anti-bumping granules, with heat applied. The top is open. The student must complete the diagram to show the reflux setup.
Approach
- Identify the missing apparatus: a vertical condenser.
- Draw it attached to the top of the flask.
- Apply the principle of counter-current flow for cooling: cold water enters at the bottom (to fill the jacket completely) and exits at the top.
Step-by-Step Reasoning
- M1: A condenser must be drawn vertically above the flask. It should be a Liebig condenser (inner tube, outer jacket). It must be attached to the flask (often with a clip, though just attaching it is usually sufficient for the diagram mark).
- M2: The cooling water flow must be counter-current to the hot vapours. Cold water enters at the bottom inlet and exits at the top outlet. This ensures the condenser jacket is always full of cold water, providing maximum cooling efficiency. Labels "water in" at the bottom and "water out" at the top are required.
Key Takeaways
Reflux requires a vertical condenser. Water always flows in at the bottom and out at the top to ensure the jacket is full and cooling is efficient.
Common Mistakes
- Drawing the condenser horizontally or at an angle. Reflux condensers must be vertical.
- Reversing the water flow (in at top, out at bottom). This leads to poor cooling as the jacket may not fill completely, and the water warms up as it flows down, reducing efficiency.
- Forgetting to label the water inlet and outlet. The diagram must be fully labelled.
Things to Be Careful About
- The diagram must be clearly labelled. Use arrows to show water flow direction if text labels are ambiguous.
- Do not draw a thermometer or other apparatus unless required. Only add what is necessary for reflux.
The student uses a measuring cylinder to measure the volume of alkaline aqueous iodine in step 6. Suggest why this is a suitable piece of apparatus to use.
Answer
Alkaline aqueous iodine is used in excess, so an exact volume is not required.
Alkaline aqueous iodine is in excess.
Background Concept
In stoichiometric calculations and quantitative analysis, the reagent that is completely consumed is the limiting reagent, and its amount must be measured accurately. The reagent that is present in excess does not need to be measured precisely, as long as there is enough to drive the reaction to completion.
Understanding the Question
The student uses a measuring cylinder (accurate to ~0.5-1 cm³) to measure 30 cm³ of alkaline aqueous iodine. The question asks why this relatively low-precision apparatus is suitable.
Approach
Look at the role of iodine in the reaction. Is it the limiting reagent or in excess?
Step-by-Step Reasoning
- The reaction in step 6 is between solution B (containing the hydrolysis products of aspirin) and iodine.
- To ensure all the aspirin derivative reacts, iodine must be added in excess.
- Since iodine is in excess, its exact volume does not affect the stoichiometry of the final product (solid C). Only the amount of the limiting reagent (the aspirin derivative) matters.
- Therefore, a measuring cylinder, which is less precise than a volumetric pipette or burette, is perfectly suitable.
Key Takeaways
If a reagent is in excess, its volume does not need to be measured with high precision. Measuring cylinders are adequate for excess reagents.
Common Mistakes
- Saying "because it is easy to use". This is not a scientific justification.
- Saying "because 30 cm³ is a large volume". Volume alone doesn't dictate precision; it's the role of the reagent (excess vs limiting) that matters.
Things to Be Careful About
- Focus on the chemical role of the reagent (excess) rather than the physical properties of the apparatus.
Answer
To ensure the reaction goes to completion (or to ensure all the reactant is converted to product).
To ensure the reaction is complete.
Background Concept
Many chemical reactions, especially those involving precipitation or complexation in solution, are not instantaneous. They may be slow at room temperature. Leaving the mixture to stand allows the reaction to proceed until the limiting reagent is fully consumed.
Understanding the Question
In step 6, alkaline aqueous iodine is added to solution B, and the mixture is left to stand for 1 hour before filtering. The question asks why this time is allowed.
Approach
Consider the purpose of waiting in a precipitation reaction. It is to ensure all possible product has formed.
Step-by-Step Reasoning
- The reaction between the aspirin derivative and iodine produces a solid precipitate (C).
- If filtered immediately, some of the aspirin derivative might not have reacted yet, leading to a lower yield of solid C.
- Leaving the mixture for 1 hour ensures that the reaction has sufficient time to reach completion, maximizing the yield of the precipitate.
Key Takeaways
Waiting time in precipitation reactions ensures the reaction goes to completion and maximizes yield.
Common Mistakes
- Saying "to let it cool down". The mixture is likely already at room temperature after step 5.
- Saying "to let the precipitate settle". While settling helps filtration, the primary chemical reason is reaction completion.
Things to Be Careful About
- Use precise language: "ensure the reaction is complete" or "allow the reaction to go to completion".
Answer
To remove soluble impurities (such as excess iodine, sodium hydroxide, sodium iodide, or sodium hydrogencarbonate) from the surface of the precipitate.
To remove soluble substances from the residue.
Background Concept
When a precipitate is filtered from a reaction mixture, it is coated with the mother liquor (the solution it was formed in). This mother liquor contains unreacted reagents, by-products, and solvent. To obtain a pure, dry solid, the precipitate must be washed to remove these soluble impurities.
Understanding the Question
Step 7 involves filtering the mixture and washing the residue (solid C) with cold distilled water. The question asks why this washing step is necessary.
Approach
Identify what is on the surface of the solid C after filtration. It will be coated with the reaction mixture.
Step-by-Step Reasoning
- The reaction mixture contains excess alkaline iodine, NaOH, NaI, NaHCO₃, and water.
- These are all soluble in water.
- Washing the solid C with distilled water dissolves and removes these soluble impurities from the surface of the precipitate.
- This ensures that when solid C is dried and weighed, the mass is due only to solid C, not to trapped soluble salts or reagents.
Key Takeaways
Washing a precipitate removes soluble impurities trapped in the filter cake, ensuring an accurate mass measurement of the pure product.
Common Mistakes
- Saying "to clean the solid". Too vague. Must specify "soluble impurities" or name specific soluble substances.
- Saying "to remove the solution". Technically true, but "soluble substances" or "impurities" is the required scientific terminology.
Things to Be Careful About
- The mark scheme accepts specific named soluble substances (e.g., excess iodine, NaOH, NaI, NaHCO₃). Using the general term "soluble substances" or "soluble impurities" is also acceptable and often safer.
Answer
The residue (solid C) is less soluble in cold water. Using hot water would dissolve some of the product, reducing the yield and the final mass.
The residue is less soluble in cold water.
Background Concept
Solubility of most solids increases with temperature. When washing a precipitate, you want to remove soluble impurities without dissolving the precipitate itself. Therefore, cold solvent is used to minimize the solubility of the product.
Understanding the Question
Step 7 specifies washing with "cold distilled water". The question asks why hot water is not used.
Approach
Consider the effect of temperature on the solubility of solid C.
Step-by-Step Reasoning
- Solid C is , a large organic molecule with iodine atoms. Like many organic solids, its solubility in water will increase with temperature.
- If hot water is used, a significant portion of solid C will dissolve and be lost in the filtrate.
- This would reduce the mass of solid C collected, leading to an inaccurate (lower) calculated percentage of aspirin.
- Using cold water minimizes the solubility of solid C, ensuring maximum yield is retained on the filter paper.
Key Takeaways
Always use cold solvent when washing a precipitate to minimize product loss due to solubility.
Common Mistakes
- Saying "hot water would evaporate too quickly". Not the primary chemical reason.
- Saying "it would dissolve the impurities faster". While true, the main reason is to prevent dissolving the product.
Things to Be Careful About
- The mark scheme specifically looks for the relationship between temperature and solubility: "less soluble in cold water" or "hot water would dissolve the product".
The equation for the reaction between aspirin, , and , which takes place in step 4, is shown.
The equation for the reaction in which solid C, , is formed in step 6 is shown.
The student’s results are shown in Table 1.1.
Table 1.1
| mass of powdered tablets added to the pear-shaped flask in step 2 | |
| mass of dry recorded in step 9 |
Working
Answer
1.111e-3 mol
Background Concept
The amount of substance (in moles) is calculated from its mass and relative molecular mass () using the equation: . This is a fundamental conversion in chemistry.
Understanding the Question
Given the mass of dry solid C () and its (), calculate the amount in mol.
Approach
Apply the formula .
Step-by-Step Reasoning
- Mass
- Round to 3 significant figures: (or keep more digits for intermediate calculations: )
Key Takeaways
Always use the formula and ensure units are consistent (mass in g, in g/mol).
Common Mistakes
- Forgetting to divide by and just writing the mass.
- Using the wrong value.
- Rounding too early, which can cause errors in subsequent calculations.
Things to Be Careful About
- Keep at least 4 significant figures in intermediate calculations to avoid rounding errors.
- The mark scheme accepts or .
Use your answer to (i) to calculate the mass, in g, of in the powdered tablets added to the flask in step 2.
Working
From the equations:
1 mol is produced from 2 mol .
2 mol (aspirin) produces 2 mol .
Therefore, 2 mol produces 1 mol .
of
Answer
0.400 g
Background Concept
Stoichiometry allows us to relate the amounts of different substances in a chemical reaction using the balanced equations. By linking two consecutive reactions, we can find the overall molar ratio between the initial reactant and the final product.
Understanding the Question
We need to find the mass of aspirin () that produced the of solid C. We are given two equations:
Approach
- Find the molar ratio between aspirin and the intermediate ().
- Find the molar ratio between the intermediate and solid C.
- Combine to find the overall ratio between aspirin and solid C.
- Calculate moles of aspirin, then mass.
Step-by-Step Reasoning
- From equation 1: 1 mol produces 1 mol .
- From equation 2: 2 mol produces 1 mol .
- Therefore, 2 mol are needed to produce 1 mol .
- Moles of .
- of .
- Mass .
Key Takeaways
When linking multiple reactions, trace the common intermediate to find the overall stoichiometric ratio.
Common Mistakes
- Assuming a 1:1 ratio between aspirin and solid C. Must use the equations to find the correct ratio (2:1).
- Forgetting to multiply by 2 for the moles of aspirin.
- Using the wrong for aspirin (must calculate or be given: 180.0).
Things to Be Careful About
- The mark scheme explicitly states: "amount of ". This confirms the 2:1 ratio.
- Keep track of significant figures. is 3 sig figs.
Use your answer to (ii) to calculate the percentage by mass of aspirin, , in the tablets.
If you were unable to obtain an answer to (ii) you may use for the mass of . This is not the correct value.
Working
Answer
97.8%
Background Concept
Percentage by mass is a way to express the concentration of a component in a mixture. It is calculated as the mass of the component divided by the total mass of the mixture, multiplied by 100.
Understanding the Question
Calculate the percentage by mass of aspirin in the tablets. We have the mass of aspirin calculated in (ii) () and the mass of powdered tablets added in step 2 ().
Approach
Apply the percentage by mass formula.
Step-by-Step Reasoning
- Mass of aspirin
- Mass of powdered tablets
- Round to 3 significant figures:
Key Takeaways
Percentage by mass = (mass of component / total mass) x 100. Ensure both masses are in the same units.
Common Mistakes
- Forgetting to multiply by 100.
- Using the wrong mass for the tablets (e.g., mass of 5 tablets instead of the mass actually weighed).
- Rounding errors from previous steps.
Things to Be Careful About
- The mark scheme accepts . Using or may also be accepted depending on rounding, but 3 sig figs is standard.
- The question provides an alternative value () if the student couldn't calculate (ii). This is for error carried forward (ecf).
Another student follows the same method but does not allow solid C to dry completely in step 8.
State and explain the effect that this has on the calculated percentage by mass of aspirin, , in the tablets.
Answer
If solid C is not completely dry, its measured mass will be greater than the true mass (due to water).
This leads to a calculated amount of solid C that is too high.
Consequently, the calculated mass and percentage by mass of aspirin will be greater than the true value.
The mass of solid C would be greater, so the calculated percentage by mass of aspirin would be greater.
Background Concept
Error analysis in quantitative experiments requires tracing the effect of a procedural error through the entire calculation chain to determine whether the final result is too high or too low.
Understanding the Question
The student does not allow solid C to dry completely in step 8. We need to state and explain the effect on the calculated percentage by mass of aspirin.
Approach
- Effect on mass of solid C.
- Effect on moles of solid C.
- Effect on moles of aspirin.
- Effect on mass of aspirin.
- Effect on percentage by mass.
Step-by-Step Reasoning
- Effect on mass: If solid C is not dry, it contains water. The measured mass ( in the example) will be higher than the true mass of solid C alone.
- Effect on moles: Since , a higher mass leads to a higher calculated amount of solid C.
- Effect on aspirin: The stoichiometry links moles of solid C to moles of aspirin (2:1 ratio). Higher moles of solid C -> higher calculated moles of aspirin -> higher calculated mass of aspirin.
- Effect on percentage: Percentage = (calculated mass of aspirin / mass of tablets) x 100. Since the numerator is too high and the denominator is unchanged, the percentage will be greater than the true value.
Key Takeaways
Trace the error through the calculation: higher measured mass of product -> higher calculated reactant mass -> higher percentage.
Common Mistakes
- Saying "the percentage would be lower". This is incorrect; the error propagates to make it higher.
- Not explaining the chain of reasoning. Must state both the effect on the mass of C and the effect on the percentage.
- Saying "the mass of aspirin would be greater" without mentioning the percentage. The question asks for the effect on the percentage.
Things to Be Careful About
- The mark scheme requires TWO points: (1) mass/amount of solid C would be greater, and (2) calculated percentage would be greater. Both are needed for the mark.
- Use clear language: "greater than the true value" or "too high".
Crystal violet, , is a purple dye.
Some light is absorbed when it passes through .
Absorbance is the proportion of light absorbed at a particular wavelength. This is measured using a colorimeter.
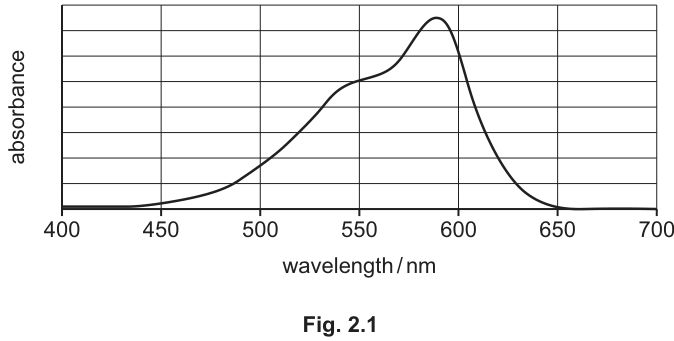
A graph of absorbance against wavelength for is shown in Fig. 2.1.
A student investigates how to determine the concentration of aqueous crystal violet, , using colorimetry.
Suggest the best wavelength of light to use in the colorimeter when measuring the concentration of .
Answer
588 nm
588 nm
Background Concept
When using a colorimeter to measure the concentration of a colored solution, the Beer-Lambert law states that absorbance is directly proportional to concentration. To obtain the most accurate and sensitive measurements, the wavelength of light used should correspond to the wavelength of maximum absorbance () of the substance. At this wavelength, even small changes in concentration produce the largest possible changes in absorbance, minimizing percentage errors.
Understanding the Question
The question asks for the best wavelength to use when measuring the concentration of aqueous crystal violet. We are given a graph (Fig. 2.1) of absorbance against wavelength. We need to read the wavelength at which the absorbance is at its peak.
Approach
Locate the highest point on the absorbance vs. wavelength curve in Fig. 2.1 and read the corresponding value on the x-axis (wavelength in nm).
Step-by-Step Reasoning
- Examine Fig. 2.1, which plots absorbance on the y-axis against wavelength in nm on the x-axis.
- Identify the peak of the curve. The curve rises from 400 nm, has a shoulder around 540 nm, and reaches a maximum peak just before 600 nm.
- Reading the x-axis at the peak, the maximum absorbance occurs at approximately 588 nm (accept 589.7 nm or 590 nm depending on reading precision).
- This wavelength () is the optimal choice for the colorimeter.
Key Takeaways
Always choose the wavelength of maximum absorbance () for colorimetric analysis to ensure maximum sensitivity and minimize measurement error.
Common Mistakes
- Choosing a wavelength on the shoulder of the curve (e.g., 540 nm) instead of the true peak.
- Reading the y-axis value (absorbance) instead of the x-axis value (wavelength).
Things to Be Careful About
- Ensure the wavelength is read from the x-axis in nm.
- Small variations in reading the graph (e.g., 588 to 590 nm) are acceptable as long as it is clearly at the peak.
Solution D is of .
Calculate the mass of needed to prepare solution D.
Give your answer to three significant figures.
[: , 407.5]
Working
Answer
5.09 g
5.09 g
Background Concept
To prepare a solution of a known concentration, we first calculate the number of moles of solute required using the equation , where is concentration in mol dm and is volume in dm. Once the moles are known, the mass required is found using , where is the relative formula mass.
Understanding the Question
We need to calculate the mass of solid crystal violet () needed to make 500.0 cm (which is 0.5000 dm) of a mol dm solution. The final answer must be given to three significant figures.
Approach
- Convert the volume from cm to dm.
- Calculate the moles of crystal violet needed.
- Multiply the moles by the molar mass to find the mass in grams.
- Round to three significant figures.
Step-by-Step Reasoning
- Volume .
- Moles .
- Mass .
- Rounding to three significant figures gives 5.09 g.
Key Takeaways
Always ensure volume is in dm when using . Pay attention to significant figure requirements in the final answer.
Common Mistakes
- Forgetting to convert cm to dm (using 500 instead of 0.5), which gives a mass 1000 times too large.
- Rounding too early in the calculation.
- Not adhering to the requested number of significant figures (5.094 g or 5.1 g would be incorrect).
Things to Be Careful About
- The volume is 500.0 cm, which has four significant figures, but the concentration has three. The final answer is correctly given to three significant figures as 5.09 g.
The student is given a small beaker containing the mass of calculated in (i).
Describe how the student should prepare of solution D.
Include the name and capacity of the key apparatus which should be used and describe how the student should ensure the volume is exactly .
Answer
- Add a small volume of distilled water to the beaker containing the solid and stir to dissolve it completely.
- Transfer the solution to a 500 cm volumetric flask, rinsing the beaker and stirring rod with distilled water and adding the washings to the flask.
- Add distilled water to the volumetric flask until the bottom of the meniscus is exactly on the calibration mark.
- Stopper the flask and invert it several times to mix the solution thoroughly.
See working
Background Concept
Preparing a standard solution of a precise concentration requires a volumetric flask. The process involves dissolving the solute in a small amount of solvent, transferring it quantitatively to the flask, and making up to the exact calibration mark. 'Quantitative transfer' means ensuring no solute is left behind in the beaker.
Understanding the Question
The student has calculated the mass of crystal violet (5.09 g) and has a small beaker containing it. They must prepare exactly 500.0 cm of solution. We need to describe the procedure, naming the key apparatus (500 cm volumetric flask) and explaining how the exact volume is achieved.
Approach
Outline the steps in chronological order: dissolving, quantitative transfer, making up to the mark, and mixing. Emphasize the use of distilled water and the specific apparatus.
Step-by-Step Reasoning
- M1 (Dissolving): The solid cannot be dissolved directly in 500 cm of water because the final volume would exceed 500 cm. Add a small volume (e.g., 50-100 cm) of distilled water to the beaker and stir until the solid is fully dissolved.
- M2 (Transfer and washings): Pour the dissolved solution into a 500 cm volumetric flask. To ensure all the solute is transferred (quantitative transfer), rinse the beaker and stirring rod with small amounts of distilled water and add these washings to the flask.
- M3 (Make up to mark and mix): Carefully add distilled water to the flask until the bottom of the meniscus sits exactly on the calibration mark etched on the neck of the flask. This ensures the total volume is exactly 500.0 cm. Finally, stopper the flask and invert it multiple times to ensure the solution is homogeneous.
Key Takeaways
Volumetric preparation requires a volumetric flask, quantitative transfer (including washings), and making up to the calibration mark with the correct solvent (distilled water).
Common Mistakes
- Saying 'add 500 cm of water to the solid' (this is incorrect; the final volume must be 500 cm, not the volume of water added).
- Forgetting to mention washings or the volumetric flask.
- Not specifying 'distilled' water (tap water contains ions that could affect the experiment).
Things to Be Careful About
- The question specifically asks to 'include the name and capacity of the key apparatus' (500 cm volumetric flask) and 'describe how the student should ensure the volume is exactly 500.0 cm' (make up to the calibration mark / bottom of meniscus on the mark).
A small sample of solution D was diluted to form solution E, .
The student prepares solutions 2 to 6 as shown in Table 2.1.
The total volume needed for each of solutions 2 to 6 is .
Each solution is placed into a colorimeter and the absorbance is measured.
Complete Table 2.1 to show the volumes of solution E and distilled water needed to prepare each of the solutions from 2 to 6. Give all volumes to two decimal places.
Table 2.1
| solution | volume of (solution E) / | volume of distilled water / | / | absorbance |
|---|---|---|---|---|
| 1 | 0.00 | 20.00 | 0.00 | 0.000 |
| 2 | 0.191 | |||
| 3 | 0.270 | |||
| 4 | 0.545 | |||
| 5 | 0.711 | |||
| 6 | 0.860 |
Answer
| solution | volume of mol dm CHNCl(aq) (solution E) / cm | volume of distilled water / cm |
|---|---|---|
| 2 | 4.00 | 16.00 |
| 3 | 8.00 | 12.00 |
| 4 | 12.00 | 8.00 |
| 5 | 16.00 | 4.00 |
| 6 | 20.00 | 0.00 |
See working
Background Concept
When preparing a series of dilutions from a stock solution to create a calibration curve, the total volume of each diluted solution is kept constant. The volume of stock solution needed for a desired concentration can be found using the dilution equation , where and are the concentration and volume of the stock solution, and and are the concentration and total volume of the diluted solution. The volume of water added is simply the total volume minus the volume of stock solution.
Understanding the Question
Solution E has a concentration of mol dm. We need to prepare solutions 2 to 6 with total volumes of 20.00 cm and target concentrations ranging from to mol dm. We must calculate the volumes of solution E and distilled water for each, to two decimal places.
Approach
For each solution, use to find the volume of solution E, then subtract this from 20.00 cm to find the volume of water.
Step-by-Step Reasoning
- Solution 2: . cm. Water = cm.
- Solution 3: . cm. Water = cm.
- Solution 4: . cm. Water = cm.
- Solution 5: . cm. Water = cm.
- Solution 6: . This is the same as solution E, so cm and water = cm.
Key Takeaways
In dilution series, the sum of the stock solution volume and solvent volume must equal the total required volume. Always check that the volumes add up correctly.
Common Mistakes
- Calculating the volume of water instead of the stock solution, or vice versa.
- Forgetting to give volumes to two decimal places as requested (e.g., writing 4 instead of 4.00).
- Not ensuring the volumes sum to exactly 20.00 cm.
Things to Be Careful About
- The table already provides the target concentrations; use those directly. The volumes must be given to two decimal places (e.g., 4.00, not 4).
Answer
absorbance
absorbance
Background Concept
In an experiment, the independent variable is the one that is deliberately changed or controlled (here, the concentration of crystal violet). The dependent variable is the one that is measured or observed in response to changes in the independent variable (here, the absorbance measured by the colorimeter).
Understanding the Question
The student is preparing solutions of different known concentrations and measuring their absorbance. We need to identify which quantity is the dependent variable.
Approach
The concentration is the independent variable (set by the student). The absorbance is the value being measured using the colorimeter for each concentration. Therefore, absorbance is the dependent variable.
Key Takeaways
The dependent variable is what you measure; the independent variable is what you change.
Common Mistakes
- Confusing independent and dependent variables.
- Stating 'concentration' as the dependent variable.
Things to Be Careful About
- Be precise: 'absorbance' is the correct term, not 'absorbance of light' or 'colorimeter reading' (though these might be accepted, stick to the precise term used in the question).
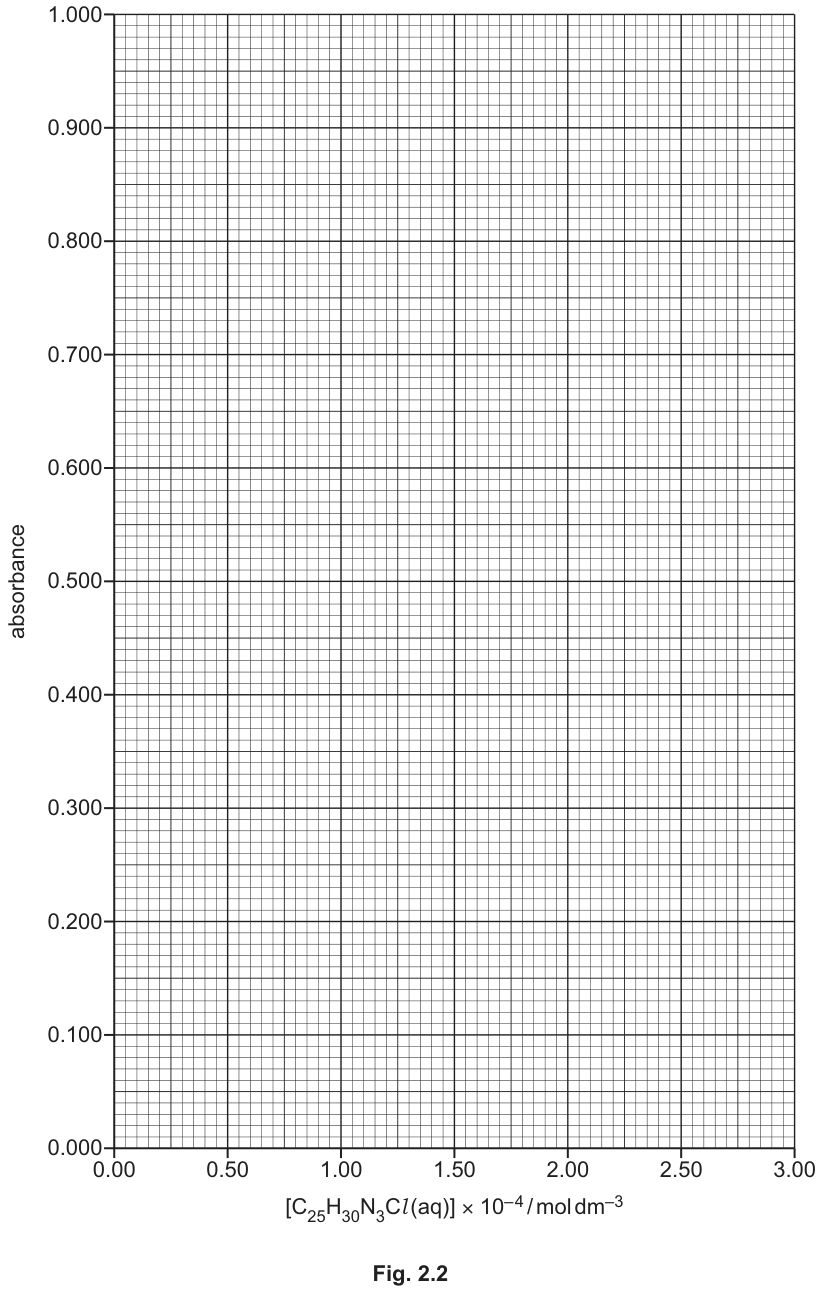
Plot a graph of absorbance against on the grid in Fig. 2.2.
Use a cross () to plot each data point.
Draw a straight line of best fit.
Answer
See diagram
Background Concept
A calibration graph (or working curve) relates the measured absorbance to the known concentration of a series of standard solutions. According to the Beer-Lambert law, absorbance is directly proportional to concentration, so the graph should be a straight line passing through the origin (0,0). A line of best fit should have an equal number of points above and below it, and should not necessarily pass through every point.
Understanding the Question
We are given a blank grid (Fig. 2.2) and a table of concentrations (x-axis) and absorbances (y-axis) for solutions 1 to 6. We need to plot the data points using crosses (×) and draw a straight line of best fit.
Approach
- Plot the six data points from the table on the given grid.
- Draw a straight line that best represents the trend, ensuring it passes through or near the origin (0,0) and the point (2.50, 0.860).
Step-by-Step Reasoning
- Plotting points:
- (0.00, 0.000)
- (0.50, 0.191)
- (1.00, 0.270) — Note: This point is slightly below the expected line (anomalous).
- (1.50, 0.545)
- (2.00, 0.711)
- (2.50, 0.860)
- Line of best fit: Draw a straight line that goes through (0,0) and roughly through the other points, balancing the points above and below the line. The line should have a positive gradient.
Key Takeaways
Calibration graphs for colorimetry should be linear and pass through the origin. The line of best fit minimizes the overall distance to all data points.
Common Mistakes
- Plotting points incorrectly (e.g., swapping x and y axes).
- Drawing a curve or connecting the dots with straight line segments instead of a single straight line of best fit.
- Forcing the line through the anomalous point (solution 3) instead of allowing it to be an outlier.
Things to Be Careful About
- Use crosses (×) for plotting, not dots or circles.
- The line must be straight, not curved.
- Ensure the axes are used correctly: concentration on the x-axis, absorbance on the y-axis.
Circle the point on the graph you consider to be most anomalous.
Suggest one reason why this anomaly may have occurred during this experimental procedure.
Assume no error was made in the measurement of absorbance.
Answer
Anomalous point: Solution 3 (concentration mol dm, absorbance 0.270).
Reason: The volume of distilled water added to the mixture was too large (or the volume of solution E / crystal violet solution added was too small).
Solution 3; volume of water too large
Background Concept
In a calibration graph, most points should fall on or very close to the line of best fit. A point that deviates significantly from this line is considered anomalous. Anomalies can arise from experimental errors, such as incorrect volumetric measurements, contamination, or incomplete dissolution.
Understanding the Question
We need to identify the most anomalous point on the graph we just plotted and suggest a reason for it, assuming the absorbance measurement itself was correct. This means the error occurred during the preparation of the solutions.
Approach
- Look at the plotted points and the line of best fit. Identify the point furthest from the line.
- Consider how the solutions were prepared (dilutions of solution E with water). An error in measuring the volumes of solution E or water would change the actual concentration.
Step-by-Step Reasoning
- Identifying the anomaly: Looking at the data, solution 3 has a concentration of mol dm. Based on the linearity (e.g., solution 2 has 0.50 x 10^-4 with absorbance 0.191, so 1.00 x 10^-4 should have ~0.382), the measured absorbance of 0.270 is significantly lower than expected. This point is the most anomalous.
- Reasoning about the error: If the absorbance is lower than expected for a given concentration, the actual concentration of crystal violet in the cuvette was lower than intended. This could happen if:
- Too much distilled water was added to the mixture (making it more dilute than calculated).
- Too little of solution E (the stock crystal violet solution) was added to the mixture.
- The mark scheme accepts either of these equivalent volumetric errors.
Key Takeaways
Anomalous results in dilution series often stem from volumetric errors. If the measured response is lower than expected, the solution was more dilute than intended.
Common Mistakes
- Circling a point that is actually on the line (e.g., solution 4 or 5).
- Suggesting 'human error' or 'inaccurate colorimeter' (the question states to assume no error in absorbance measurement).
- Suggesting the solid didn't dissolve (this would affect solution D, not the dilutions from solution E).
Things to Be Careful About
- The question asks for one reason. Give a clear, specific volumetric error.
- Ensure the reason is consistent with the direction of the anomaly (absorbance too low -> concentration too low -> too much water or too little stock solution).
Answer
Absorbance is directly proportional to the concentration of CHNCl(aq) (within experimental error).
directly proportional
Background Concept
The Beer-Lambert law states that the absorbance of a solution is directly proportional to the concentration of the absorbing species and the path length of the light. For a fixed path length (the colorimeter cuvette), absorbance is directly proportional to concentration: .
Understanding the Question
The graph of absorbance against concentration is a straight line passing through the origin. We need to state the mathematical relationship between these two variables.
Approach
A straight line through the origin indicates direct proportionality. State this relationship clearly.
Step-by-Step Reasoning
- The graph is a straight line.
- The line passes through (0,0), meaning zero concentration gives zero absorbance.
- Therefore, absorbance is directly proportional to concentration.
- It is good practice to add 'within experimental error' to acknowledge that real data points may not fall perfectly on the line.
Key Takeaways
A linear calibration graph through the origin indicates direct proportionality between the measured quantity (absorbance) and the independent variable (concentration).
Common Mistakes
- Saying 'absorbance is equal to concentration' (missing 'proportional to').
- Forgetting to mention the line passes through the origin or that it is a direct relationship.
Things to Be Careful About
- Use precise terminology: 'directly proportional', not just 'related' or 'increases with'.
Suggest how the student could improve the reliability of the data obtained in the experiment in (c).
Answer
Repeat the preparation and measurement of solution 3 (the solution giving the anomalous result) to obtain a mean absorbance or confirm the result.
Repeat solution 3
Background Concept
Reliability of experimental data is improved by repeating measurements and calculating a mean. When an anomalous result is identified, repeating that specific experiment helps to determine if the anomaly was a one-off error or a systematic issue.
Understanding the Question
We identified solution 3 as having an anomalous absorbance. The question asks how to improve the reliability of the data obtained in the experiment.
Approach
The most direct improvement when an anomaly is found is to repeat the procedure for that specific anomalous point.
Step-by-Step Reasoning
- Solution 3 gave an absorbance (0.270) that did not fit the calibration line.
- To improve reliability, the student should repeat the preparation of solution 3 (measuring the volumes of solution E and water again) and remeasure its absorbance.
- This will provide a second (and potentially third) data point for that concentration, allowing the student to calculate a mean and identify if the original result was truly anomalous or if there was a persistent error.
Key Takeaways
Repeating anomalous results is a key method for improving data reliability and identifying random errors.
Common Mistakes
- Suggesting 'use a more accurate colorimeter' (this doesn't address the volumetric error that caused the anomaly).
- Suggesting 'repeat the whole experiment' (too vague; specifying the anomalous solution is better).
- Suggesting 'use a larger range of concentrations' (this improves the calibration curve but doesn't fix the reliability of the anomalous point).
Things to Be Careful About
- The improvement must be specific and relevant to the anomaly identified in the previous part. Mentioning 'solution 3' or 'the anomalous result' shows clear understanding.
The student carries out a further experiment to examine the kinetics of the reaction between crystal violet, , and aqueous sodium hydroxide, .
The disappearance of the purple colour as the reaction proceeds can be monitored by measuring how the absorbance of light by the mixture changes using a colorimeter.
The student mixes of solution 6 with of , a large excess, and immediately starts the stopwatch.
The resulting mixture is then placed in a colorimeter. The absorbance of this mixture is measured every 100 seconds after starting the stop-watch.
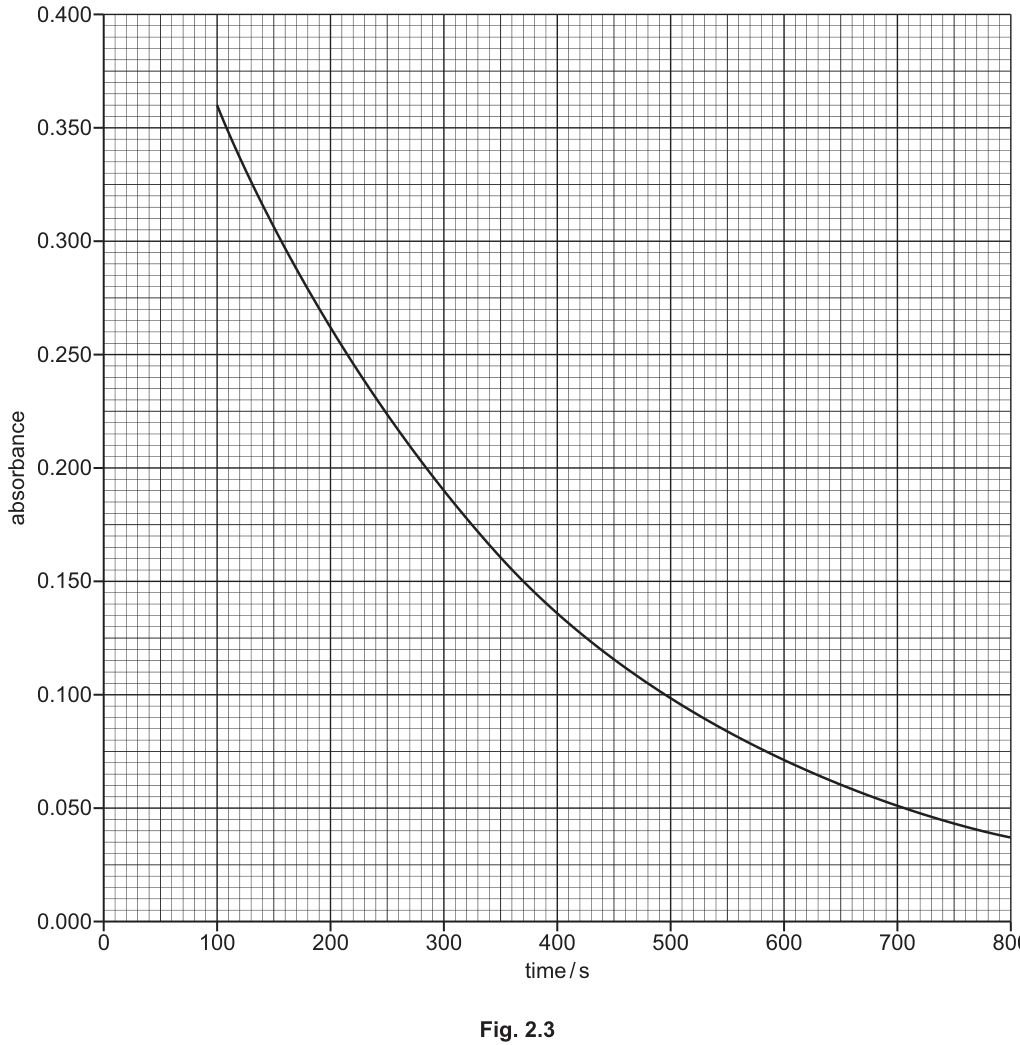
Fig. 2.3 shows a graph of the student’s results.
Suggest why it is not possible for the student to measure the absorbance of the mixture at .
Answer
At s, the solutions (solution 6 and NaOH) are still being mixed, so the mixture is not yet homogeneous and a reading cannot be taken.
solutions being mixed
Background Concept
In kinetics experiments, the reaction starts the moment the reactants are mixed. However, there is a practical delay between mixing the solutions, transferring the mixture to the colorimeter cuvette, and taking the first absorbance reading. This means the exact time (the moment of mixing) cannot be measured.
Understanding the Question
The student mixes 5 cm of solution 6 with 5 cm of NaOH and immediately starts the stopwatch. They then place the mixture in the colorimeter. We need to explain why absorbance cannot be measured at exactly s.
Approach
Consider the physical steps involved: mixing, transferring, and measuring. At , the mixing is just happening.
Step-by-Step Reasoning
- The reaction begins as soon as the crystal violet and NaOH solutions come into contact.
- At s, the student is in the process of mixing the two solutions.
- The mixture is not yet homogeneous, and it takes time to transfer it to the colorimeter and allow it to stabilize.
- Therefore, a valid absorbance reading cannot be taken at the exact moment of mixing ().
Key Takeaways
Kinetics experiments always have a practical delay between mixing and the first measurement. The first data point is taken at a time .
Common Mistakes
- Saying 'the reaction hasn't started yet' (it has started immediately upon mixing).
- Saying 'the colorimeter is not ready' (not a valid chemical reason).
Things to Be Careful About
- Focus on the physical act of mixing and the time required to transfer the sample. The key phrase is 'solutions are being mixed'.
Use the graph in Fig. 2.3 to find the half-life, , starting at .
State the coordinates of both points on the line of best fit used in your calculation.
coordinates 1 .............................. coordinates 2 ..............................
half-life .............................. s
Answer
Coordinates 1: (100, 0.360)
Coordinates 2: (315, 0.180) (accept 310 to 320)
half-life: 215 s (accept 210 to 220)
215 s
Background Concept
The half-life () of a reaction is the time taken for the concentration of a reactant to fall to half of its initial value. Since absorbance is directly proportional to concentration (from part d), we can use absorbance to determine the half-life. We find the time at which the absorbance has halved from a starting point.
Understanding the Question
We are given a graph of absorbance against time for the reaction. We need to find the half-life starting at s. We must state the coordinates of the two points used and calculate the half-life.
Approach
- Find the absorbance at s.
- Calculate half of this absorbance value.
- Find the time on the graph where the absorbance equals this half-value.
- The half-life is the difference between this new time and the starting time (100 s).
Step-by-Step Reasoning
- Step 1: At s, read the absorbance from the line of best fit. The graph shows an absorbance of approximately 0.360. So, coordinates 1 = (100, 0.360).
- Step 2: Half of 0.360 is 0.180.
- Step 3: Find the time where absorbance = 0.180 on the line of best fit. Reading across from 0.180 on the y-axis to the curve and down to the x-axis gives approximately 315 s (accept 310 to 320 s). So, coordinates 2 = (315, 0.180).
- Step 4: Calculate the half-life: (accept 210 to 220 s based on reading variations).
Key Takeaways
When using a graph to find half-life, always state the coordinates of the two points used for the calculation. Half-life is a time interval (), not an absolute time.
Common Mistakes
- Reading the absorbance directly from the data points instead of the line of best fit.
- Forgetting to subtract the starting time (100 s) to get the half-life duration (giving 315 s instead of 215 s).
- Not stating the coordinates clearly.
Things to Be Careful About
- Use the line of best fit, not the raw data points (if plotted, though here the curve is given).
- Ensure coordinates are in the format (time, absorbance) or clearly labeled.
- The half-life must be in seconds.
Another student repeats the experiment at a different temperature and measures two half-life values. The values obtained are and .
Use these values to deduce the order of the reaction with respect to .
Explain your answer.
Answer
Order: First order.
Explanation: The half-life is constant (within experimental error) regardless of the concentration (or temperature, in this context, the key is the constant half-life at a given concentration for a first-order reaction).
first order; half-lives are constant
Background Concept
The order of a reaction with respect to a reactant can be determined by examining how the half-life changes with concentration:
- Zero order: Half-life decreases as concentration decreases ().
- First order: Half-life is constant and independent of concentration ().
- Second order: Half-life increases as concentration decreases ().
Understanding the Question
Another student repeated the experiment at a different temperature and found two half-life values: 420 s and 425 s. These values are very close (constant within experimental error). We need to deduce the order with respect to crystal violet and explain.
Approach
Recognize that constant half-life is the defining characteristic of a first-order reaction. State the order and provide the reasoning.
Step-by-Step Reasoning
- The two half-life values obtained (420 s and 425 s) are approximately equal.
- A constant half-life (independent of the initial concentration of the reactant) is a characteristic feature of a first-order reaction.
- Therefore, the reaction is first order with respect to crystal violet.
- The explanation is simply that the half-lives are constant (within experimental error).
Key Takeaways
Constant half-life = first order. This is a fundamental relationship in chemical kinetics that allows quick determination of reaction order from half-life data.
Common Mistakes
- Saying 'the rate is constant' (that would be zero order).
- Not explaining why it is first order (must mention constant half-life).
- Confusing the effect of temperature on half-life with the definition of reaction order (the key is that for a first-order reaction, at any given concentration, the half-life is constant; the question implies these are half-lives at different starting concentrations or just generally constant behavior).
Things to Be Careful About
- The question asks to 'deduce the order' AND 'explain your answer'. Both parts are required for the mark.
- Use the exact terminology: 'first order' and 'half-lives are constant'.