Chemistry 9701/51 — October/November 2024
Cambridge A-Level · Planning, Analysis and Evaluation · worked solutions for every part, with the mark scheme
Topics Planning · Analysis, Conclusions and Evaluation
A student uses the following method to determine the percentage by mass of the painkiller aspirin, , in some tablets.
step 1 Grind five tablets into a powder.
step 2 Use a weighing boat to accurately weigh by difference approximately of powdered tablets into a pear-shaped flask containing anti-bumping granules.
step 3 Add of aqueous sodium hydroxide, , to the pear-shaped flask, forming mixture A.
step 4 Reflux mixture A for 20 minutes.
step 5 Allow mixture A to cool and then filter into a small beaker. Label the filtrate solution B.
step 6 Add of alkaline aqueous iodine to solution B and leave to stand for 1 hour. A precipitate, C, , will form.
step 7 Filter the resulting mixture under reduced pressure. Wash the residue, C, with a small volume of cold distilled water.
step 8 Allow solid C to dry.
step 9 Weigh solid C and record its mass.
Alkaline aqueous iodine is irritating to the skin and eyes.
Identify an appropriate precaution, other than eye protection and a lab coat, that the student should take when using alkaline aqueous iodine.
Answer
Wear chemically resistant gloves.
Wear chemically resistant gloves.
Background Concept
When working with chemicals that are irritating to the skin or eyes, standard laboratory personal protective equipment (PPE) is required. While a lab coat protects clothing and general safety goggles protect the eyes, skin protection is specifically needed when handling irritating or corrosive substances that could cause dermatitis or chemical burns.
Understanding the Question
The question asks for a specific precaution when handling alkaline aqueous iodine, excluding eye protection and a lab coat. The mark scheme notes that the iodine is irritating, so the precaution must directly address skin contact.
Approach
Identify the hazard (irritation to skin and eyes) and select the appropriate PPE that is not already excluded (eye protection and lab coat). Gloves are the standard barrier for skin protection against chemical irritation.
Step-by-Step Reasoning
- Identify the hazard: The question states alkaline aqueous iodine is irritating to the skin and eyes.
- Exclude given PPE: Eye protection (safety goggles) and a lab coat are already mentioned.
- Select appropriate PPE: Chemically resistant gloves (e.g., nitrile) are required to prevent the irritating solution from contacting the skin.
Key Takeaways
Always match PPE to the specific hazard. For skin-irritating chemicals, chemically resistant gloves are essential in addition to standard eye and clothing protection.
Common Mistakes
- Stating 'wear gloves' without specifying 'chemically resistant' or 'nitrile' (standard cotton gloves offer little protection against chemicals).
- Suggesting 'wear a face shield' (this is for eye/face protection, which is already excluded).
Things to Be Careful About
Be precise with terminology. 'Gloves' alone may not score if the examiner is looking for 'chemically resistant' or 'rubber' or 'nitrile' to distinguish from laboratory cotton gloves.
Describe how the student should carry out step 2. Include a results table, with appropriate headings, for the student to fill in.
Answer
Description:
- Measure the mass of the weighing boat with the powdered tablets on it.
- Transfer the powder to the pear-shaped flask.
- Measure the mass of the weighing boat with the remaining solid (residue).
- Calculate the mass of solid transferred by subtracting the second mass from the first.
Results Table:
| Mass of weighing boat + solid before transfer / g | Mass of weighing boat + residue after transfer / g | Mass of solid transferred / g |
|---|---|---|
Working
Mass transferred = (Mass of boat + solid before) - (Mass of boat + residue after)
Answer
See description and table above.
Weigh by difference: measure mass of boat + solid, transfer to flask, measure mass of boat + residue. Table must have unambiguous headings and units (e.g., / g) for: mass of boat + solid before transfer, mass of boat + residue after transfer, and mass of solid transferred.
Background Concept
Weighing by difference is a standard quantitative technique used to transfer a specific mass of solid into a vessel without losing any material on the weighing container. It is more accurate than trying to weigh a solid directly into the vessel, as some powder may stick to the boat or spill.
Understanding the Question
The student needs to accurately weigh approximately 0.4 g of powdered tablets into a flask. The question asks for a description of step 2 and a results table to record the data.
Approach
Describe the weighing by difference method: weigh the container with the solid, transfer the solid, then weigh the container with the remainder. The difference is the mass transferred. Construct a table with clear headings and units to record these three values.
Step-by-Step Reasoning
- Weighing by difference: Place the weighing boat with the powder on the balance and record the mass (boat + solid).
- Transfer: Carefully pour the powder into the pear-shaped flask.
- Weigh residue: Place the empty (or partially empty) weighing boat back on the balance and record the mass (boat + residue).
- Calculate: Mass of solid transferred = Initial mass - Final mass.
- Table format: The table must have three columns (or rows) with unambiguous headings. Each heading must include the quantity and its unit (e.g., 'Mass of weighing boat + solid before transfer / g').
Key Takeaways
Weighing by difference is essential for accurate transfer of solids. Results tables must always include units in the headings, not just in the data rows.
Common Mistakes
- Describing weighing directly into the flask (loses accuracy due to spillage/sticking).
- Forgetting units in the table headings (e.g., writing 'Mass of solid' instead of 'Mass of solid / g').
- Not including the mass of the boat in the headings (the balance measures boat + solid, not just solid).
Things to Be Careful About
Ensure the table headings are unambiguous. 'Mass of solid' is not acceptable because the balance does not measure it directly; it measures 'Mass of weighing boat + solid'. The unit must be part of the heading, not a separate column.
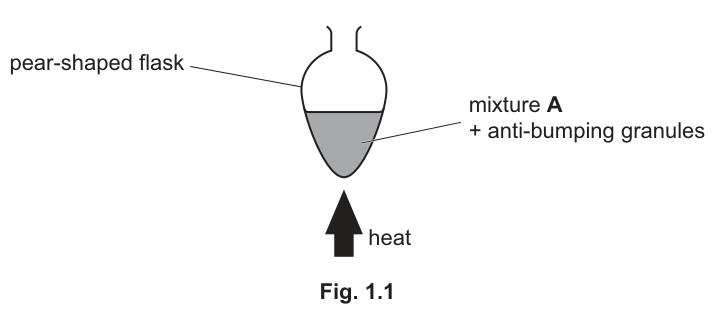
Complete Fig. 1.1 to show how step 4 is carried out in the laboratory.
Label your diagram fully.
Answer
Working
Step 4 is refluxing mixture A. This requires a vertical condenser attached to the flask to prevent loss of volatile components.
Answer
See diagram above.
A vertical Liebig condenser attached to the top of the pear-shaped flask, with cold water entering at the bottom inlet and exiting at the top outlet.
Background Concept
Refluxing involves heating a reaction mixture to its boiling point while condensing the vapours and returning them to the flask. This allows prolonged heating without loss of solvent or volatile reactants/products. A Liebig condenser is typically used, consisting of an inner tube through which vapours pass and an outer jacket through which cooling water flows.
Understanding the Question
The student is refluxing mixture A (containing NaOH and aspirin) for 20 minutes. Figure 1.1 shows a pear-shaped flask with heat applied. The student must complete the diagram by adding the condenser and labeling the water flow.
Approach
Draw a vertical condenser on top of the flask. Label the water inlet at the bottom (to ensure the jacket fills completely) and the water outlet at the top.
Step-by-Step Reasoning
- Condenser placement: Attach a Liebig condenser vertically to the top of the pear-shaped flask. It should have an outer jacket.
- Water flow direction: Cold water must enter at the bottom (lower tap) and exit at the top (upper tap). This counter-current flow ensures the condenser jacket is always full of cold water, maximizing cooling efficiency.
- Labels: Label the condenser, water inlet (bottom), and water outlet (top).
Key Takeaways
In reflux setups, water always enters at the bottom and exits at the top of the condenser to ensure the jacket is completely filled with cooling water.
Common Mistakes
- Drawing the condenser at an angle (it must be vertical for reflux).
- Reversing the water flow (in at top, out at bottom), which can lead to an empty jacket and poor cooling.
- Forgetting to label the water inlet and outlet.
Things to Be Careful About
Ensure the condenser is drawn with an outer jacket. Simply drawing a tube is not sufficient. The labels 'cold water in' and 'cold water out' (or 'water inlet' and 'water outlet') must be clear.
The student uses a measuring cylinder to measure the volume of alkaline aqueous iodine in step 6. Suggest why this is a suitable piece of apparatus to use.
Answer
The alkaline aqueous iodine is used in excess, so a precise volume is not required.
The alkaline aqueous iodine is in excess, so high precision is not needed.
Background Concept
Different pieces of volumetric apparatus have different precisions. A volumetric pipette or burette is used when an exact volume is required (e.g., for a titration or to determine a concentration). A measuring cylinder is less precise but faster and suitable when an approximate volume is sufficient, such as when a reagent is in excess.
Understanding the Question
The student uses a measuring cylinder to add 30 cm³ of alkaline aqueous iodine. The question asks why this is suitable.
Approach
Identify the role of iodine in the reaction. Since it is added in a fixed volume to ensure complete reaction with the limited reactant, it is in excess. Therefore, high precision is not necessary.
Step-by-Step Reasoning
- Role of iodine: Iodine reacts with the salicylate ions (from aspirin hydrolysis) to form the precipitate. The amount of salicylate is limited by the amount of aspirin in the tablets.
- Excess reagent: To ensure all salicylate reacts, iodine is added in excess.
- Apparatus choice: Since iodine is in excess, its exact volume does not affect the stoichiometry of the reaction. A measuring cylinder, which has lower precision than a volumetric pipette, is sufficient.
Key Takeaways
Use high-precision apparatus (burette, pipette) when exact volumes are needed for stoichiometry. Use less precise apparatus (measuring cylinder) when reagents are in excess.
Common Mistakes
- Stating 'it is easy to use' (not a chemical reason).
- Forgetting to mention that iodine is in excess.
Things to Be Careful About
Focus on the chemical reason: the reagent is in excess, so precision is not critical.
Answer
To ensure the reaction between the salicylate ions and iodine goes to completion.
To ensure the reaction is complete.
Background Concept
Some reactions, particularly precipitation reactions or those involving complex formation, may be slow at room temperature. Allowing the mixture to stand ensures that all reactants are fully consumed, leading to a maximum yield of product.
Understanding the Question
After adding iodine to solution B, the mixture is left to stand for 1 hour. The question asks why.
Approach
Explain that the reaction may be slow, and leaving it allows it to reach completion, ensuring all the limiting reactant (salicylate ions) is converted to the precipitate.
Step-by-Step Reasoning
- Reaction kinetics: The reaction between salicylate ions and iodine (a halogenation reaction) may not be instantaneous at room temperature.
- Complete reaction: Leaving the mixture for 1 hour provides sufficient time for the reaction to go to completion.
- Accuracy: If the reaction is not complete, less precipitate will form, leading to an underestimation of the aspirin content.
Key Takeaways
Allowing time for a reaction to complete is crucial for accurate quantitative analysis, especially for slow reactions.
Common Mistakes
- Stating 'to let it cool down' (the mixture is already cool from step 5).
- Not mentioning that the reaction needs to be complete.
Things to Be Careful About
Be specific: 'ensure the reaction is complete' or 'allow sufficient time for the precipitate to form'.
Answer
To remove soluble substances (impurities) such as excess iodine, sodium hydroxide, sodium iodide, or sodium hydrogencarbonate from the surface of the precipitate.
To remove soluble impurities (e.g., excess iodine, sodium hydroxide, sodium iodide) from the precipitate.
Background Concept
After filtering a precipitate, the solid residue is often coated with the mother liquor (the solution from which it precipitated). This mother liquor contains soluble reactants, products, and by-products. Washing the precipitate with a suitable solvent (usually cold distilled water) removes these soluble impurities.
Understanding the Question
In step 7, the residue (solid C) is washed with cold distilled water. The question asks why.
Approach
Explain that washing removes soluble substances that would otherwise remain with the precipitate and add to its mass, causing an error.
Step-by-Step Reasoning
- Impurities: The precipitate is mixed with solution B, which contains excess NaOH, NaI, NaHCO₃, and unreacted iodine.
- Washing: Cold distilled water dissolves and removes these soluble substances.
- Accuracy: If not washed, the dried solid would include these impurities, leading to an overestimation of the mass of solid C and thus an overestimation of aspirin content.
Key Takeaways
Washing a precipitate is essential to remove soluble impurities and ensure an accurate mass measurement of the pure product.
Common Mistakes
- Stating 'to clean the precipitate' (too vague).
- Not specifying that the impurities are soluble substances.
Things to Be Careful About
Mention 'soluble substances' or give specific examples like 'excess iodine' or 'sodium hydroxide'.
Answer
Solid C is more soluble in hot water, which would lead to loss of product and an inaccurate (low) mass.
The residue is less soluble in cold water; hot water would dissolve some of the product.
Background Concept
The solubility of most solid ionic compounds increases with temperature. When washing a precipitate, it is crucial to use a solvent in which the precipitate is least soluble to minimize product loss.
Understanding the Question
The question asks why cold distilled water is used instead of hot distilled water in step 7.
Approach
Explain that hot water would dissolve some of the precipitate (solid C), reducing the yield and causing a systematic error.
Step-by-Step Reasoning
- Solubility and temperature: Most solids, including , are more soluble at higher temperatures.
- Product loss: If hot water is used, some of the precipitate will dissolve and be washed away.
- Error: This leads to a lower mass of solid C, resulting in an underestimation of the aspirin content.
Key Takeaways
Always use cold solvent when washing a precipitate to minimize dissolution and product loss.
Common Mistakes
- Stating 'hot water is dangerous' (not the chemical reason).
- Not explaining that the product would dissolve.
Things to Be Careful About
Focus on the solubility of the precipitate: 'solid C is more soluble in hot water' or 'to prevent loss of product due to dissolution'.
The equation for the reaction between aspirin, , and , which takes place in step 4, is shown.
The equation for the reaction in which solid C, , is formed in step 6 is shown.
The student's results are shown in Table 1.1.
Table 1.1
| mass of powdered tablets added to the pear-shaped flask in step 2 | |
| mass of dry recorded in step 9 |
Working
Answer
1.111 x 10^-3 mol
Background Concept
The amount of a substance in moles is calculated using the equation: , where is the amount in moles, is the mass in grams, and is the relative formula mass.
Understanding the Question
The student collected 0.764 g of solid C, , with an of 687.6. Calculate the amount in moles.
Approach
Apply the mole equation directly.
Step-by-Step Reasoning
- Identify given values: Mass g, .
- Apply equation: .
- Calculate: mol mol.
Key Takeaways
Always use the correct formula and ensure units are consistent (mass in grams, is dimensionless).
Common Mistakes
- Using the wrong (e.g., for aspirin instead of solid C).
- Incorrect significant figures (use at least 3 or 4 for intermediate calculations).
Things to Be Careful About
Carry forward the unrounded value to subsequent calculations to avoid rounding errors.
Use your answer to (i) to calculate the mass, in g, of in the powdered tablets added to the flask in step 2.
Working
From the equations:
- 1 mol of is produced from 2 mol of .
- 2 mol of is produced from 1 mol of .
Therefore, 1 mol of corresponds to 2 mol of .
Answer
0.400 g
Background Concept
Stoichiometry allows us to relate the amounts of reactants and products using balanced chemical equations. By following the mole ratios through a series of reactions, we can determine the amount of an initial reactant from the mass of a final product.
Understanding the Question
Using the answer from (e)(i), calculate the mass of aspirin () in the tablets.
Approach
- Use the mole ratio from the second equation to find moles of salicylate ion.
- Use the mole ratio from the first equation to find moles of aspirin.
- Calculate the mass of aspirin using its .
Step-by-Step Reasoning
- Second equation: . Ratio is 2:1.
Moles of mol. - First equation: . Ratio is 1:1.
Moles of mol. - Mass calculation: .
Mass g.
Key Takeaways
Chain stoichiometric calculations carefully, tracking the mole ratios through each equation.
Common Mistakes
- Using the wrong mole ratio (e.g., 1:2 instead of 2:1).
- Forgetting to calculate the of aspirin correctly.
- Rounding intermediate values too early.
Things to Be Careful About
Ensure the mole ratios are taken from the correct equations and in the correct direction. Carry forward unrounded values.
Use your answer to (ii) to calculate the percentage by mass of aspirin, , in the tablets.
If you were unable to obtain an answer to (ii) you may use for the mass of . This is not the correct value.
Working
Answer
97.8%
Background Concept
Percentage by mass is calculated as the mass of the component divided by the total mass of the mixture, multiplied by 100.
Understanding the Question
Calculate the percentage by mass of aspirin in the tablets using the mass of aspirin from (e)(ii) and the mass of powdered tablets from the table (0.409 g).
Approach
Apply the percentage by mass formula.
Step-by-Step Reasoning
- Identify values: Mass of aspirin = 0.400 g, mass of tablets = 0.409 g.
- Apply formula: .
- Calculate: .
Key Takeaways
Percentage calculations are straightforward, but ensure the correct masses are used.
Common Mistakes
- Using the wrong mass for the tablets (e.g., 0.4 g instead of 0.409 g).
- Forgetting to multiply by 100.
Things to Be Careful About
Use the exact value from the data table (0.409 g), not the approximate value mentioned in the method (0.4 g). Round to 3 significant figures.
Another student follows the same method but does not allow solid C to dry completely in step 8.
State and explain the effect that this has on the calculated percentage by mass of aspirin, , in the tablets.
Answer
If solid C is not completely dry, its measured mass will be greater than the true mass of the dry solid.
This will lead to a calculated amount of solid C that is too high, which in turn leads to a calculated mass of aspirin that is too high, and finally a percentage by mass of aspirin that is greater than the true value.
The mass of solid C would be greater, leading to a calculated percentage by mass of aspirin that is greater than the true value.
Background Concept
In quantitative analysis, errors in intermediate measurements propagate through the calculation. If a mass is measured incorrectly (e.g., due to moisture), the final calculated value will be affected in the same direction.
Understanding the Question
The student does not allow solid C to dry completely. State and explain the effect on the calculated percentage by mass of aspirin.
Approach
Trace the error through the calculation: higher mass of C -> higher moles of C -> higher moles of aspirin -> higher mass of aspirin -> higher percentage.
Step-by-Step Reasoning
- Error in mass: Wet solid C has a higher mass than dry solid C (due to water).
- Moles of C: . Higher mass leads to higher calculated moles of C.
- Moles of aspirin: Moles of aspirin are proportional to moles of C (ratio 2:1). Higher moles of C leads to higher calculated moles of aspirin.
- Mass of aspirin: Mass = moles . Higher moles leads to higher calculated mass of aspirin.
- Percentage: Percentage = . Higher mass of aspirin leads to a higher percentage.
Key Takeaways
Errors in mass measurements propagate through stoichiometric calculations. Always ensure precipitates are completely dry before weighing.
Common Mistakes
- Stating 'the percentage would be lower' (wrong direction of error).
- Not explaining the chain of reasoning (mass -> moles -> percentage).
Things to Be Careful About
Be clear about the direction of the error: 'greater than' or 'higher than', not just 'wrong'. Explain the causal chain.
Crystal violet, , is a purple dye.
Some light is absorbed when it passes through .
Absorbance is the proportion of light absorbed at a particular wavelength. This is measured using a colorimeter.
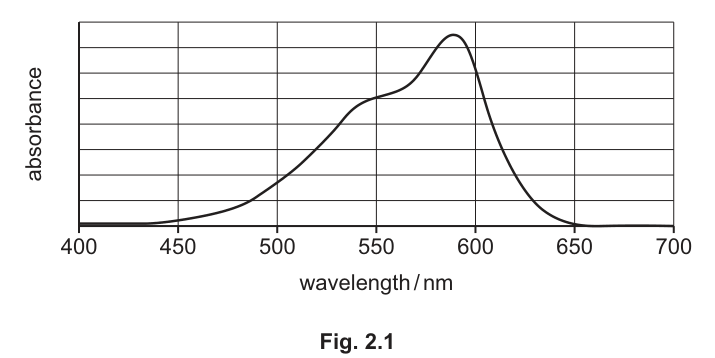
A graph of absorbance against wavelength for is shown in Fig. 2.1.
A student investigates how to determine the concentration of aqueous crystal violet, , using colorimetry.
Suggest the best wavelength of light to use in the colorimeter when measuring the concentration of .
Answer
588 nm
588 nm
Background Concept
In colorimetry, a sample is measured at a wavelength where it absorbs light most strongly. This is typically the wavelength corresponding to the peak of the absorption spectrum (λ_max). Measuring at λ_max provides the maximum sensitivity; a small change in concentration produces the largest possible change in absorbance, minimising the relative error in the concentration determination.
Understanding the Question
The question asks for the best wavelength to use when measuring the concentration of crystal violet using a colorimeter. Fig. 2.1 shows the absorbance spectrum of crystal violet.
Approach
Locate the peak of the curve in Fig. 2.1. The wavelength at the maximum absorbance is the optimal choice for colorimetric measurements.
Step-by-Step Reasoning
- Examine Fig. 2.1, which plots absorbance against wavelength.
- Identify the highest point on the curve (the peak absorbance).
- Read the corresponding value on the x-axis (wavelength / nm).
- The peak is at approximately 588 nm (accepting 589.7 nm if read more precisely).
Key Takeaways
Always choose the wavelength of maximum absorbance (λ_max) for colorimetry to ensure maximum sensitivity and smallest relative error.
Common Mistakes
- Choosing a wavelength on the rising or falling edge of the curve where sensitivity is lower.
- Reading the wavelength from the y-axis instead of the x-axis.
Things to Be Careful About
- Read the value to a reasonable number of significant figures (e.g., 588 nm or 589.7 nm).
Solution D is of .
Calculate the mass of needed to prepare solution D.
Give your answer to three significant figures.
[: , 407.5]
Working
Answer
5.09 g
5.09 g
Background Concept
To prepare a solution of a known concentration, you need to calculate the mass of solute required. This involves using the relationship to find the number of moles, and then to find the mass. Remember that volume must be in dm³ when using concentration in mol dm⁻³.
Understanding the Question
Calculate the mass of crystal violet needed to make 500.0 cm³ of a 2.50 × 10⁻² mol dm⁻³ solution.
Approach
- Convert volume from cm³ to dm³.
- Calculate moles using .
- Calculate mass using .
- Round to three significant figures.
Step-by-Step Reasoning
- Volume .
- Moles .
- Mass .
- To three significant figures, mass = 5.09 g.
Key Takeaways
Always convert volume to dm³ when using concentration in mol dm⁻³. Pay attention to significant figures in the final answer.
Common Mistakes
- Forgetting to convert cm³ to dm³ (using 500 instead of 0.5).
- Rounding too early in the calculation.
Things to Be Careful About
- The question asks for three significant figures. 5.09375 rounds to 5.09, not 5.10.
The student is given a small beaker containing the mass of calculated in (i).
Describe how the student should prepare of solution D.
Include the name and capacity of the key apparatus which should be used and describe how the student should ensure the volume is exactly .
Answer
Add a small volume of distilled water to the beaker and dissolve the solid. Transfer the solution to a 500.0 cm³ volumetric flask, including washings. Make up to the calibration mark with distilled water and mix by inverting the flask.
See answer above
Background Concept
Preparing a standard solution of a precise concentration requires a volumetric flask. The solid is first dissolved in a small amount of solvent, then transferred quantitatively to the flask, and finally the volume is made up to the mark. Washings ensure all solute is transferred.
Understanding the Question
Describe the method to prepare 500.0 cm³ of solution D from the solid calculated in (b)(i). Must include apparatus name/capacity and how to ensure exact volume.
Approach
Describe the standard procedure step-by-step, ensuring all mark scheme points are covered: dissolving, transferring with washings, making up to the mark, and mixing.
Step-by-Step Reasoning
- M1: Add a small volume of distilled water to the beaker containing the solid and stir to dissolve it completely.
- M2: Pour the solution into a 500.0 cm³ volumetric flask. Rinse the beaker and stirring rod with distilled water and add the washings to the flask to ensure all solute is transferred.
- M3: Add distilled water until the bottom of the meniscus sits exactly on the calibration mark. Stopper the flask and invert it several times to mix the solution thoroughly.
Key Takeaways
A volumetric flask is used for precise volume measurements. Washings are essential to ensure quantitative transfer of solute. Making up to the mark and mixing are critical final steps.
Common Mistakes
- Forgetting to mention washings.
- Saying "fill to 500 cm³" instead of "make up to the calibration mark".
- Not mentioning mixing/inverting at the end.
Things to Be Careful About
- Use the exact apparatus name: "volumetric flask" (not just "flask").
- Specify the capacity: "500.0 cm³ volumetric flask".
A small sample of solution D was diluted to form solution E, .
The student prepares solutions 2 to 6 as shown in Table 2.1.
The total volume needed for each of solutions 2 to 6 is .
Each solution is placed into a colorimeter and the absorbance is measured.
Complete Table 2.1 to show the volumes of solution E and distilled water needed to prepare each of the solutions from 2 to 6. Give all volumes to two decimal places.
Table 2.1
| solution | volume of (solution E) / | volume of distilled water / | / | absorbance |
|---|---|---|---|---|
| 1 | 0.00 | 20.00 | 0.00 | 0.000 |
| 2 | 0.191 | |||
| 3 | 0.270 | |||
| 4 | 0.545 | |||
| 5 | 0.711 | |||
| 6 | 0.860 |
Answer
| solution | volume of solution E / cm³ | volume of distilled water / cm³ |
|---|---|---|
| 2 | 4.00 | 16.00 |
| 3 | 8.00 | 12.00 |
| 4 | 12.00 | 8.00 |
| 5 | 16.00 | 4.00 |
| 6 | 20.00 | 0.00 |
See table above
Background Concept
When diluting a solution, the number of moles of solute remains constant. This is expressed by , where and are the concentration and volume of the stock solution, and and are the concentration and volume of the diluted solution. The total volume is fixed at 20.00 cm³.
Understanding the Question
Complete the table showing volumes of solution E (2.50 × 10⁻⁴ mol dm⁻³) and distilled water needed to make 20.00 cm³ of solutions 2–6 with specified concentrations.
Approach
Use to find the volume of solution E needed for each target concentration. Subtract this from 20.00 cm³ to find the volume of water.
Step-by-Step Reasoning
For solution 2: , .
Volume of water .
Similarly:
- Solution 3: , water .
- Solution 4: , water .
- Solution 5: , water .
- Solution 6: , water .
Key Takeaways
Dilution calculations rely on . The volume of solvent added is the total volume minus the volume of stock solution.
Common Mistakes
- Forgetting that the total volume is 20.00 cm³, not just the volume of solution E.
- Not giving volumes to two decimal places as required.
Things to Be Careful About
- Ensure all volumes are given to two decimal places (e.g., 4.00, not 4).
Answer
absorbance
absorbance
Background Concept
In an experiment, the independent variable is the one changed by the experimenter (concentration of crystal violet). The dependent variable is the one measured in response (absorbance). Control variables are kept constant.
Understanding the Question
Identify the dependent variable in the experiment described in (c).
Approach
The student changes the concentration of crystal violet (independent variable) and measures the absorbance. Therefore, absorbance is the dependent variable.
Key Takeaways
The dependent variable is what you measure; the independent variable is what you change.
Common Mistakes
- Confusing independent and dependent variables.
Things to Be Careful About
- Be precise: say "absorbance" or "absorbance of the solution", not just "light".
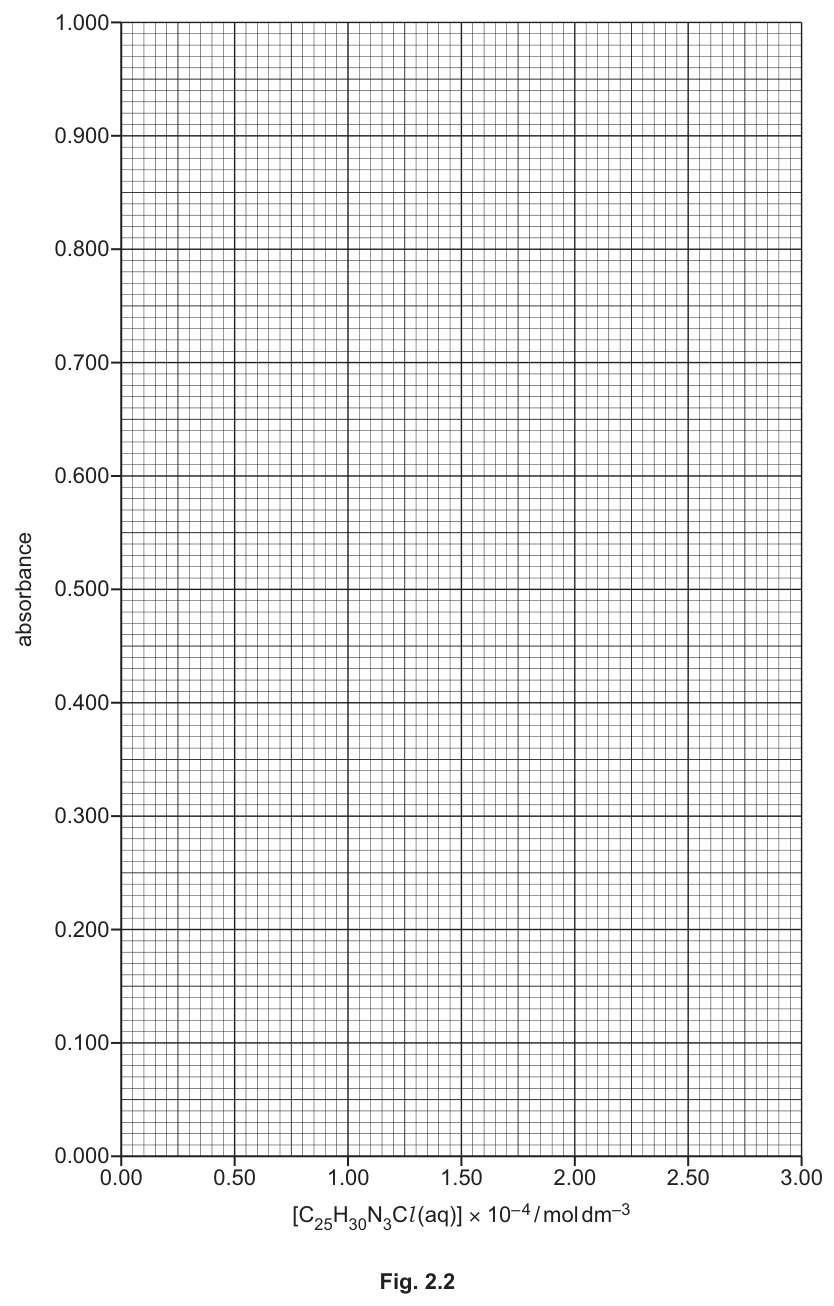
Plot a graph of absorbance against on the grid in Fig. 2.2.
Use a cross () to plot each data point.
Draw a straight line of best fit.
Answer
See diagram
Background Concept
Plotting a calibration curve involves plotting known concentrations against their measured absorbances. A straight line of best fit should pass through the origin (0,0) and have a positive gradient, following Beer-Lambert law. Anomalous points (those not on the line) should be identified and excluded from the line.
Understanding the Question
Plot the data from Table 2.1 on the grid in Fig. 2.2 and draw a straight line of best fit.
Approach
- Plot the six points: (0.00, 0.000), (0.50, 0.191), (1.00, 0.270), (1.50, 0.545), (2.00, 0.711), (2.50, 0.860).
- Draw a straight line through the origin and the majority of points.
- The point (1.00, 0.270) is anomalous (too low) and should not be on the line.
Step-by-Step Reasoning
- Points to plot: x = concentration × 10⁴, y = absorbance.
- Line of best fit: straight line through (0,0) and approximately (2.50, 0.860), passing near (0.50, 0.191), (1.50, 0.545), (2.00, 0.711). The point (1.00, 0.270) is below the line.
Key Takeaways
A line of best fit should represent the trend, not necessarily pass through every point. Anomalous points are excluded.
Common Mistakes
- Plotting points incorrectly (e.g., using the wrong axis or scale).
- Drawing a curved line instead of a straight line.
- Including the anomalous point in the line of best fit.
Things to Be Careful About
- Use crosses (×) for data points as instructed.
- Ensure the line is straight and passes through the origin.
Circle the point on the graph you consider to be most anomalous.
Suggest one reason why this anomaly may have occurred during this experimental procedure.
Assume no error was made in the measurement of absorbance.
Answer
Most anomalous point: solution 3 (concentration , absorbance 0.270).
Reason: Volume of distilled water added to the mixture was too large (or volume of solution E added was too small).
Solution 3 anomalous; water volume too large or solution E volume too small
Background Concept
An anomalous result is a data point that does not fit the general trend of the data. In a calibration curve, this usually indicates a procedural error during preparation or measurement. Since the question states no error was made in measuring absorbance, the error must be in preparing the solution.
Understanding the Question
Circle the anomalous point on the graph and suggest one reason for it, assuming absorbance measurement was correct.
Approach
- Look at the graph: the point at (1.00, 0.270) is significantly below the line of best fit.
- Since absorbance is lower than expected for this concentration, the actual concentration in the colorimeter must have been lower than intended.
- This could happen if too much water was added or too little solution E was added during preparation.
Step-by-Step Reasoning
- The point for solution 3 (1.00 × 10⁻⁴ mol dm⁻³, 0.270) is clearly below the line.
- A lower absorbance means lower concentration in the cuvette.
- During dilution, if the volume of solution E was measured too small (e.g., using a pipette incorrectly) or the volume of water was too large (e.g., using a measuring cylinder instead of a pipette), the final concentration would be lower than 1.00 × 10⁻⁴ mol dm⁻³.
Key Takeaways
Anomalous points can arise from errors in preparing solutions (volumetric errors) or measuring instruments. Always consider both possibilities.
Common Mistakes
- Suggesting "human error" or "not accurate" without being specific.
- Suggesting an error in absorbance measurement when the question says to assume there was none.
Things to Be Careful About
- Be specific about the error: "volume of water too large" or "volume of solution E too small".
Answer
Absorbance is directly proportional to the concentration of crystal violet (within experimental error).
absorbance is directly proportional to concentration
Background Concept
Beer-Lambert law states that absorbance is directly proportional to concentration for a given path length and wavelength. A graph of absorbance against concentration that is a straight line through the origin confirms this relationship.
Understanding the Question
State the relationship between concentration and absorbance based on the graph.
Approach
The graph is a straight line passing through the origin (0,0). This indicates direct proportionality.
Step-by-Step Reasoning
- The line of best fit is straight and passes through (0,0).
- Therefore, absorbance ∝ concentration.
- Add "within experimental error" to be precise, as real data always has some scatter.
Key Takeaways
A straight line through the origin on a graph indicates direct proportionality.
Common Mistakes
- Saying "absorbance increases with concentration" without specifying direct proportionality.
- Forgetting to mention "within experimental error".
Things to Be Careful About
- Use the term "directly proportional", not just "proportional" or "related".
Suggest how the student could improve the reliability of the data obtained in the experiment in (c).
Answer
Repeat the procedure for solution 3 (the solution giving the anomalous result).
Repeat the procedure for solution 3
Background Concept
To improve reliability, anomalous results should be investigated by repeating the measurement or preparation. This helps determine if the anomaly was due to a random error or a systematic issue.
Understanding the Question
Suggest how to improve the reliability of the data from part (c).
Approach
The most direct improvement is to repeat the experiment for the anomalous point (solution 3) to see if the result is consistent.
Step-by-Step Reasoning
- Solution 3 gave an anomalous result.
- Repeating the preparation and measurement for solution 3 will provide a second data point.
- If the second result is consistent with the line of best fit, the first was likely a random error.
- If it is also anomalous, there may be a systematic issue with that concentration level.
Key Takeaways
Repeating anomalous results is a standard way to improve reliability and identify random vs systematic errors.
Common Mistakes
- Suggesting "use a better colorimeter" or "more precise apparatus" without linking it to the specific problem.
- Not specifying which solution to repeat.
Things to Be Careful About
- Be specific: repeat solution 3, not just "repeat the experiment" generally.
The student carries out a further experiment to examine the kinetics of the reaction between crystal violet, , and aqueous sodium hydroxide, .
The disappearance of the purple colour as the reaction proceeds can be monitored by measuring how the absorbance of light by the mixture changes using a colorimeter.
The student mixes of solution 6 with of , a large excess, and immediately starts the stopwatch.
The resulting mixture is then placed in a colorimeter. The absorbance of this mixture is measured every 100 seconds after starting the stop-watch.
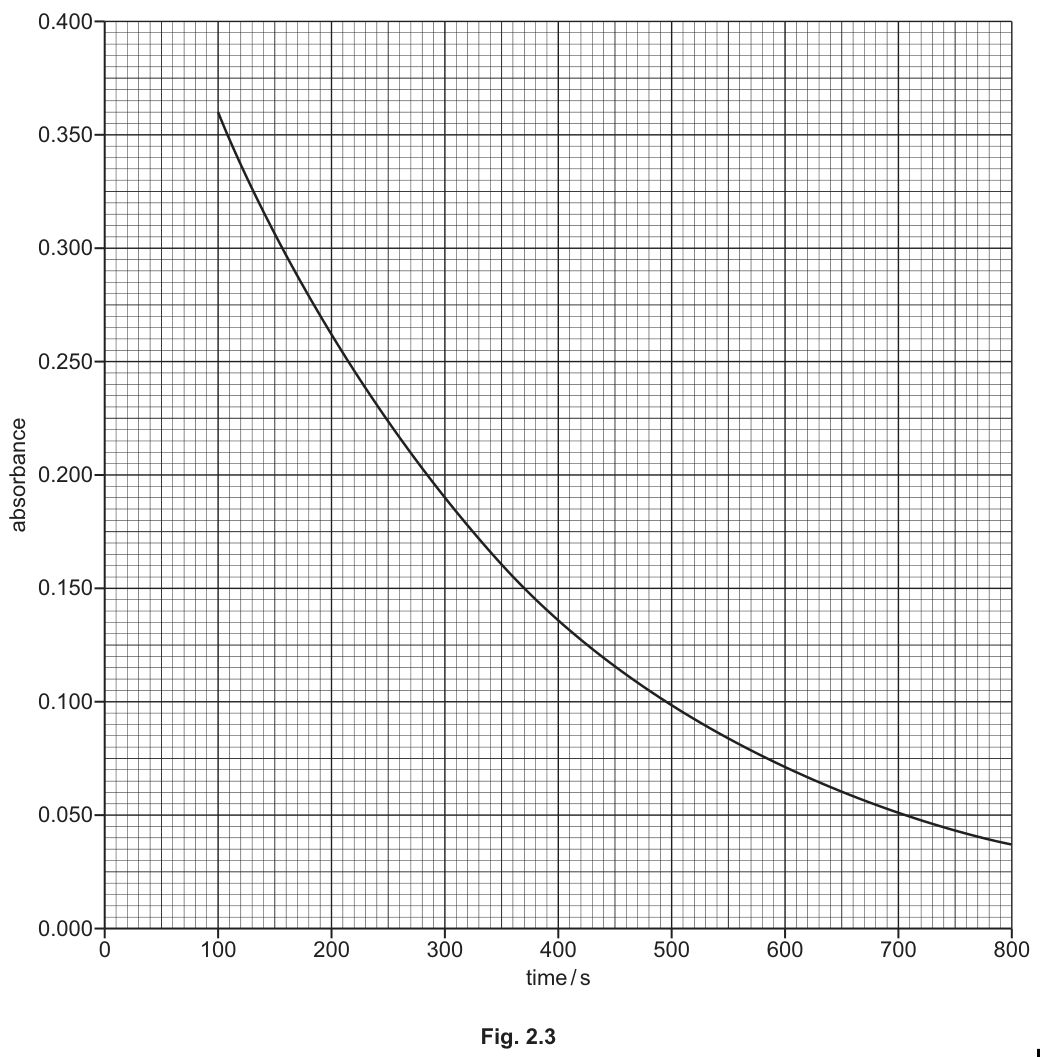
Fig. 2.3 shows a graph of the student's results.
Suggest why it is not possible for the student to measure the absorbance of the mixture at .
Answer
At t = 0 s, the solutions are still being mixed, so a reading is not possible.
solutions are being mixed at t=0
Background Concept
In kinetics experiments, the reaction starts as soon as the reactants are mixed. It takes time to mix the solutions, transfer them to the colorimeter, and take the first reading. Therefore, the first measurable time is usually after mixing is complete.
Understanding the Question
Suggest why absorbance cannot be measured at t = 0 s.
Approach
At t = 0, the student is mixing the solutions. The mixture is not yet homogeneous, and it hasn't been placed in the colorimeter yet.
Step-by-Step Reasoning
- The student mixes 5 cm³ of solution 6 with 5 cm³ of NaOH.
- This mixing process takes time.
- The mixture must then be placed in the colorimeter.
- At t = 0, the reaction has just started and the solutions are not yet fully mixed, so an accurate absorbance reading cannot be taken.
Key Takeaways
The initial mixing and transfer time means the first reading is always at t > 0.
Common Mistakes
- Saying "the reaction hasn't started yet" (it has started, you just can't measure it).
- Not being specific about the mixing process.
Things to Be Careful About
- Focus on the practical aspect: mixing and transferring take time.
Use the graph in Fig. 2.3 to find the half-life, , starting at .
State the coordinates of both points on the line of best fit used in your calculation.
coordinates 1 .............................. coordinates 2 ..............................
half-life .............................. s
Answer
coordinates 1: (100, 0.360)
coordinates 2: (315, 0.180)
half-life: 215 s
215 s
Background Concept
Half-life () is the time taken for the concentration of a reactant to halve. In a colorimetric kinetics experiment, absorbance is proportional to concentration, so half-life is the time for absorbance to halve. On a graph of absorbance against time, find the initial absorbance, halve it, and find the time at which the absorbance reaches that value.
Understanding the Question
Use Fig. 2.3 to find the half-life starting at t = 100 s. State the coordinates used.
Approach
- Read the absorbance at t = 100 s.
- Halve this absorbance value.
- Find the time at which the absorbance equals the halved value.
- Calculate the difference in time.
Step-by-Step Reasoning
- At t = 100 s, absorbance ≈ 0.360. Coordinates: (100, 0.360).
- Half of 0.360 is 0.180.
- Find t when absorbance = 0.180. Reading from the graph, this is at t ≈ 315 s. Coordinates: (315, 0.180).
- Half-life s.
(Note: Acceptable readings might vary slightly, e.g., (100, 0.36) and (310, 0.18) giving 210 s, or (100, 0.355) and (315, 0.178) giving 215 s. The key is that and is calculated correctly.)
Key Takeaways
Half-life from a graph: find initial value, halve it, find corresponding time, calculate time difference.
Common Mistakes
- Reading the wrong axis or scale.
- Calculating half-life as the time from t = 0 instead of from t = 100 s.
- Not stating the coordinates used.
Things to Be Careful About
- Read coordinates accurately from the graph.
- Ensure exactly.
Another student repeats the experiment at a different temperature and measures two half-life values. The values obtained are and .
Use these values to deduce the order of the reaction with respect to . Explain your answer.
Answer
First order.
Explanation: The half-lives are constant (within experimental error).
first order; half-lives are constant
Background Concept
The relationship between half-life and reaction order is:
- Zero order: (half-life decreases as concentration decreases)
- First order: (half-life is constant, independent of concentration)
- Second order: (half-life increases as concentration decreases)
If the half-life is constant (or approximately constant within experimental error), the reaction is first order with respect to that reactant.
Understanding the Question
Another student measured two half-lives at a different temperature: 420 s and 425 s. Deduce the order with respect to crystal violet and explain.
Approach
Compare the two half-life values. If they are approximately equal, the reaction is first order.
Step-by-Step Reasoning
- The two half-lives are 420 s and 425 s.
- These values are very close (within experimental error, roughly 1% difference).
- A constant half-life indicates a first-order reaction.
- Therefore, the reaction is first order with respect to crystal violet.
Key Takeaways
Constant half-life = first order. Changing half-life = zero or second order.
Common Mistakes
- Saying "the half-lives are different, so it's not first order" without recognising experimental error.
- Not stating the order clearly.
Things to Be Careful About
- Always mention "within experimental error" when comparing values that are close but not identical.