Chemistry 9701/53 — May/June 2024
Cambridge A-Level · Planning, Analysis and Evaluation · worked solutions for every part, with the mark scheme
Topics Analysis, Conclusions and Evaluation · Planning
Titration can be used to determine the concentration of dissolved oxygen in samples of river water.
The procedure for the experiment is given.
step 1 Use five graduated syringes, A, B, C, D and E, to collect five separate samples of river water.
step 2 In the laboratory, carefully add of manganese(II) sulfate, , into syringe A and mix well.
step 3 Add of alkaline aqueous potassium iodide into syringe A and mix well.
step 4 Add of dilute sulfuric acid into syringe A and mix well.
step 5 Transfer the contents of syringe A into a conical flask. Rinse syringe A using of distilled water and add washings to the conical flask.
step 6 Carry out one accurate titration of all the contents in the conical flask with aqueous sodium thiosulfate, , using starch indicator.
Repeat steps 2–6 for the samples in syringes B–E.
Aqueous sodium thiosulfate can be prepared from .
Working
Amount of required:
Molar mass:
Mass:
Answer
0.248 g
0.248 g
Background Concept
A solution of known concentration is made by dissolving a known amount of solute in a known volume of solution. The amount in moles is , where is concentration in and is volume in . The mass of solid needed is , where is the molar mass. The hydrated salt contains water of crystallisation, so its molar mass includes five water molecules.
Understanding the Question
We need the mass of hydrated sodium thiosulfate that must be weighed out to make 500.0 cm of 0.00200 mol dm solution. The volume is given in cm, so it must be converted to dm before using .
Approach
Convert 500.0 cm to 0.5000 dm. Calculate moles of needed. Then multiply by the molar mass of the hydrated salt, remembering to include the five water molecules.
Step-by-Step Reasoning
- .
- .
- Molar mass: .
- Mass: .
Key Takeaways
Always use the molar mass of the actual substance weighed, including water of crystallisation. Convert volume to dm before using .
Common Mistakes
- Using the molar mass of anhydrous instead of the hydrated salt.
- Forgetting to convert cm to dm.
- Mixing up and .
Things to Be Careful About
- The answer should be given to 3 significant figures because the data are given to 3 significant figures.
- Include the unit g.
- If using , the mass is 0.248 g; using more precise atomic masses gives 0.2482 g, which is also acceptable.
Identify the piece of apparatus that should be used to prepare of after the required mass of has been weighed out.
Answer
500 cm volumetric flask
500 cm^3 volumetric flask
Background Concept
A standard solution of an exact volume is prepared using a volumetric flask, which is calibrated to contain a precise volume at a given temperature. A measuring cylinder or beaker is not accurate enough for preparing a standard solution.
Understanding the Question
After weighing the correct mass of solid, the next step is to dissolve it and make the total volume exactly 500.0 cm. The question asks for the piece of apparatus used for this.
Approach
Recognise that making an exact volume of solution requires a volumetric flask.
Step-by-Step Reasoning
The solid is dissolved in a small volume of distilled water in a beaker, then transferred quantitatively to a 500 cm volumetric flask. The flask is filled to the graduation mark with distilled water and shaken to mix. The volumetric flask is the only common piece of apparatus that gives a precise 500.0 cm volume.
Key Takeaways
Volumetric flasks are used to prepare standard solutions of an exact volume; burettes and pipettes measure out volumes, not prepare fixed volumes.
Common Mistakes
- Saying 'measuring cylinder' or 'beaker' – these are not accurate enough.
- Forgetting to state the volume (500 cm).
Things to Be Careful About
Write '500 cm volumetric flask' to score the mark.
The graduations on each syringe are every .
Calculate the percentage error in the measurement of of alkaline aqueous potassium iodide by the syringe.
Show your working.
Working
Uncertainty in measuring 5.0 cm with a syringe graduated every 1.0 cm:
Answer
20%
20%
Background Concept
Every measuring apparatus has an uncertainty. For a scale with divisions, the uncertainty of one reading is usually taken as half the smallest division. If a volume is obtained from two readings, the total uncertainty is twice this value. Percentage error is the uncertainty expressed as a percentage of the quantity measured: .
Understanding the Question
The syringe is graduated every 1.0 cm. We need the percentage error in measuring 5.0 cm of potassium iodide solution. The mark scheme requires working to be shown.
Approach
Find the uncertainty of the measurement, then divide by 5.0 cm and multiply by 100.
Step-by-Step Reasoning
- Smallest division = 1.0 cm, so one reading has uncertainty cm.
- Because the volume is measured from two readings, the total uncertainty is cm.
- Percentage error .
Key Takeaways
Percentage error decreases as the measured volume increases for a fixed apparatus uncertainty. Always show the uncertainty calculation.
Common Mistakes
- Using only cm as the uncertainty, giving 10%.
- Forgetting to multiply by 100.
- Not showing working.
Things to Be Careful About
The mark scheme explicitly uses because two syringe readings are involved. Give the answer as 20%.
Place one tick (✓) in each row in Table 1.1 to show the effect, if any, of using a larger volume of alkaline aqueous potassium iodide.
Table 1.1
| greater effect | no effect | smaller effect | |
|---|---|---|---|
| uncertainty of the measurement | |||
| percentage error of the measurement |
Answer
| greater effect | no effect | smaller effect | |
|---|---|---|---|
| uncertainty of the measurement | ✓ | ||
| percentage error of the measurement | ✓ |
Uncertainty: no effect; percentage error: smaller effect
Background Concept
Absolute uncertainty is the fixed uncertainty of the apparatus, independent of the volume measured. Percentage error is the absolute uncertainty divided by the measured volume, multiplied by 100. If the measured volume increases while the absolute uncertainty stays the same, the percentage error decreases.
Understanding the Question
We must decide whether using a larger volume of alkaline potassium iodide makes the uncertainty greater, unchanged, or smaller, and do the same for the percentage error.
Approach
Think about whether the syringe's absolute uncertainty changes when a larger volume is used. It does not. Then think about how percentage error depends on the denominator.
Step-by-Step Reasoning
- The uncertainty of the measurement depends on the graduations of the syringe, not on the volume taken, so it has no effect.
- Percentage error . If the volume is larger and the uncertainty is unchanged, the percentage error becomes smaller.
Key Takeaways
A larger measured volume gives a smaller percentage error for the same apparatus.
Common Mistakes
- Thinking that using a larger volume makes the uncertainty larger.
- Confusing absolute uncertainty with percentage error.
Things to Be Careful About
Place the tick for 'no effect' in the uncertainty row and 'smaller effect' in the percentage error row.
The sample in the conical flask and the prepared solution of sodium thiosulfate are provided.
Describe the following procedures for the experiment using syringe A.
Answer
- Rinse the burette with the sodium thiosulfate solution.
- Fill the burette with sodium thiosulfate solution and run some solution out through the jet to remove air, then record the initial reading.
Rinse with thiosulfate; fill and run through jet
Background Concept
A burette must be clean and free from any solution that would contaminate the titrant. It is rinsed with the solution that will be used, not with water, so that the concentration of the titrant is not changed. The jet below the tap must also be filled so that the initial reading corresponds to a full column of solution.
Understanding the Question
Describe how to prepare a clean burette before taking readings, using the provided sodium thiosulfate solution.
Approach
State the two essential steps: rinse with the thiosulfate solution, then fill the burette and run solution through the jet.
Step-by-Step Reasoning
- Rinse the burette with a little sodium thiosulfate solution so any water or contaminant is removed without diluting the titrant.
- Fill the burette with sodium thiosulfate solution.
- Open the tap briefly to run solution out through the jet, removing any air bubble, then record the initial reading.
Key Takeaways
Rinsing with the titrant and removing air from the jet are essential for an accurate titration.
Common Mistakes
- Saying 'rinse with distilled water' – this would dilute the thiosulfate.
- Forgetting to run solution through the jet.
- Not mentioning that the burette is filled with sodium thiosulfate.
Things to Be Careful About
The mark scheme gives one mark for rinsing with thiosulfate and one for filling and running solution through the jet.
Answer
- Run sodium thiosulfate solution from the burette into the conical flask, swirling continuously.
- Near the end-point, add the thiosulfate dropwise until a permanent colour change is seen.
Run thiosulfate into flask until permanent colour change; add dropwise near end-point
Background Concept
In a titration, the burette delivers the titrant to the analyte until the reaction is just complete. The end-point is shown by a permanent colour change. To obtain an accurate titre, the titrant is added quickly at first but dropwise near the end-point so that the exact volume is not overshot.
Understanding the Question
Describe how to carry out the one accurate titration in step 6, using the sample in the conical flask and the sodium thiosulfate in the burette.
Approach
Describe adding thiosulfate from the burette to the flask while swirling, and adding it dropwise near the end-point until a permanent colour change occurs.
Step-by-Step Reasoning
- Run sodium thiosulfate solution from the burette into the conical flask, swirling the flask continuously to mix the reactants.
- As the colour starts to change, slow down and add the thiosulfate dropwise.
- Stop when a permanent colour change is seen – this is the end-point. Record the final burette reading.
Key Takeaways
Accurate titration requires swirling, slow addition near the end-point, and recognising a permanent colour change.
Common Mistakes
- Adding the thiosulfate too quickly and overshooting the end-point.
- Not swirling, so the reaction is not uniform.
- Stopping at a temporary colour change.
Things to Be Careful About
The mark scheme gives one mark for adding thiosulfate until a permanent colour change and one for adding dropwise towards the end.
Answer
To ensure the reagents are fully mixed so the reactions go to completion in the syringe.
To ensure reactions are complete
Background Concept
In the Winkler method for dissolved oxygen, several reagents are added in sequence to the water sample. Each addition must be thoroughly mixed so that all the dissolved oxygen reacts completely. If mixing is incomplete, some oxygen may not react and the final titre will be too low.
Understanding the Question
Steps 2–4 say 'mix well' after each addition. The question asks why this is necessary.
Approach
State that mixing ensures the reagents are fully mixed so the reactions go to completion.
Step-by-Step Reasoning
Mixing brings the added reagent into contact with the whole sample. This ensures that all the dissolved oxygen in the 30.0 cm sample reacts, so the amount of iodine produced (and hence the thiosulfate titre) accurately reflects the oxygen concentration.
Key Takeaways
Mixing is a practical step that ensures complete reaction and reliable results.
Common Mistakes
- Giving a vague answer such as 'to mix the solutions' without saying why.
- Saying 'to make the reaction faster' – the key idea is completeness.
Things to Be Careful About
Use the word 'complete' or 'go to completion' to match the mark scheme.
Answer
| A | B | C | D | E | |
|---|---|---|---|---|---|
| final burette reading / cm | |||||
| initial burette reading / cm | |||||
| titre / cm |
Table with five columns A–E and rows for initial/final readings and titre, all with cm^3 units
Background Concept
A results table must have clear headings that include both the quantity measured and its unit. For a titration, the initial and final burette readings are recorded, and the titre is the difference between them. The table needs a column for each titration performed.
Understanding the Question
Draw a table for recording the titration results for the five samples in syringes A–E. The table should allow final reading, initial reading, and titre to be recorded for each sample.
Approach
Create five columns, one for each syringe, and three rows for final reading, initial reading, and titre. Include units in all headings.
Step-by-Step Reasoning
- Use columns headed A, B, C, D and E.
- Include rows for final burette reading, initial burette reading, and titre.
- Add the unit cm to each heading, either as '/ cm' or 'in cm'.
Key Takeaways
Every column and row heading in a results table should state the quantity and its unit.
Common Mistakes
- Missing units.
- Only having one column for all five titrations.
- Forgetting a row for the titre.
Things to Be Careful About
The mark scheme gives one mark for correct headings with units and one mark for five columns A–E.
The overall reaction taking place in the experiment is shown.
A student carries out the experiment and determines the mean titre to be .
Calculate the concentration, in , of dissolved oxygen in the river water.
Working
From the equation, 1 mol reacts with 4 mol :
This oxygen was in a 30.0 cm sample:
Answer
2.11 × 10^-4 mol dm^-3
2.11 × 10^-4 mol dm^-3
Background Concept
In a titration, the amount of titrant used is found from . The balanced equation gives the stoichiometric ratio between the titrant and the analyte. Here, 1 mol of reacts with 4 mol of . The concentration of oxygen in the original water sample is found by dividing the moles of oxygen by the volume of the water sample, not by the total volume in the flask.
Understanding the Question
A mean titre of 12.65 cm of 0.00200 mol dm sodium thiosulfate was used. We need the concentration of dissolved oxygen in the river water sample, which had a volume of 30.0 cm.
Approach
Calculate moles of thiosulfate from the titre, divide by 4 to get moles of oxygen, then divide by 0.0300 dm to get concentration.
Step-by-Step Reasoning
- mol.
- From the equation, mol.
- This oxygen came from 30.0 cm of river water, so mol dm.
Key Takeaways
Use the stoichiometric ratio from the equation, and divide by the volume of the original sample, not the total volume after adding reagents.
Common Mistakes
- Forgetting to divide by 4.
- Dividing by the total volume in the flask instead of 30.0 cm.
- Not converting cm to dm.
Things to Be Careful About
Give the answer to 3 significant figures with the unit mol dm.
Freshly distilled water does not contain any dissolved oxygen.
A student decides to run the procedure on a sample of freshly distilled water and at the end obtains a value of dissolved oxygen.
Suggest why the student did not get a value of . Assume the procedure was carried out correctly.
Answer
The reagents/solutions used in the procedure contained a small amount of dissolved oxygen.
Oxygen present in reagents/solutions
Background Concept
A blank experiment uses a sample known to contain none of the analyte. Any positive result must come from the reagents or the procedure. In this case, freshly distilled water contains no dissolved oxygen, so any measured oxygen must have come from the reagents used.
Understanding the Question
The student obtained mol dm for distilled water, not zero. We need to suggest why, assuming the procedure was carried out correctly.
Approach
Identify the source of the oxygen as the reagents or solutions used in the experiment.
Step-by-Step Reasoning
The manganese(II) sulfate solution, potassium iodide solution, sulfuric acid, and even the distilled water used for rinsing can contain small amounts of dissolved oxygen. When these are added to the sample, they contribute to the measured oxygen, giving a small positive result.
Key Takeaways
A blank experiment identifies the contribution of the reagents, which can then be subtracted.
Common Mistakes
- Saying the procedure was wrong – the question says it was carried out correctly.
- Saying 'oxygen from the air' – the mark scheme specifically credits oxygen in the reagents/solutions.
Things to Be Careful About
Mention 'oxygen in the reagents/solutions' to match the mark scheme.
Answer
Subtract the blank value ( mol dm) from the dissolved oxygen concentration calculated in (f).
Subtract blank value from result in (f)
Background Concept
A blank correction removes the systematic contribution of the reagents. The blank value is subtracted from the measured value for the sample to give the true concentration of the analyte.
Understanding the Question
We need to suggest how the blank value of mol dm could be used to improve the answer in part (f).
Approach
Subtract the blank value from the dissolved oxygen concentration calculated in (f).
Step-by-Step Reasoning
The value from (f) includes oxygen from the reagents as well as from the river water. Subtracting the blank value removes this contribution. For example, if the value in (f) were mol dm, the corrected value would be mol dm.
Key Takeaways
A blank correction improves accuracy by removing systematic error from the reagents.
Common Mistakes
- Adding the blank value instead of subtracting.
- Not stating that the blank value is subtracted from the result in (f).
Things to Be Careful About
Use the same units for both values before subtracting.
Suggest why this method is unsuitable for samples of tap water that have been purified by chlorination and so contain .
Answer
Chlorine is an oxidising agent and reacts in the same way as oxygen, so it would also consume thiosulfate and give a falsely high result.
Chlorine is an oxidising agent and interferes with the reaction
Background Concept
The Winkler method relies on a series of redox reactions. Dissolved oxygen oxidises manganese(II) in alkaline solution, and the oxidised manganese then liberates iodine from iodide in acid. The iodine is titrated with thiosulfate. Any other oxidising agent present in the water can also oxidise iodide to iodine, or react with the reagents, leading to a falsely high titre.
Understanding the Question
Chlorinated tap water contains . We need to explain why the method is unsuitable for such samples.
Approach
Recognise that chlorine is an oxidising agent and will interfere with the redox reactions in the same way as oxygen.
Step-by-Step Reasoning
Chlorine can oxidise iodide ions to iodine, or react with manganese(II) or thiosulfate. This means extra thiosulfate would be consumed in the titration, giving a titre that is too high and therefore an overestimate of the dissolved oxygen concentration. The method cannot distinguish between oxygen and chlorine.
Key Takeaways
Any oxidising agent that mimics oxygen will interfere with this redox titration.
Common Mistakes
- Saying chlorine reacts with oxygen.
- Not identifying chlorine as an oxidising agent.
- Saying the method is unsafe rather than chemically unsuitable.
Things to Be Careful About
The mark scheme accepts 'chlorine is an oxidising agent', 'chlorine reacts in the same way as oxygen', or 'chlorine reacts with Mn / SO / I / reactants'.
The activation energy, , for the reaction between dilute hydrochloric acid, , and aqueous sodium thiosulfate, , can be determined by an initial rates method.
The solid sulfur formed is seen as a white suspension in the reaction mixture. The reactants are mixed and the time, , for a fixed quantity of sulfur to be formed is recorded.
A measure of the initial rate of the reaction is .
Standard solutions of and are supplied.
Measurements are taken for a series of temperatures using the following procedure.
step 1 A thermostatically controlled water bath is set up.
step 2 A conical flask is labelled A and a second conical flask is labelled B.
step 3 of is added to flask A. Flask A is placed in the water bath.
step 4 of is added to flask B. Flask B is placed in the same water bath.
step 5 Wait for 10 minutes.
step 6 Flask A is removed from the water bath and placed on a tile marked with a black cross.
step 7 The contents of flask B are added to flask A and a timer started.
step 8 The timer is stopped when the black cross is no longer visible. The time is recorded.
Answer
To ensure the solutions in both flasks A and B reach thermal equilibrium with the water bath (and are at the same temperature) before they are mixed.
To ensure the solutions in both flasks A and B reach thermal equilibrium with the water bath (and are at the same temperature) before they are mixed.
Background Concept
In kinetics experiments, the rate constant is exponentially dependent on temperature, as described by the Arrhenius equation: . Because of this exponential relationship, even a small error in the measured temperature will lead to a significant error in the calculated activation energy . Therefore, precise temperature control is critical.
Understanding the Question
The question asks why there is a 10-minute wait after placing the flasks in the thermostatically controlled water bath but before mixing the reactants in step 7. We need to identify the physical process occurring during this waiting period.
Approach
Think about what happens when a liquid at room temperature is placed into a water bath set to a different temperature. Heat transfer takes time. The waiting period must allow the system to reach thermal equilibrium.
Step-by-Step Reasoning
When flasks A and B are placed in the water bath, the solutions inside them are initially at room temperature. Waiting for 10 minutes allows sufficient time for heat transfer to occur between the water bath and the solutions. This ensures that both solutions are exactly at the target temperature of the water bath before they are mixed. If they were mixed immediately, the reaction would occur at an unknown, intermediate temperature, making the calculated activation energy inaccurate. The mark scheme specifically requires mentioning that both solutions reach the same temperature (thermal equilibrium with the bath).
Key Takeaways
In kinetics experiments involving temperature, thermal equilibrium must be established for all reactant solutions before mixing to ensure the reaction occurs at a precisely known and uniform temperature.
Common Mistakes
- Saying "to make the reaction go faster" or "to ensure the temperature is correct" without specifying that both solutions must reach the same temperature as the water bath.
- Forgetting to mention that both flasks/solutions need to equilibrate.
Things to Be Careful About
The answer must explicitly state that the solutions reach the same temperature as the water bath (thermal equilibrium). Simply saying "to heat the solutions" is not sufficient; the key is that they are at the correct, uniform temperature before mixing.
The procedure does not mention how a value for the temperature of the mixture during the reaction is obtained.
State the temperature measurements that should be taken and at which stage in the procedure they should be taken.
Answer
Measure the temperature of the reaction mixture in flask A at the start of the reaction (immediately before step 7 / after step 5) and at the end of the reaction (immediately after step 8 / when the cross is no longer visible).
Measure the temperature of the reaction mixture in flask A at the start of the reaction (immediately before step 7) and at the end of the reaction (immediately after step 8).
Background Concept
The reaction between hydrochloric acid and sodium thiosulfate is exothermic. As the reaction proceeds, heat is released, causing the temperature of the reaction mixture to rise slightly above the initial water bath temperature. Because the rate of reaction is temperature-dependent, the temperature is not constant throughout the 176 seconds it takes for the cross to disappear.
Understanding the Question
The question asks what temperature measurements should be taken and when, to accurately represent the temperature at which the reaction occurred. Since the temperature changes during the reaction, a single measurement is insufficient.
Approach
To capture the temperature change, we must measure the temperature at the beginning and at the end of the reaction period. These two values will then be averaged to give a representative temperature for the reaction.
Step-by-Step Reasoning
- Start of reaction: The temperature should be measured immediately before the reactants are mixed (step 7) or immediately after step 5 when the solutions are at bath temperature. This gives the initial temperature .
- End of reaction: The temperature should be measured immediately after the timer is stopped (step 8), when the cross is no longer visible. This gives the final temperature .
By taking readings at both points, we account for the temperature rise due to the exothermic nature of the reaction.
Key Takeaways
For exothermic or endothermic reactions where the temperature changes significantly during the measurement period, temperature must be recorded at both the start and end of the reaction to calculate an accurate average temperature.
Common Mistakes
- Only measuring the temperature at the start or only at the end.
- Measuring the temperature of the water bath instead of the reaction mixture itself.
Things to Be Careful About
The measurement must be of the reaction mixture in flask A, not the water bath. The timing must be clearly linked to the procedure steps (before/after mixing or before/after the cross disappears).
State how to use the temperature measurements to determine an accurate value for the temperature of the mixture during the reaction.
Answer
Calculate the mean (average) of the two temperature measurements.
Calculate the mean (average) of the two temperature measurements.
Background Concept
When a temperature changes linearly or approximately linearly over a time period, the average temperature can be accurately represented by the arithmetic mean of the initial and final temperatures.
Understanding the Question
Having taken two temperature readings (start and end), the question asks how to combine them to get an accurate value for the temperature during the reaction.
Approach
Use the simple arithmetic mean of the two recorded temperatures.
Step-by-Step Reasoning
The temperature at the start is and at the end is . The average temperature during the reaction is calculated as:
This mean value is then used in the Arrhenius equation analysis.
Key Takeaways
Averaging start and end temperature readings is a standard technique to account for temperature drift in kinetic experiments.
Common Mistakes
- Taking the temperature of the water bath instead of averaging the mixture readings.
- Not averaging at all and just using one of the values.
Things to Be Careful About
Ensure you explicitly state "calculate the mean" or "average". Do not overcomplicate the explanation.
A student carries out the procedure at three different temperatures and records the measurements in Table 2.1.
Complete Table 2.1. Record values for temperature to the nearest whole number and the values for to four decimal places.
Table 2.1
| temperature, | time, | temperature, | |
|---|---|---|---|
| 15 | 176 | ||
| 24 | 92 | ||
| 32 | 62 |
Working
Temperature in K = , rounded to the nearest whole number.
is calculated and rounded to four decimal places.
- For : .
- For : .
- For : .
Answer
| temperature, | time, | temperature, | |
|---|---|---|---|
| 15 | 176 | 288 | 0.0057 |
| 24 | 92 | 297 | 0.0109 |
| 32 | 62 | 305 | 0.0161 |
See completed table above.
Background Concept
The Arrhenius equation is often linearised by taking logarithms. The form used here is . To plot this graph, we need in Kelvin (absolute temperature) and as a measure of the initial rate.
Understanding the Question
The question asks to complete a data table by converting temperatures from Celsius to Kelvin and calculating the reciprocal of the time () to four decimal places.
Approach
- Convert to using , then round to the nearest whole number as instructed.
- Calculate for each time value and round to four decimal places.
Step-by-Step Reasoning
Row 1:
Row 2:
Row 3:
Key Takeaways
Always convert Celsius to Kelvin for thermodynamic calculations. Pay close attention to the required significant figures or decimal places specified in the question.
Common Mistakes
- Forgetting to add 273.15 (or 273) and leaving the temperature in Celsius.
- Rounding to the wrong number of decimal places (must be four).
- Calculation errors when using the reciprocal function on a calculator.
Things to Be Careful About
The question explicitly states "Record values for temperature to the nearest whole number". Using 273 instead of 273.15 is acceptable here since the rounding instruction overrides the precision of the constant, but 273.15 is more formally correct. Ensure is rounded to exactly four decimal places.
A second student carries out the procedure at six different temperatures and analyses their data to give the results in Table 2.2.
Table 2.2
| 0.00353 | -2.43 |
| 0.00336 | -1.99 |
| 0.00325 | -1.68 |
| 0.00314 | -1.47 |
| 0.00302 | -1.21 |
| 0.00287 | -0.82 |
Use the results from Table 2.2 to plot a graph on the grid in Fig. 2.1 to show the relationship between and . Use a cross () to plot each data point. Draw a line of best fit.
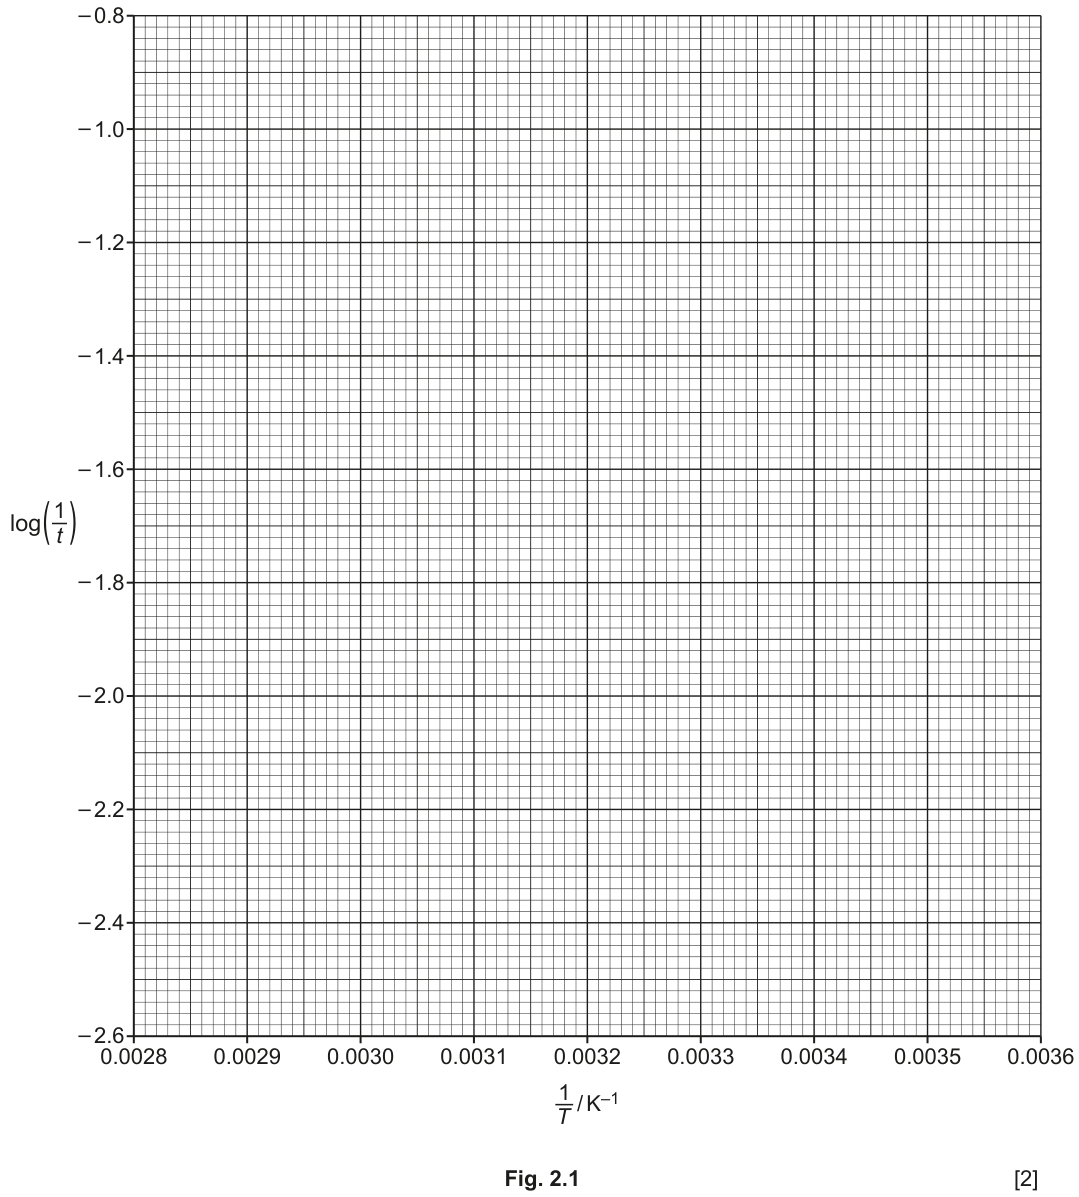
Answer
All six data points from Table 2.2 must be plotted correctly as crosses ():
A straight line of best fit is drawn passing close to all points, with roughly equal numbers of points above and below the line.
(Note: The actual graph is drawn on the provided grid in Fig. 2.1. The line should have a positive gradient, extending across the graph.)
Graph plotted with all 6 points as crosses and a straight line of best fit drawn through them.
Background Concept
The Arrhenius equation in its logarithmic form is: . Using base-10 logarithms, this becomes . Since is proportional to the rate constant , will be linearly related to . The gradient of this line is , which is approximately .
Understanding the Question
The question asks to plot against using the data from Table 2.2 and draw a line of best fit. This graph will be used to determine the gradient, which is then used to calculate .
Approach
- Set up the axes correctly based on the given grid (Fig. 2.1).
- Plot each data point from Table 2.2 as a cross ().
- Draw a straight line of best fit that minimises the distance to all points.
Step-by-Step Reasoning
Plotting points:
- Point 1: ,
- Point 2: ,
- Point 3: ,
- Point 4: ,
- Point 5: ,
- Point 6: ,
Line of best fit:
The points should form a roughly straight line with a positive gradient. The line should pass as close as possible to all points, with an equal number of points above and below the line. One point (e.g., ) might be slightly off the line, which is acceptable if the overall trend is linear.
Key Takeaways
When plotting graphs for kinetic analysis, accuracy in plotting is crucial as it directly affects the gradient calculation and subsequent determination of .
Common Mistakes
- Plotting points incorrectly (swapping and axes, or misreading the scale).
- Drawing a line that connects the points (a "joined-up" line) instead of a line of best fit.
- Not extending the line across the entire graph.
Things to Be Careful About
- The -axis is and the -axis is . Do not swap them.
- Use a sharp pencil for accurate plotting.
- The line of best fit must be a straight line, not a curve connecting the points.
Determine the gradient of your line of best fit in Fig. 2.1. State the coordinates of both points you use in your calculation. These must be selected from your line of best fit. Give the gradient to three significant figures.
Working
Select two points on the line of best fit (not the data points themselves). For example:
Point 1:
Point 2:
Gradient
Rounding to three significant figures:
(Note: Values will vary slightly depending on the exact line drawn. Acceptable range is typically to .)
Answer
Coordinates used: and
Gradient = (to 3 s.f.)
Gradient = -2.17 x 10^3 K (example value; depends on line drawn)
Background Concept
The gradient of the line in a plot of against is directly related to the activation energy by the equation: , where .
Understanding the Question
The question asks to determine the gradient of the line of best fit from the graph drawn in part (d)(i). The gradient must be calculated using two points on the line of best fit, not the actual data points, to minimise plotting errors.
Approach
- Choose two points on the line of best fit that are far apart to minimise percentage error in the gradient calculation.
- Read the coordinates and from the graph.
- Calculate the gradient using .
- Round the final answer to three significant figures.
Step-by-Step Reasoning
Let's assume a line of best fit passes through:
- Point 1: ,
- Point 2: ,
Expressed to three significant figures: .
The units are Kelvin (K) because the -axis is dimensionless (logarithm) and the -axis is in , so .
Key Takeaways
Always use points on the line of best fit, not the raw data points, when calculating the gradient. Use a large triangle (points far apart) to reduce percentage error.
Common Mistakes
- Using data points instead of points on the line of best fit.
- Calculating instead of .
- Forgetting the negative sign (the gradient is negative, though the graph appears to have a positive slope if plotted incorrectly; remember increases as decreases, and becomes more negative as increases).
- Not rounding to three significant figures.
Things to Be Careful About
- The coordinates must be read accurately from the graph.
- The gradient is negative because as increases (temperature decreases), decreases (reaction is slower).
- Ensure the units are stated as K.
An equation relating time and temperature variables is shown.
Determine the activation energy, , of this reaction using this equation and your answer to (d)(ii).
(If you were unable to find the gradient in (d)(ii), then use the value . This is not the correct answer.)
Include units in your answer.
Show your working.
Working
The given equation is:
Comparing this to the equation of a straight line , where and :
Rearranging for :
Using the gradient from part (d)(ii) (example value: ) and :
Converting to kJ mol:
(Note: Using the example gradient of gives 41.6 kJ mol. If using the given fallback gradient of , .)
Answer
(based on example gradient)
41.6 kJ mol^-1 (example value; depends on gradient calculated)
Background Concept
The Arrhenius equation relates the rate constant to temperature and activation energy : . Taking the natural logarithm gives . Converting to base-10 logarithms ():
Since is proportional to , has the same form. The constant is approximately .
Understanding the Question
The question provides the equation and asks to calculate using the gradient from part (d)(ii).
Approach
- Identify that the gradient of the graph equals .
- Rearrange the equation to solve for .
- Substitute the gradient value and the gas constant .
- Calculate in J mol and convert to kJ mol.
Step-by-Step Reasoning
From the graph equation:
Rearranging:
Substituting the example gradient () and :
Converting to kJ mol (divide by 1000):
Key Takeaways
The gradient of a vs graph is directly used to calculate activation energy. Always check units: is in J, so will be in J mol, which should be converted to kJ mol.
Common Mistakes
- Forgetting to rearrange the equation correctly.
- Using the wrong value for (must be , not ).
- Not converting from J mol to kJ mol.
- Using data points instead of the gradient in the calculation.
Things to Be Careful About
- The equation given uses , which is . Do not use in the denominator instead of in the numerator.
- Units: The gradient has units of K (since is dimensionless and is ). is in . Therefore, .
- Always include units in the final answer as requested.
Use your graph to state whether the results from the experiment are reliable. Justify your answer.
Answer
Yes, the results are reliable because there are no (or very few) anomalous points, and most points lie on or near the line of best fit, indicating a strong linear relationship.
OR
No, the results are not fully reliable because there is an anomalous point (e.g., the point at ), and not all points lie on or near the line of best fit.
(Choose one based on your actual graph.)
Yes, there are no/few anomalous points and most points lie on or near the line of best fit.
Background Concept
The reliability of experimental data in kinetics is assessed by examining how well the data points fit the expected theoretical relationship. For the Arrhenius plot, a linear relationship is expected. Deviations from linearity indicate experimental errors or anomalous results.
Understanding the Question
The question asks to use the graph to state whether the results are reliable and to justify the answer.
Approach
Examine the graph to see if the points follow the expected linear trend. Look for anomalous points (outliers) that are far from the line of best fit.
Step-by-Step Reasoning
If the results are reliable:
- State: "Yes, the results are reliable."
- Justification: "There are no (or very few) anomalous points, and most points lie on or near the line of best fit. This indicates a consistent linear relationship between and , supporting the Arrhenius equation."
If the results are not fully reliable:
- State: "No, the results are not fully reliable."
- Justification: "There is an anomalous point (e.g., at ), and some points do not lie on or near the line of best fit. This suggests experimental errors at certain temperatures."
Key Takeaways
Reliability is assessed by the scatter of data points around the line of best fit. A good fit indicates reliable data.
Common Mistakes
- Saying "yes" or "no" without justification.
- Using vague terms like "the graph looks good" without referencing anomalous points or the line of best fit.
Things to Be Careful About
- The justification must directly reference the graph (anomalous points, points on/near the line).
- Both "yes" and "no" are acceptable answers as long as the justification is consistent with the graph drawn.
Suggest a change to one controlled variable that the student could make so that the time measured for a given temperature is shorter.
Answer
Increase the concentration of one or both of the reactants (hydrochloric acid or sodium thiosulfate).
(Alternatively: Increase the volume of one or both reactants, provided the total volume remains constant or the concentration is effectively increased.)
Increase the concentration of one or both of the reactants.
Background Concept
The rate of a chemical reaction depends on the concentration of the reactants (for reactions in solution). According to the rate equation, , increasing the concentration of reactants will increase the rate of reaction. Since is a measure of the initial rate, a higher rate means a smaller (shorter time for the cross to disappear).
Understanding the Question
The question asks for a change to one controlled variable that would make the measured time shorter for a given temperature. A shorter time means a faster reaction rate.
Approach
To increase the reaction rate (and thus decrease ), we can increase the concentration of the reactants. The concentration of the reactants is a controlled variable in this experiment (it is kept constant while temperature is varied). Changing it would change the rate.
Step-by-Step Reasoning
The time is the time taken for a fixed amount of sulfur to form. If the reaction is faster, will be shorter. The rate of reaction is proportional to the concentration of the reactants. Therefore, increasing the concentration of HCl or NaSO will increase the rate and decrease .
For example, using NaSO instead of would approximately double the rate (if first order with respect to thiosulfate), halving the time .
Key Takeaways
In kinetics experiments, the concentration of reactants is a key variable that affects the rate. Increasing concentration increases the rate and decreases the time for a fixed amount of product to form.
Common Mistakes
- Suggesting to increase the temperature (this is the independent variable, not a controlled variable).
- Suggesting to add a catalyst (this changes the mechanism and is not a simple change to a controlled variable in this context).
- Saying "use more reactants" without specifying that the concentration must be increased (if volume is increased but concentration is the same, the rate is the same, though it might take longer to form the fixed amount of sulfur if the total volume is larger).
Things to Be Careful About
- The question asks for a change to a controlled variable. Temperature is the independent variable, so it cannot be the answer.
- The change must result in a shorter time (faster reaction). Increasing concentration does this.
- Be precise: "increase the concentration" is better than "use more reactants".