Chemistry 9701/52 — May/June 2024
Cambridge A-Level · Planning, Analysis and Evaluation · worked solutions for every part, with the mark scheme
Topics Planning · Analysis, Conclusions and Evaluation
Calcium carbonate, , decomposes when heated, as shown.
The enthalpy change of reaction, , for the thermal decomposition of cannot be measured directly. Instead, a procedure involving two experiments is used. In each experiment, the enthalpy change of a different reaction is determined.
The equation for the reaction in experiment 1 is shown. The enthalpy change for this reaction is .
The equation for the reaction in experiment 2 is shown. The enthalpy change for this reaction is .
Experiment 1
step 1 Weigh a sample of powdered .
step 2 Transfer , an excess, of hydrochloric acid, , into a small glass beaker.
step 3 Start a timer and measure the temperature of the in the beaker every 30 seconds for minutes.
step 4 After 3 minutes add the sample of to the in the beaker. Continue measuring the temperature of the reaction mixture every 30 seconds for a further 5 minutes.
Experiment 2
Repeat experiment 1 using calcium oxide, , instead of .
Suggest why the enthalpy change of reaction for the thermal decomposition of calcium carbonate cannot be measured directly.
Answer
The thermal decomposition requires continuous heating, making it impossible to accurately measure the temperature change of the system while heat is being applied from an external source.
Cannot easily measure temperature change while applying heat
Background Concept
Enthalpy changes are typically measured using calorimetry, where the temperature change of a solution is monitored as a reaction occurs in an insulated container. For this to work, the reaction must proceed spontaneously or be initiated easily, and the heat exchange must occur primarily between the reaction and the solution.
Understanding the Question
The question asks why the enthalpy change for the thermal decomposition of calcium carbonate cannot be measured directly. Thermal decomposition requires sustained, high-temperature heating (typically above 800 °C) to break the chemical bonds.
Approach
Consider the practical requirements of direct calorimetry versus the conditions required for thermal decomposition. If you apply heat directly to the reaction vessel, the heat source itself will raise the temperature of the surroundings, making it impossible to isolate the temperature change caused solely by the chemical reaction.
Step-by-Step Reasoning
- Direct measurement requirement: To measure directly, you would heat the and measure the temperature change of the system.
- The problem: The reaction requires an external heat source to proceed. This external heat will continuously raise the temperature of the reaction mixture and the apparatus.
- Conclusion: You cannot distinguish between the temperature increase caused by the chemical reaction and the temperature increase caused by the external heating. Therefore, the enthalpy change cannot be measured directly.
Key Takeaways
Some reactions require conditions (like high heat) that are incompatible with standard calorimetry techniques. In such cases, indirect methods like Hess's law must be used.
Common Mistakes
- Stating "the reaction is too slow" or "the reaction does not go to completion." While true, the primary reason is the interference of the external heat source with temperature measurement.
- Saying "you cannot measure temperature." Students can measure temperature; the issue is attributing the change to the reaction.
Things to Be Careful About
Focus on the interference of the heat source. The mark scheme specifically looks for the inability to measure temperature change while applying heat.
Calculate the mass, in g, of to be weighed using a two-decimal-place balance in step 1.
Working
Rounding to two decimal places gives .
Answer
5.01 g
Background Concept
The mass of a substance can be calculated from the number of moles and its molar mass using the equation . The molar mass is the sum of the atomic masses of all atoms in the formula. In experimental chemistry, the precision of the balance used dictates the number of decimal places required for the measured mass.
Understanding the Question
The student is asked to calculate the mass of of to be weighed using a balance that reads to two decimal places.
Approach
- Calculate the molar mass of .
- Multiply by the number of moles to find the theoretical mass.
- Round the result to two decimal places to match the balance's precision.
Step-by-Step Reasoning
- Molar mass calculation: .
- Mass calculation: .
- Rounding: The balance measures to . rounds to (using standard rounding rules, or if using round-to-even, but CIE typically accepts standard rounding where 5 rounds up, giving ). The mark scheme gives .
Key Takeaways
Always calculate the exact mass first, then round to the appropriate number of decimal places based on the apparatus specified in the question.
Common Mistakes
- Forgetting to round to two decimal places.
- Using incorrect atomic masses (e.g., instead of ). Using gives , which may not match the mark scheme's expected .
Things to Be Careful About
Check the atomic masses provided in the data booklet. is , not . This small difference affects the final rounded value.
Outline how a student should weigh by difference using a weighing boat in order to determine the exact mass of added to in the beaker. Draw a results table, with appropriate headings, ready for the student to complete.
Answer
Weighing by difference:
- Weigh the weighing boat containing the sample.
- Transfer the to the beaker containing the .
- Weigh the empty weighing boat (or boat with any residue) again.
- The difference in mass is the exact mass of added.
Results table:
| mass of weighing boat + (before transfer) / g | |
|---|---|
| mass of weighing boat (+ residue) (after addition) / g | |
| mass of added / g |
See working
Background Concept
Weighing by difference is a precise method for transferring a specific mass of solid into a container. Instead of trying to add solid to a balance until it reads exactly (which is difficult and risks spilling), you weigh the container + solid, transfer the solid, and weigh the container again. The difference is the exact mass transferred.
Understanding the Question
The student must outline the procedure for weighing by difference and draw a results table to record the measurements.
Approach
- Describe the sequence of weighing: initial mass (boat + solid), transfer, final mass (boat + residue).
- Design a table with clear headings, including units, to capture these values and the calculated difference.
Step-by-Step Reasoning
- Procedure: The mark scheme requires two key steps: weighing the boat with the sample before transfer, and weighing the boat after the sample is added to the beaker. The difference gives the mass added.
- Table design: A results table needs column headings with quantities and units. Since this is a single measurement sequence, a single column with rows for each measurement is appropriate.
- Row 1: Mass of boat + before transfer / g
- Row 2: Mass of boat (with residue) after addition / g
- Row 3: Mass of added / g (calculated as Row 1 - Row 2)
Key Takeaways
When asked to outline a technique, be precise about the sequence of actions. For tables, always include units in the headings.
Common Mistakes
- Describing weighing the empty boat first, then adding solid to make . This is not weighing by difference.
- Forgetting units in the table headings. The mark scheme explicitly requires units (/ g).
- Including unnecessary rows like "mass of beaker" or "mass of HCl". The table should only record what is needed to find the mass of added.
Things to Be Careful About
The mark scheme accepts "mass of boat (+ residue)" because some solid may stick to the boat. Ensure your table reflects the actual physical steps.
Identify which piece of apparatus should be used to measure the volume of in step 2 and give a reason for your choice.
Answer
Apparatus: Burette
Reason: It measures volume to the nearest , providing the necessary precision for a measurement of .
Working
A measuring cylinder typically measures to or . A volumetric pipette measures a fixed volume (e.g., or ) but is less flexible for adding an "excess" where exact precision of the excess volume is less critical than the precision of the measurement itself. However, a burette can deliver with precision to , matching the four significant figures in .
Answer
Burette; measures to nearest
Burette; measures to nearest 0.05 cm^3
Background Concept
Volumetric apparatus comes in different precisions. A measuring cylinder is approximate (). A volumetric pipette is highly precise for a fixed volume ( for ). A burette is precise for variable volumes ().
Understanding the Question
The student needs to measure of . The value implies a precision to two decimal places ( or better).
Approach
Identify the apparatus that can measure with the required precision. A burette reads to (or if estimated), which is sufficient. A measuring cylinder is not precise enough.
Step-by-Step Reasoning
- Required precision: has 4 significant figures, implying precision to or .
- Apparatus choice: A burette is designed to deliver variable volumes with high precision. Its scale is typically read to (with estimation to ).
- Reason: The burette measures to the nearest , which justifies the recording.
Key Takeaways
Match the number of decimal places in the volume to the precision of the apparatus. requires a burette or volumetric pipette.
Common Mistakes
- Suggesting a measuring cylinder. It cannot measure to or .
- Suggesting a volumetric pipette. While precise, it is usually for fixed volumes (like ). A pipette exists but is less common; a burette is the standard answer for delivering an excess volume with this precision.
Things to Be Careful About
The mark scheme specifically looks for "burette" AND "measures to nearest ". Both are required for the mark.
Without making any changes to the apparatus, suggest an instruction to be added to step 3 and step 4 to make the experiment more accurate.
Answer
Stir the solution / mixture continuously.
Working
In calorimetry experiments, heat is generated or absorbed at the site of reaction. Without stirring, temperature gradients can form, leading to inaccurate maximum/minimum temperature readings. Stirring ensures the heat is distributed evenly throughout the solution, allowing the thermometer to record the true average temperature.
Answer
Stir the solution / mixture
Stir the solution
Background Concept
In simple solution calorimetry, the assumption is that the temperature measured by the thermometer represents the temperature of the entire solution. This is only true if the heat from the reaction is distributed uniformly.
Understanding the Question
The procedure involves adding a solid to an acid and measuring temperature. The question asks for an instruction to add to steps 3 and 4 to improve accuracy, without changing apparatus.
Approach
Think about what could cause inaccurate temperature readings in a beaker reaction. Localized heating or cooling. The solution is to mix the contents.
Step-by-Step Reasoning
- Problem: When is added to , the reaction occurs at the surface of the solid. The solution near the solid gets hot, but the rest may not.
- Effect: The thermometer might record a lower temperature than the actual maximum if it's not in the hot spot, or it might record a fluctuating temperature.
- Solution: Stirring ensures convection and uniform temperature distribution. This allows the thermometer to record the true maximum temperature reached by the reaction mixture.
Key Takeaways
Stirring is a fundamental technique in solution calorimetry to ensure thermal equilibrium.
Common Mistakes
- Suggesting "use a lid" or "insulate the beaker". The question says "without making any changes to the apparatus". A lid is an additional piece of apparatus.
- Suggesting "use a digital thermometer". Again, apparatus change.
Things to Be Careful About
Read the constraint: "Without making any changes to the apparatus". Only procedural instructions are allowed.
A student carries out experiment 1 and obtains the results given in Table 1.1.
Table 1.1
| time / minutes | 0.5 | 1.0 | 1.5 | 2.0 | 2.5 | 3.0 | 3.5 | 4.0 | 4.5 | 5.0 | 5.5 | 6.0 |
|---|---|---|---|---|---|---|---|---|---|---|---|---|
| temperature / | 19.0 | 19.0 | 19.0 | 19.0 | 19.0 | — | 27.5 | 36.0 | 34.5 | 32.5 | 32.0 | 31.0 |
| time / minutes | 6.5 | 7.0 | 7.5 | 8.0 |
|---|---|---|---|---|
| temperature / | 29.0 | 28.0 | 26.0 | 25.5 |
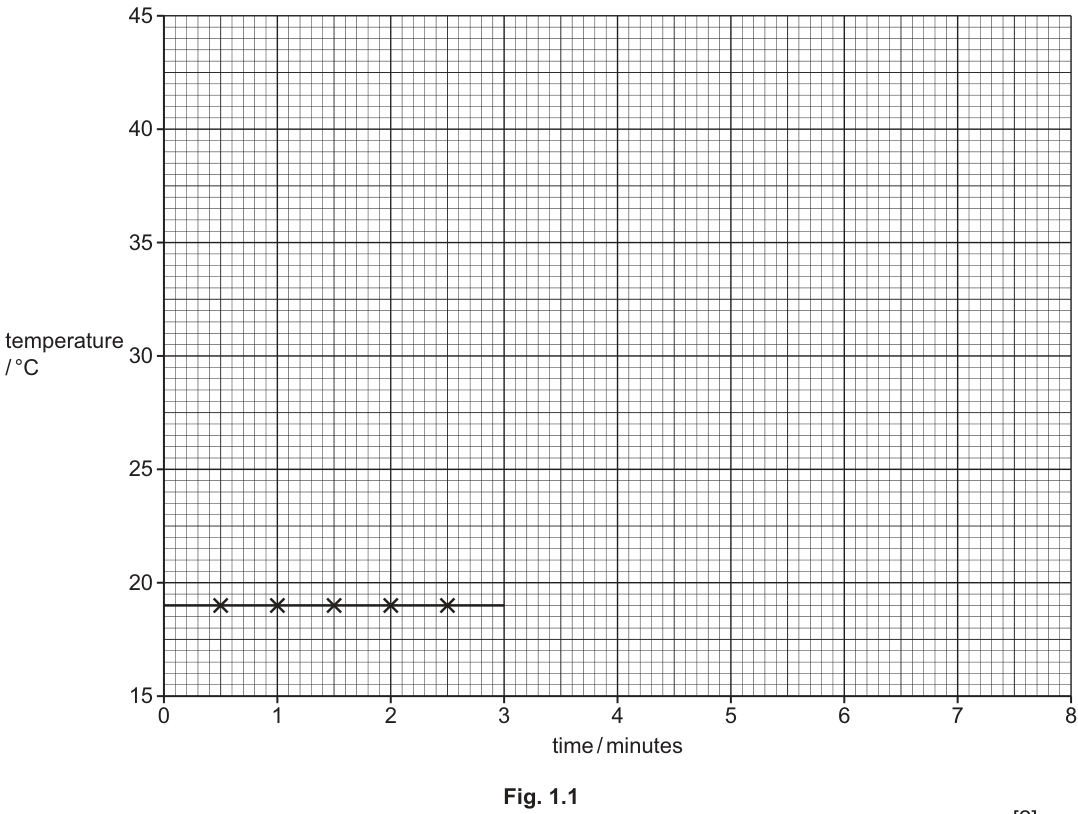
Plot a graph on the grid in Fig. 1.1 to show the relationship between temperature and time. Use a cross () to plot each data point.
The points and line of best fit for the data before 3 minutes have been drawn for you.
Draw a line of best fit for the data after 3 minutes that will enable you to determine the theoretical temperature increase at 3.0 minutes.
Answer
Graph plotting:
Plot the following points using crosses ():
Line of best fit:
Draw a smooth curve or line of best fit through these points from to . Extend (extrapolate) this line back to minutes. The line should show a peak around minutes and then a gradual decline due to heat loss.
Answer
See graph description
See working
Background Concept
In exothermic reactions measured in a simple calorimeter, heat is lost to the surroundings as the temperature rises. This means the recorded maximum temperature is lower than the theoretical maximum (the temperature if no heat was lost). To find the theoretical temperature change, we use an extrapolation method.
Understanding the Question
The student must plot the temperature-time data for the reaction phase (after 3 minutes) and draw a line of best fit that can be extrapolated back to minutes to find the theoretical maximum temperature.
Approach
- Plot all 10 data points from to .
- Draw a line/curve of best fit. The reaction is fastest at minutes (temp ), then slows down as reactants are used up and heat is lost.
- Extrapolate the cooling curve (the part after the peak) back to minutes. This gives the theoretical temperature at the moment of mixing, assuming no heat loss had occurred.
Step-by-Step Reasoning
- Plotting: Ensure all 10 points are plotted accurately. The grid has major lines every and minor lines every . X-axis has major lines every min, minor every min.
- Line of best fit: The points from to show a cooling trend (mostly). Draw a curve that fits these points. The point at () is on the rising part, but the reaction is still ongoing. The mark scheme says "line of best fit drawn involving points from 4 to 8 minutes AND extrapolated back to 3 minutes".
- Extrapolation: Extend the line from the cooling phase (e.g., from to ) back to . Read the temperature at on this extrapolated line. This value is typically around .
Key Takeaways
Extrapolation is used to correct for heat loss in calorimetry. The line of best fit for the cooling phase is extended back to the start of the reaction.
Common Mistakes
- Plotting points incorrectly (e.g., misreading the axes).
- Drawing a straight line through all points from to . The reaction has a peak; the line should curve or at least reflect the cooling trend.
- Not extrapolating back to . The extrapolation is essential to find the theoretical max temp.
Things to Be Careful About
The mark scheme requires 10 points plotted correctly and the line extrapolated to 3 minutes. Check your grid reading carefully.
Working
Theoretical temperature at minutes (from extrapolation) .
Initial temperature at minutes .
Answer
19.5 °C
Background Concept
The temperature increase () is the difference between the theoretical maximum temperature (corrected for heat loss) and the initial temperature before the reaction started.
Understanding the Question
The student must use the graph from part (e)(i) to find the theoretical temperature at minutes and calculate the increase.
Approach
- Read the temperature on the extrapolated line at minutes.
- Subtract the initial temperature () from this value.
Step-by-Step Reasoning
- Reading the graph: The extrapolated line from the cooling curve (points 4.0 to 8.0) back to intersects at approximately . (Acceptable range is usually ).
- Calculation: .
Key Takeaways
The theoretical is always higher than the observed maximum () because it corrects for heat lost during the reaction.
Common Mistakes
- Using the observed maximum temperature () instead of the extrapolated value.
- Calculating , which is the observed increase, not the theoretical one.
Things to Be Careful About
The mark scheme gives . Ensure your reading from the graph is consistent with this. If you read , your answer would be , which might still be accepted depending on the mark scheme tolerance, but is the expected value.
Suggest why the temperature measured at 3.5 minutes is lower than the temperature measured at 4.0 minutes.
Answer
The reaction between and is not complete at 3.5 minutes; it is still proceeding and releasing heat, so the temperature continues to rise until the reaction finishes.
Working
At min, solid is added. At min, the temperature is . At min, it is . The temperature is still increasing, meaning the exothermic reaction is still occurring.
Answer
The reaction is not complete (at 3.5 minutes)
The reaction is not complete at 3.5 minutes
Background Concept
When a solid is added to a liquid, the reaction rate depends on the surface area and concentration. It takes time for the reaction to reach completion. During this time, heat is continuously released.
Understanding the Question
The temperature at 3.5 minutes () is lower than at 4.0 minutes (). Why?
Approach
The temperature is still rising, which means heat is still being produced by the reaction. Therefore, the reaction has not finished.
Step-by-Step Reasoning
- Observation: Temp at 3.5 min is , at 4.0 min is .
- Explanation: The reaction is exothermic. As long as reactants are present, heat is released.
- Conclusion: At 3.5 minutes, there is still unreacted or , so the reaction is ongoing and the temperature is still increasing.
Key Takeaways
A rising temperature in an exothermic reaction indicates the reaction is still proceeding.
Common Mistakes
- Saying "heat loss is less at 4.0 minutes." Heat loss is always occurring, but the rate of heat production is greater than the rate of heat loss.
- Saying "the thermometer is slow." While thermometers have a response time, the primary reason is the ongoing reaction.
Things to Be Careful About
Keep the explanation simple: the reaction is still happening / not complete.
A student carries out experiment 2 and determines a temperature increase of . The heat released by the reaction, , is given by:
where is the mass of . Assume that of has a mass of and that the specific heat capacity of the solution, , is .
Calculate , in J, for experiment 2 and hence determine in .
Working
Calculate :
Calculate :
(Note: The reaction is exothermic, so is negative. The heat released is positive, but enthalpy change is negative.)
Answer
;
q = 12958 J; ΔH2 = -259 kJ mol^-1
Background Concept
The heat energy transferred () in a solution is calculated using , where is the mass of the solution (assuming density , so ), is the specific heat capacity (), and is the temperature change.
The enthalpy change per mole () is , with a negative sign for exothermic reactions.
Understanding the Question
Given (which is ), calculate and then for the reaction of with .
Approach
- Calculate using the given formula and values.
- Divide by the moles of () to get in .
- Convert to and apply the correct sign (exothermic = negative).
Step-by-Step Reasoning
- Mass: of has a mass of (given ). Note: we only consider the mass of the solution, not the solid, as the solid's heat capacity is usually negligible and not given.
- calculation: .
- Moles: (same as experiment 1, as the procedure is repeated with the same amount of solid).
- calculation: (to 3 s.f.).
Key Takeaways
Always check the sign of . Exothermic reactions have negative . The mass in is the mass of the solution, not the total mass of reactants (unless specified).
Common Mistakes
- Forgetting to convert J to kJ ( instead of ).
- Getting the sign wrong ( instead of ). The question says "heat released", so is positive, but is negative.
- Using the wrong mass (e.g., ). The question says "assume that of has a mass of ", implying we only use the mass of the acid.
Things to Be Careful About
Significant figures: has 3 s.f., has 3 s.f., has 3 s.f. The answer should be to 3 s.f. ().
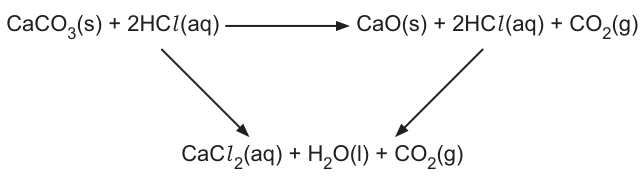
Use the energy cycle below, your answer to (g) and the information given to determine for the thermal decomposition of .
Enthalpy change for experiment 1, .
(If you were unable to calculate a final answer in (g), assume a value of . This is not the correct answer and the sign has been omitted.)
Answer
Using Hess's law from the energy cycle:
Working
The cycle shows:
Path 1: ()
Path 2: () then ()
By Hess's law, the total enthalpy change is the same for both paths:
Answer
+175 kJ mol^-1
Background Concept
Hess's law states that the total enthalpy change for a reaction is independent of the route taken. An energy cycle (or Hess's law cycle) can be used to calculate an unknown by combining known values.
Understanding the Question
The student must use the given energy cycle and the calculated to find for the decomposition of .
Approach
- Identify the paths in the cycle.
- Set up the equation: Left path = Right path (or sum of arrows = 0 if going around the cycle).
- Solve for .
Step-by-Step Reasoning
- Cycle analysis:
- Top left:
- Top right: (this is , effectively the decomposition products plus HCl)
- Bottom:
- Arrow 1 (left): ()
- Arrow 2 (top): ()
- Arrow 3 (right): ()
- Equation: Going from top-left to bottom via the left arrow is the same as going top-left to top-right () then top-right to bottom ().
- Solve: .
Key Takeaways
In a Hess's law cycle, ensure you follow the direction of the arrows. If an arrow points the opposite way, you change the sign of .
Common Mistakes
- Adding instead of subtracting: . This is wrong because the cycle requires subtraction.
- Forgetting the negative sign for : . This is also wrong.
Things to Be Careful About
Check the direction of the arrows in the energy cycle. The mark scheme gives the formula .
Identify the main weakness of the experimental procedure and suggest one improvement to overcome this weakness. The main weakness is not the type of thermometer used.
Answer
Main weakness: Heat loss to the surroundings (from the beaker and the solution).
Improvement: Use a lid (or insulate the beaker with polystyrene/foam cup) to reduce heat loss.
Working
In simple calorimetry using a glass beaker, heat is lost to the air, the bench, and the thermometer. This causes the measured temperature change to be lower than the theoretical value, leading to an underestimation of the enthalpy change.
Answer
See above
Heat loss to surroundings; use a lid
Background Concept
Simple solution calorimetry (using a beaker and thermometer) is prone to heat loss. The system is not perfectly insulated. Heat escapes to the surroundings via convection, conduction, and radiation.
Understanding the Question
The student must identify the main weakness of the procedure (excluding the thermometer type) and suggest one improvement.
Approach
- Think about what is lost in a beaker calorimetry experiment. Heat.
- How can heat loss be reduced? Insulation, lids, better apparatus.
Step-by-Step Reasoning
- Weakness: The reaction is exothermic. As the temperature rises, the rate of heat loss to the surroundings increases (Newton's law of cooling). This means the maximum temperature recorded is lower than it should be.
- Improvement: To reduce heat loss, we can insulate the beaker or cover it. A lid prevents heat loss by convection (hot air rising). Polystyrene cups are better insulators than glass beakers.
- Constraint: The question says "not the type of thermometer used". So don't suggest "use a more accurate thermometer".
Key Takeaways
Heat loss is the biggest source of error in simple calorimetry. Improvements focus on insulation and minimizing exposure to air.
Common Mistakes
- Suggesting "repeat the experiment and take a mean." This reduces random error, but heat loss is a systematic error (it always makes too small). Repeating won't fix it.
- Suggesting "use a digital thermometer." The question excludes this.
- Suggesting "use more concentrated acid." This doesn't reduce heat loss; it might increase the temperature change, but the proportion of heat lost remains similar or worse.
Things to Be Careful About
The improvement must directly address the weakness. Weakness: heat loss. Improvement: lid/insulation. Pair them logically.
This question is about an experiment to investigate the effect of temperature on the equilibrium constant, , of the reaction shown.
The data collected is used to determine the value of the enthalpy change of the reaction.
To set up the equilibrium, aqueous iron(III) nitrate, , is mixed with aqueous potassium thiocyanate, . Aqueous iron thiocyanate ions, , have a red colour.
A colorimeter is used to measure the absorbance of the reaction mixture. A calibration graph can then be used to determine the concentration of in the reaction mixture.
Table 2.1 shows the solutions for the experiments.
Table 2.1
| solution | ion | concentration / |
|---|---|---|
| A | 0.00920 | |
| B | 0.00200 | |
| C | 0.00200 | |
| D | 0.500 |
Describe how you would prepare of solution B from solution A.
Include a calculation of the volume of solution A required for the preparation of solution B.
Give the name and capacity of any key apparatus that should be used.
Write your answer as a series of numbered steps.
Working
Answer
- Calculate the required volume of solution A as .
- Use a burette to transfer of solution A into a volumetric flask.
- Top up the volumetric flask to the mark with distilled water and mix thoroughly.
Volume of A = 21.75 cm^3; use burette to transfer to 100 cm^3 volumetric flask and top up with distilled water.
Background Concept
Preparing a solution of a specific concentration from a more concentrated stock solution involves dilution. The number of moles of solute remains constant before and after dilution, so applies. To prepare an exact volume of a diluted solution, a volumetric flask is used because it is calibrated to contain a precise volume at a specific temperature. A burette or pipette is used to transfer the concentrated solution accurately.
Understanding the Question
You need to prepare of solution B () from solution A (). The question asks for a calculation of the volume of A needed, the name and capacity of key apparatus, and a numbered step-by-step procedure.
Approach
- Use the dilution equation to find the volume of A required.
- Round the calculated volume to a value that can be measured with a burette (nearest ).
- Describe the standard procedure for making a solution in a volumetric flask: transfer the measured concentrated solution, then add solvent to the mark.
Step-by-Step Reasoning
- Calculation: . A burette reads to , so we round to .
- Apparatus: A volumetric flask is needed to make exactly of solution. A burette is used to measure out of the concentrated solution accurately.
- Procedure: First, transfer the measured volume of A into the volumetric flask. Then, add distilled water until the bottom of the meniscus touches the calibration mark. Finally, stopper and invert to mix.
Key Takeaways
Dilution calculations rely on . When preparing standard solutions, always use a volumetric flask for the final volume and a burette or pipette for the measured aliquot of the stock solution.
Common Mistakes
- Forgetting to round the calculated volume to the precision of the apparatus (burette = ).
- Suggesting a measuring cylinder instead of a volumetric flask; measuring cylinders are not precise enough for preparing standard solutions.
- Not specifying "distilled water" for the top-up, or forgetting to mention mixing/diluting to the mark.
Things to Be Careful About
Ensure the units for volume and concentration are consistent. The final answer for volume should reflect the precision of the measuring instrument (burette), not the raw calculator output.
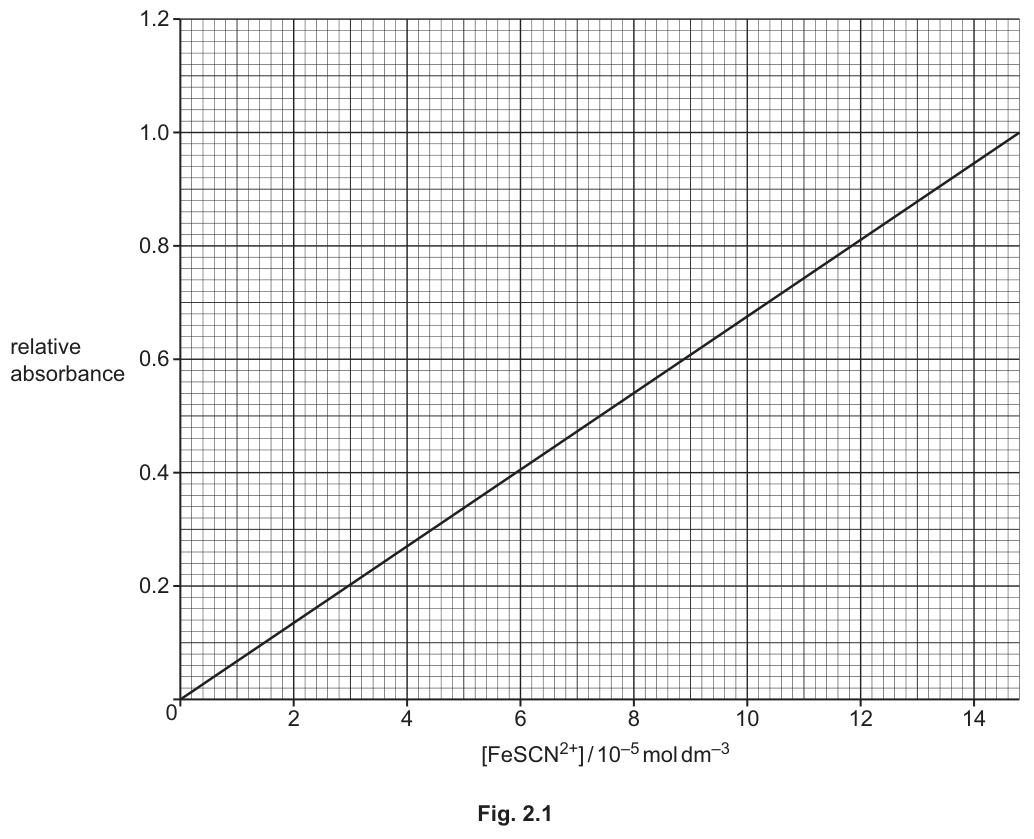
Before starting the experiment, solutions B and D are used to produce a calibration graph. Known volumes of each solution are added together and the absorbance for each mixture is recorded. The calibration graph is shown in Fig. 2.1.
The concentration of solution D is much greater than the concentration of solution B in order that solution D is in excess. Suggest a reason why solution D is in excess.
Answer
Solution D is in excess to ensure that all of the thiocyanate ions () from solution B react completely to form . This guarantees that the concentration of produced is known and equal to the initial concentration of , which is necessary for constructing an accurate calibration graph.
To ensure all SCN- reacts so [FeSCN2+] is known.
Background Concept
A calibration graph (or standard curve) relates a measurable property (like absorbance) to the concentration of an analyte. For the reaction , the position of equilibrium depends on the initial concentrations. If neither reactant is in large excess, the exact concentration of the product at equilibrium is unknown and difficult to calculate without knowing .
Understanding the Question
The question asks why solution D (containing at ) is used in large excess compared to solution B (containing at ) when making the calibration mixtures.
Approach
Consider Le Chatelier's principle. Adding a large excess of one reactant will shift the equilibrium position far to the right, effectively driving the reaction to completion. This means we can assume 100% of the limiting reactant () has been converted to product ().
Step-by-Step Reasoning
- By making much greater than , the equilibrium is forced almost entirely to the right.
- Therefore, the concentration of formed is essentially equal to the initial concentration of added.
- Since we know exactly how much B was added, we know the exact concentration of in each calibration mixture. This allows us to plot absorbance against a known concentration.
Key Takeaways
In calibration experiments involving equilibria, an excess of one reagent is used to drive the reaction to completion, establishing a known concentration of the product for the standard curve.
Common Mistakes
- Stating "to make the reaction go faster"; excess reagent shifts equilibrium, it doesn't necessarily change the rate in this context.
- Saying "to ensure the reaction happens"; the reaction happens anyway, but the extent depends on equilibrium position.
Things to Be Careful About
Be precise: say "all reacts" or "equilibrium is shifted to the right" so that the concentration of product is known. Avoid vague statements like "to make more product".
The following experimental procedure is used.
step 1 Half-fill a large beaker with water at room temperature ().
step 2 Transfer about of solution B into a boiling tube and place the boiling tube in the beaker of water.
step 3 Transfer of solution C into a test-tube and place the test-tube in the beaker of water.
step 4 Wait for 10 minutes.
step 5 Transfer of solution B from the boiling tube to the test-tube containing solution C. Stir the mixture in the test-tube and record the temperature of the mixture.
step 6 Measure the absorbance of the mixture in the test-tube using the colorimeter.
Change the temperature of the water in the beaker and repeat steps 3 to 6 for different temperatures.
Answer
(relative) absorbance
absorbance
Background Concept
In an experiment, the independent variable is the one you change or control (here, temperature). The dependent variable is the one you measure as a result of changing the independent variable. Control variables are kept constant to ensure a fair test.
Understanding the Question
The procedure involves changing the water temperature and then measuring the absorbance of the mixture at that temperature. You need to identify what is being measured as a result of the temperature change.
Approach
Look at the final measurement step (step 6): "Measure the absorbance of the mixture...". This is the data collected that depends on the temperature set in step 1.
Step-by-Step Reasoning
- Independent variable: temperature of the water bath (adjusted in steps 1 and repeated procedure).
- Dependent variable: the relative absorbance measured in step 6, which is used to find and subsequently .
Key Takeaways
The dependent variable is the outcome you measure. Here, temperature is changed to see its effect on the equilibrium position, which is indicated by the absorbance of the coloured complex.
Common Mistakes
- Confusing independent and dependent variables. Temperature is changed (independent), absorbance is measured (dependent).
- Saying "equilibrium constant" or "concentration"; these are calculated values, not the raw measured data.
Things to Be Careful About
The mark scheme accepts "(relative) absorbance". "Absorbance" alone is sufficient.
Describe how you would adjust the temperature of the water in the large beaker to obtain a temperature of .
Answer
Add ice to the water in the large beaker.
Add ice to the water.
Background Concept
To cool a liquid below room temperature, a cooling agent with a melting point below the target temperature is added. Ice (solid water) melts at and can cool water down to near , which covers the target of .
Understanding the Question
The experiment starts at (room temperature). The student needs to obtain a temperature of for the water bath. How do you cool water from to ?
Approach
Simply state the practical method: adding a cooling substance to the water bath. Ice is the standard, safe, and effective choice for cooling aqueous solutions in a school laboratory.
Step-by-Step Reasoning
- To lower the temperature from to , heat must be removed from the water.
- Adding ice absorbs heat as it melts (endothermic process), lowering the temperature of the water.
- Stirring the water bath ensures an even temperature distribution.
Key Takeaways
Basic temperature control in practicals: use ice to cool below room temperature, use a Bunsen burner or hot water bath to heat above room temperature.
Common Mistakes
- Suggesting a refrigerator or freezer; these are not suitable for maintaining a specific temperature in a beaker during an active experiment.
- Saying "put in an ice bath" without specifying adding ice to the existing water, though this is often acceptable. Be specific: "add ice to the water".
Things to Be Careful About
Keep the answer concise. "Add ice" is the key phrase.
A student obtains the results given in Table 2.2.
Table 2.2
| 1 | 2 | 3 | 4 |
|---|---|---|---|
| temperature / | relative absorbance | ||
| 25 | 0.60 | ||
| 55 | 0.42 |
The value of the equilibrium constant, , can be determined using equation 1.
is the value of in .
Use the calibration graph in Fig. 2.1 to complete column 3 in Table 2.2. Record values to one decimal place.
Working
From Fig. 2.1 (calibration graph):
- For relative absorbance = 0.60, read across to the line of best fit and down to the x-axis: .
- For relative absorbance = 0.42, read across to the line of best fit and down to the x-axis: .
Answer
| 1 | 2 | 3 |
|---|---|---|
| temperature / | relative absorbance | |
| 25 | 0.60 | 8.9 |
| 55 | 0.42 | 6.2 |
8.9 and 6.2
Background Concept
A calibration graph plots a measurable signal (absorbance) against a known concentration. To find an unknown concentration from a measured signal, you read the signal on the y-axis, move horizontally to the line of best fit, and then read down to the x-axis to find the concentration. The x-axis label often includes a multiplier (e.g., ), which must be accounted for.
Understanding the Question
You are given absorbance values (0.60 and 0.42) and must use Fig. 2.1 to find the corresponding values to fill in column 3. The values must be recorded to one decimal place.
Approach
- Locate 0.60 on the y-axis (relative absorbance).
- Move horizontally to the straight line of best fit.
- Move vertically down to the x-axis and read the value.
- Repeat for 0.42.
Step-by-Step Reasoning
- For absorbance 0.60: The y-axis has major lines every 0.2 and minor lines every 0.02. 0.60 is a major line. Following across to the line and down, the x-axis value is between 8 and 10. The major lines are every 2, minor every 0.2. The reading is approximately 8.9. (Acceptable range 8.8–9.0).
- For absorbance 0.42: 0.42 is one minor line above 0.40. Following across and down, the x-axis value is just above 6.0. The reading is approximately 6.2. (Acceptable range 6.1–6.3).
- The column header is , so the numbers 8.9 and 6.2 are the values to enter directly.
Key Takeaways
Reading graphs requires aligning with the line of best fit, not necessarily the data points (though here only the line is shown). Pay attention to axis multipliers and required decimal places.
Common Mistakes
- Reading from the wrong axis (e.g., reading absorbance from the x-axis).
- Not rounding to the required one decimal place.
- Forgetting the multiplier and writing in the box, but the column header already divides by , so just write 8.9.
Things to Be Careful About
The graph shows a line of best fit, not individual data points for the calibration. Use the line. Ensure your reading is to one decimal place as requested.
Use equation 1 to complete column 4 in Table 2.2. Record values to the nearest whole number.
Working
Equation 1: , where in .
For 25 °C:
Rounded to nearest whole number: 107
For 55 °C:
Rounded to nearest whole number: 70
Answer
| 3 | 4 |
|---|---|
| 8.9 | 107 |
| 6.2 | 70 |
107 and 70
Background Concept
The equilibrium constant (or here) is calculated from the equilibrium concentrations of products and reactants. For the reaction , the expression is .
In this experiment, the initial concentrations after mixing equal volumes (5.00 cm³ of B + 5.00 cm³ of C) are halved. Initial . Initial .
At equilibrium, . Then and . Thus, , which is equation 1.
Understanding the Question
You must calculate for two temperatures using the concentrations found in part (d)(i) and the given equation. Values must be rounded to the nearest whole number.
Approach
- Convert the values from column 3 (which are in units of ) to by multiplying by . This is .
- Substitute into equation 1.
- Calculate the result and round to the nearest whole number.
Step-by-Step Reasoning
- 25 °C: . Denominator: . .
- 55 °C: . Denominator: . .
Key Takeaways
When using equilibrium expressions, ensure all concentrations are in consistent units (). Be careful with scientific notation and calculator entry to avoid order-of-magnitude errors.
Common Mistakes
- Forgetting to convert from to standard decimal form before substituting into the equation.
- Using the values 8.9 and 6.2 directly without the factor.
- Rounding errors during intermediate steps; keep full calculator values until the final division.
Things to Be Careful About
The equation gives directly. Check significant figures/rounding: "nearest whole number". 107.2 rounds to 107; 70.5 rounds to 70 (or 71 depending on rounding convention, but 70.47 is clearly 70).
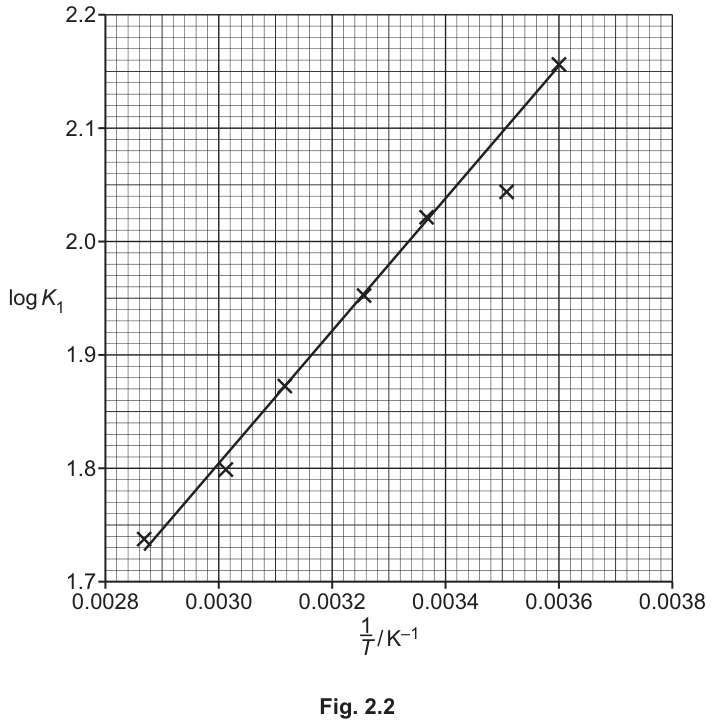
Another student does the same experiment for seven different temperatures, plots a graph and draws the line of best fit, as shown in Fig. 2.2.
Theory predicts that the relationship between and is given by equation 2.
is the enthalpy change of reaction and is the temperature in Kelvin.
Answer
Equation 2 is of the form (a linear equation), where and . The graph of against is a straight line, which supports the relationship given in equation 2.
The graph is a straight line.
Background Concept
The van 't Hoff equation relates the equilibrium constant to temperature: . Converting to base-10 logarithm gives . This is a linear equation of the form , where , , and the gradient .
Understanding the Question
You are given equation 2 and a graph of against . You must explain why the graph supports the equation.
Approach
Compare the mathematical form of equation 2 to the standard equation of a straight line (). If the variables on the graph axes correspond to and in the equation, and the plot is linear, the relationship is supported.
Step-by-Step Reasoning
- Equation 2: .
- Let and . Then , where and .
- The graph plots against and yields a straight line of best fit.
- A straight line graph confirms the linear relationship predicted by equation 2.
Key Takeaways
Linearizing a non-linear relationship (like vs ) by plotting transformed variables (like vs ) is a standard technique to verify a theoretical equation and extract parameters (like ) from the gradient.
Common Mistakes
- Saying "the points lie on the line"; they don't perfectly, but the line of best fit is straight.
- Not explicitly stating that the equation represents a straight line ( form).
Things to Be Careful About
Keep the explanation concise. The key point is that the graph is a straight line, matching the linear form of the equation.
Circle the point on the graph in Fig. 2.2 that you consider to be most anomalous.
There were no errors in the measurements in the experiment.
A student correctly suggests that the anomaly was caused because the absorbance was lower than expected by the line of best fit. Suggest why the absorbance was lower than expected.
Answer
Anomalous point: The point at approximately , (the point below the line of best fit on the right side).
Reason for lower absorbance: Not all of solution B was transferred from the boiling tube to the test-tube in step 5 (e.g., some was left behind or spilled). This means the initial concentration of was lower than expected, resulting in a lower concentration of produced and thus a lower absorbance.
Point at 1/T ≈ 0.0035, log K1 ≈ 2.05; incomplete transfer of solution B.
Background Concept
An anomalous result (outlier) is a data point that does not fit the general trend of the data. In a graph of best fit, it is a point that lies far from the line. If measurements are correct, anomalies are usually due to random errors in technique or procedure, not systematic errors.
Understanding the Question
You must identify the anomalous point on Fig. 2.2 and suggest a procedural reason why the absorbance (and thus ) was lower than expected for that temperature. The question states there were no measurement errors (e.g., wrong thermometer reading), so it must be a technique error.
Approach
- Look at Fig. 2.2 and find the point furthest from the line of best fit. The point at () is clearly below the line.
- Lower absorbance means lower . Since is lower, the equilibrium position is further to the left, or simply less product was formed.
- Think about the procedure: mixing solutions B and C. If less B was added, less reactant is available, so less product forms.
Step-by-Step Reasoning
- Identifying the point: At , the line of best fit is at , but the data point is at . This is the most anomalous point.
- Why lower absorbance? Absorbance is proportional to . Lower absorbance means lower product concentration.
- Procedural error: In step 5, of solution B is transferred from the boiling tube to the test-tube. If the transfer is incomplete (e.g., some solution B remains in the boiling tube or on the sides), the actual amount of added is less than .
- Less means less is formed at equilibrium, leading to lower absorbance and a lower calculated .
Key Takeaways
Anomalies in equilibrium experiments can arise from incomplete mixing, incomplete transfer of reactants, or failure to reach equilibrium temperature. Always link the observed error (low absorbance) to a specific procedural step.
Common Mistakes
- Circling a point that is actually on the line or close to it.
- Suggesting "the colorimeter was not calibrated"; the question says no measurement errors.
- Saying "evaporation"; while possible, incomplete transfer is a more direct and common error in this specific step.
Things to Be Careful About
The point to circle is the one visibly below the line on the right side (around ). The reason must relate to the concentration of reactant or product being lower than expected due to technique.
Determine the gradient of the line of best fit in Fig. 2.2. State the coordinates of both points you use in your calculation. These must be selected from the line of best fit. Give the gradient to three significant figures.
Working
Select two points on the line of best fit (far apart to minimize error):
Point 1:
Point 2:
Using other valid points, e.g., and :
Answer
Coordinates: and
Gradient = 600
Gradient = 600 (using coordinates such as (0.00300, 1.80) and (0.00360, 2.16))
Background Concept
The gradient of a line is calculated as . For a graph representing a theoretical equation, the gradient often contains physical constants or thermodynamic quantities that need to be extracted. To minimize reading errors, always use two points that are far apart on the line of best fit, not the data points themselves (which may contain anomalies).
Understanding the Question
You must determine the gradient of the line of best fit in Fig. 2.2. You must state the coordinates of the two points used, and give the gradient to 3 significant figures.
Approach
- Identify two points on the straight line of best fit (not the 'x' data points).
- Read their coordinates from the axes.
- Calculate .
Step-by-Step Reasoning
- Selecting points: Look for intersections of the line with grid lines.
- At , . This is a clear intersection.
- At , . This is also a clear intersection.
- Calculation:
- Significant figures: The coordinates are read to 3 or 4 decimal places. The gradient 600 can be written as to show 3 sig figs, or simply 600 if unambiguous. The mark scheme accepts 600.
Key Takeaways
When calculating gradient from a graph, use points on the line of best fit, ideally at the extremes of the line, to reduce the effect of reading errors. Always state the coordinates used.
Common Mistakes
- Using data points (the 'x' marks) instead of points on the line of best fit. The anomalous point will give a wrong gradient.
- Not reading the x-axis correctly (e.g., reading 0.0030 as 0.030).
- Calculating (inverse gradient).
Things to Be Careful About
The x-axis is in , ranging from 0.0028 to 0.0038. Minor grid lines are every 0.00002. Ensure you read the full decimal value. The mark scheme requires coordinates to be stated.
Use the gradient calculated in (e)(iii) and equation 2 to calculate a value for the enthalpy change of reaction, .
(If you were unable to obtain an answer to (e)(iii), then use the value . This is not the correct answer.)
= .................... kJ mol
Working
Equation 2:
This is in the form , where the gradient .
Rounding to appropriate figures (or nearest whole number as implied by context, though 3 sig figs is standard): .
Answer
-11.5 (or -11.5 to 3 s.f.)
-11.5 kJ mol^-1
Background Concept
The van 't Hoff equation in logarithmic form is . Plotting against gives a straight line with gradient . The gas constant .
Understanding the Question
You must use the gradient calculated in part (e)(iii) and equation 2 to find . The answer must be in .
Approach
- Equate the gradient from the graph to the theoretical expression for the gradient: .
- Rearrange to solve for .
- Substitute the gradient (600) and .
- Calculate in and convert to .
Step-by-Step Reasoning
- Rearrangement:
- Substitution:
- Calculation:
- Unit conversion: Divide by 1000 to get kJ:
- Rounding to 3 significant figures: .
Key Takeaways
The gradient of a vs graph directly gives the enthalpy change of reaction. Remember the factor of 2.303 (which converts natural log to base-10 log) and the sign (negative gradient means exothermic if is negative, wait: gradient is positive here, so is positive, meaning is negative, so exothermic). Let's check: gradient = 600 (positive). . Yes, exothermic. This makes sense: as increases (T decreases), increases, so increases. Lower temperature favors product, so forward reaction is exothermic.
Common Mistakes
- Forgetting the 2.303 factor (using instead of ).
- Forgetting the negative sign in the rearrangement.
- Not converting from J to kJ (giving -11483 instead of -11.5).
- Using the wrong value for (e.g., 8.314 is fine, but 8.31 is standard in CIE; 0.0821 is for with pressure in atm).
Things to Be Careful About
The question asks for the answer in . The calculation using gives J mol. You must divide by 1000. Also, ensure the sign is correct: a positive gradient on a vs plot indicates an exothermic reaction ().