Chemistry 9701/51 — May/June 2024
Cambridge A-Level · Planning, Analysis and Evaluation · worked solutions for every part, with the mark scheme
Topics Analysis, Conclusions and Evaluation · Planning
Titration can be used to determine the concentration of dissolved oxygen in samples of river water.
The procedure for the experiment is given.
step 1 Use five graduated syringes, A, B, C, D and E, to collect five separate samples of river water.
step 2 In the laboratory, carefully add of manganese(II) sulfate, , into syringe A and mix well.
step 3 Add of alkaline aqueous potassium iodide into syringe A and mix well.
step 4 Add of dilute sulfuric acid into syringe A and mix well.
step 5 Transfer the contents of syringe A into a conical flask. Rinse syringe A using of distilled water and add washings to the conical flask.
step 6 Carry out one accurate titration of all the contents in the conical flask with aqueous sodium thiosulfate, , using starch indicator.
Repeat steps 2–6 for the samples in syringes B–E.
Aqueous sodium thiosulfate can be prepared from .
Working
Answer
0.2482 g (0.248 g)
0.2482 g
Background Concept
A standard solution is prepared by dissolving a known mass of solute in a known total volume. The amount of solute is found from , and the mass is then . When the solute is a hydrated salt, the water of crystallisation is part of the formula unit and must be included in the molar mass.
Understanding the Question
The question asks for the mass of hydrated sodium thiosulfate, , needed to make of solution. The volume must be converted to before using .
Approach
- Convert to .
- Calculate moles of : .
- Calculate the molar mass of the hydrated salt.
- Multiply moles by molar mass to get the required mass.
Step-by-Step Reasoning
- .
- Molar mass of :
- Total .
- Mass .
The mark scheme accepts or .
Key Takeaways
- Always include water of crystallisation in the molar mass of a hydrated salt.
- Convert volume to before using .
- The mass needed is small because the concentration is very dilute.
Common Mistakes
- Using the anhydrous molar mass of () instead of .
- Forgetting to divide the volume by 1000.
- Quoting the answer without units.
Things to Be Careful About
- Use , not .
- Keep at least three significant figures in the final answer.
- The final answer should be in grams.
Identify the piece of apparatus that should be used to prepare of after the required mass of has been weighed out.
Answer
A 500 cm³ volumetric flask.
500 cm³ volumetric flask
Background Concept
A volumetric flask is designed to contain a precise volume of solution when filled to the graduation mark. It is the standard apparatus for preparing a solution of exact concentration.
Understanding the Question
After weighing the required mass of solid, the next step is to dissolve it and make the solution up to exactly . The question asks which piece of apparatus should be used for this.
Approach
Recognise that an exact final volume requires a volumetric flask, not a beaker or measuring cylinder.
Step-by-Step Reasoning
- Transfer the weighed solid quantitatively into the volumetric flask.
- Add distilled water, dissolve, then make up to the mark.
- Stopper and invert to mix.
Key Takeaways
- Volumetric flasks give an exact volume and are used to prepare standard solutions.
- The volume is stated on the flask, e.g. 500 cm³.
Common Mistakes
- Saying "beaker" or "measuring cylinder", which do not give the required accuracy.
- Saying "conical flask", which is not calibrated for exact volumes.
Things to Be Careful About
- The answer must include the volume (500 cm³) and the word "volumetric".
The graduations on each syringe are every .
Calculate the percentage error in the measurement of of alkaline aqueous potassium iodide by the syringe.
Show your working.
Working
Answer
20.0%
20.0%
Background Concept
Percentage error compares the absolute uncertainty of a measurement with the size of the measured quantity:
For a scale with divisions every , each reading has an uncertainty of half a division, .
Understanding the Question
The syringe graduations are every . The student measures of potassium iodide. The question asks for the percentage error in this measurement.
Approach
Identify the uncertainty in one reading, then account for the fact that a volume is obtained from two readings (the difference between initial and final positions), so the uncertainties add. Then apply the percentage error formula.
Step-by-Step Reasoning
- One scale division is , so one reading has uncertainty .
- The measured volume is a difference of two readings, so total uncertainty .
- Percentage error .
The mark scheme requires the working to be shown.
Key Takeaways
- Absolute uncertainty of a scale is half the smallest division.
- When a volume is found by difference, uncertainties of the two readings add.
- Percentage error decreases as the measured volume increases.
Common Mistakes
- Using only one reading uncertainty () and getting 10%.
- Forgetting to multiply by 100.
- Quoting the answer without the % sign.
Things to Be Careful About
- The mark scheme specifically uses ; show this step.
- Keep the units consistent: cancels in the ratio.
Place one tick (✓) in each row in Table 1.1 to show the effect, if any, of using a larger volume of alkaline aqueous potassium iodide.
Table 1.1
| greater effect | no effect | smaller effect | |
|---|---|---|---|
| uncertainty of the measurement | |||
| percentage error of the measurement |
Answer
| greater effect | no effect | smaller effect | |
|---|---|---|---|
| uncertainty of the measurement | ✓ | ||
| percentage error of the measurement | ✓ |
Uncertainty: no effect; percentage error: smaller
Background Concept
The absolute uncertainty of a measurement depends on the apparatus and its scale division, not on the amount being measured. The percentage error, however, is the absolute uncertainty divided by the measured value, so it depends on the size of the measurement.
Understanding the Question
If a larger volume of alkaline potassium iodide is used, how does this affect (1) the uncertainty of the measurement and (2) the percentage error? One tick must be placed in each row.
Approach
- Absolute uncertainty: unchanged, because the syringe scale is the same.
- Percentage error: since the denominator increases while the numerator stays the same, the percentage error becomes smaller.
Step-by-Step Reasoning
- The syringe graduations remain every , so the absolute uncertainty stays the same.
- A larger measured volume gives a smaller value of .
- Therefore: uncertainty has no effect; percentage error is smaller.
Key Takeaways
- Absolute uncertainty is a property of the apparatus.
- Percentage error is relative and decreases for larger measurements.
Common Mistakes
- Thinking a larger volume makes the uncertainty larger.
- Confusing "greater effect" with "smaller effect".
- Placing more than one tick in a row.
Things to Be Careful About
- Exactly one tick per row.
- The answer must distinguish the two rows clearly.
The sample in the conical flask and the prepared solution of sodium thiosulfate are provided.
Describe the following procedures for the experiment using syringe A.
Answer
- Rinse the burette with (0.00200 mol dm⁻³) sodium thiosulfate solution.
- Fill the burette with sodium thiosulfate solution and run some solution out through the jet to remove any air bubbles before taking readings.
Rinse with sodium thiosulfate; fill and run solution through the jet to remove air.
Background Concept
Before a burette is used, it must be clean and conditioned with the solution that will be placed in it. Rinsing with the titrant rather than distilled water prevents dilution of the solution. Any air bubble in the jet would cause an incorrect initial reading because solution would have to fill the bubble before reaching the sample.
Understanding the Question
The question asks how to prepare a clean burette before taking any readings, before the titration itself.
Approach
State the two essential actions: rinse with the titrant, then fill and expel air from the jet.
Step-by-Step Reasoning
- Rinsing with sodium thiosulfate removes any water or impurities and conditions the walls so the concentration of the titrant is not changed.
- Filling the burette and opening the tap allows solution to fill the jet, removing air bubbles.
- Only after this should the initial reading be taken.
Key Takeaways
- Always rinse a burette with the solution it will contain.
- Air bubbles in the jet cause systematic errors in the titre.
Common Mistakes
- Saying "rinse with distilled water" only; this would dilute the titrant.
- Forgetting to remove air from the jet.
- Describing the titration itself instead of the preparation.
Things to Be Careful About
- The mark scheme awards one mark for rinsing with sodium thiosulfate and one for filling and running solution through the jet.
- Use the correct concentration if you mention it.
Answer
- Add sodium thiosulfate solution from the burette to the conical flask, swirling continuously.
- Near the end-point, add the solution dropwise until the colour change is permanent (starch indicator changes from blue-black to colourless).
Add thiosulfate with swirling; near the end-point add dropwise until a permanent colour change.
Background Concept
In a titration the titrant is added until the reaction is just complete. With starch indicator, iodine forms a blue-black complex; when all the iodine has been reduced by thiosulfate, the blue-black colour disappears. To find the exact end-point, the addition must be slowed near the end.
Understanding the Question
The question asks how to carry out the one accurate titration in step 6, using the prepared burette and the sample in the conical flask.
Approach
Describe adding thiosulfate with swirling, then slowing to dropwise addition near the end-point until a permanent colour change is seen.
Step-by-Step Reasoning
- Run sodium thiosulfate into the flask while swirling to mix the reactants.
- As the end-point approaches, the colour change becomes slower; add the solution dropwise.
- Stop when the blue-black colour disappears permanently.
- Record the final burette reading.
Key Takeaways
- Swirling ensures complete mixing.
- Dropwise addition near the end-point gives an accurate titre.
- The end-point is a permanent colour change.
Common Mistakes
- Adding the titrant too quickly and overshooting.
- Stopping at the first transient colour change.
- Not swirling, leading to local excess and an inaccurate end-point.
Things to Be Careful About
- The mark scheme awards one mark for adding until the colour change/end-point and one for dropwise addition near the end.
- The colour change with starch is blue-black to colourless.
Answer
To ensure the reactions in steps 2–4 are complete / all the reactants are thoroughly mixed.
To ensure the reactions are complete.
Background Concept
In the Winkler-type dissolved oxygen method, several reagents are added in sequence. The dissolved oxygen must react fully with the added reagents before the titration step, otherwise the titre will not represent all the oxygen present.
Understanding the Question
The procedure says to mix well after adding each reagent. The question asks why this is necessary.
Approach
State that mixing ensures the reaction goes to completion.
Step-by-Step Reasoning
- Each reagent must be evenly distributed through the sample.
- Mixing brings reactants into contact so the reaction can go to completion.
- If mixing were incomplete, some oxygen might remain unreacted and the final titre would be too low.
Key Takeaways
- Mixing is a practical step to ensure complete reaction.
- The mark scheme accepts "to ensure the reaction(s) is/are complete".
Common Mistakes
- Saying "to make it react faster" rather than "to ensure complete reaction".
- Giving an irrelevant reason such as "to dissolve the reagents".
Things to Be Careful About
- Use the word "complete" or "thoroughly mixed" to match the mark scheme.
Answer
| A | B | C | D | E | |
|---|---|---|---|---|---|
| final burette reading / cm³ | |||||
| initial burette reading / cm³ | |||||
| titre / cm³ |
Table with columns A–E and rows for final/initial readings and titre, units cm³.
Background Concept
A titration results table must record the initial and final burette readings and the titre for each titration. Headings must include units so that the numbers in the cells are pure values. Here there are five samples, so five columns are needed.
Understanding the Question
The question asks for a table to record the titration results for the five samples in syringes A–E.
Approach
Create a table with five columns labelled A–E and rows for final reading, initial reading and titre. Include units in the headings.
Step-by-Step Reasoning
- Each column represents one syringe/sample.
- The rows are: final burette reading, initial burette reading, titre.
- Units are written in the heading as "/ cm³" or "in cm³", not repeated in every cell.
- The titre is the difference between final and initial readings.
Key Takeaways
- Units belong in headings, not in each cell.
- A titration table needs initial, final and titre rows.
- Five samples require five columns.
Common Mistakes
- Missing units in headings.
- Only one column for all samples.
- Omitting the titre row.
- Writing units in every cell.
Things to Be Careful About
- The mark scheme gives one mark for correct headings and units and one mark for five columns A–E.
- Use "titre" or "volume of sodium thiosulfate used".
The overall reaction taking place in the experiment is shown.
A student carries out the experiment and determines the mean titre to be .
Calculate the concentration, in , of dissolved oxygen in the river water.
Working
Answer
2.11 × 10⁻⁴ mol dm⁻³
2.11 × 10^-4 mol dm^-3
Background Concept
In a titration, the amount of titrant used is found from . The balanced equation gives the stoichiometric ratio between the titrant and the analyte. Here the equation shows that 1 mol of reacts with 4 mol of .
Understanding the Question
The mean titre of sodium thiosulfate is . Each sample was of river water. We need the concentration of dissolved oxygen in .
Approach
- Calculate moles of thiosulfate from the titre.
- Use the 4:1 ratio to find moles of oxygen.
- Divide by the sample volume in to get concentration.
Step-by-Step Reasoning
- .
- From the equation, .
- Sample volume .
- .
The mark scheme gives the method mark for the moles of thiosulfate and the second mark for dividing by 4 and by the sample volume.
Key Takeaways
- Always use the stoichiometric ratio from the balanced equation.
- Convert all volumes to before calculating concentration.
- The sample volume is , not the titre volume.
Common Mistakes
- Using a 1:1 ratio instead of 4:1.
- Dividing by instead of .
- Forgetting to convert to .
- Quoting the answer without units.
Things to Be Careful About
- Give the final answer to three significant figures.
- The units are .
- Show the division by 4 explicitly to earn the stoichiometry mark.
Freshly distilled water does not contain any dissolved oxygen.
A student decides to run the procedure on a sample of freshly distilled water and at the end obtains a value of dissolved oxygen.
Suggest why the student did not get a value of . Assume the procedure was carried out correctly.
Answer
The other solutions/reagents used (e.g. manganese(II) sulfate, potassium iodide, sulfuric acid, distilled water) contain a small amount of dissolved oxygen.
Small amount of dissolved oxygen in the reagents/solutions.
Background Concept
A blank experiment uses a sample that should contain none of the analyte. Here freshly distilled water should contain no dissolved oxygen, so any positive result must come from elsewhere. The added reagents themselves can contain dissolved oxygen.
Understanding the Question
The student runs the procedure on freshly distilled water and obtains a small non-zero value. The procedure was carried out correctly, so the question asks for a reason.
Approach
Look for a source of oxygen other than the water sample itself.
Step-by-Step Reasoning
- Distilled water contains no dissolved oxygen by assumption.
- The reagents added in steps 2–4, and the distilled water used for rinsing, may contain dissolved oxygen.
- This oxygen also reacts and contributes to the titre, giving a small positive value.
Key Takeaways
- Blank experiments identify contributions from reagents and apparatus.
- A non-zero blank does not mean the procedure was done incorrectly.
Common Mistakes
- Saying the distilled water contained oxygen (contradicts the stem).
- Blaming the student's technique when the procedure was correct.
- Saying "oxygen from the air" without linking to the reagents; the mark scheme specifically mentions oxygen in the other solutions/reagents.
Things to Be Careful About
- Phrase the answer as "oxygen in the other solutions/reagents" to match the mark scheme.
Answer
Subtract the blank value () from the concentration of dissolved oxygen calculated in (f).
Subtract 2.26 × 10^-5 mol dm^-3 from the result in (f).
Background Concept
A blank correction removes the contribution of dissolved oxygen from the reagents. The blank result represents oxygen that was not originally in the river water, so it should be subtracted from the measured concentration.
Understanding the Question
The blank experiment gave . The question asks how this value can improve the answer in part (f).
Approach
Use the blank as a correction: subtract it from the value obtained in (f).
Step-by-Step Reasoning
- The value in (f) includes oxygen from the river water plus oxygen from the reagents.
- The blank gives the contribution from the reagents alone.
- Corrected concentration .
Key Takeaways
- Blank corrections remove systematic errors from reagents.
- The corrected value is always lower than the uncorrected value.
Common Mistakes
- Adding the blank value instead of subtracting.
- Dividing or multiplying by the blank value.
- Not stating that the subtraction is from the result in (f).
Things to Be Careful About
- The units are the same () so subtraction is valid.
- Use the exact value in the answer.
Suggest why this method is unsuitable for samples of tap water that have been purified by chlorination and so contain .
Answer
Chlorine is an oxidising agent and reacts in the same way as oxygen (or reacts with Mn²⁺ / I⁻ / S₂O₃²⁻), so it would be measured as if it were dissolved oxygen, giving an incorrect result.
Chlorine is an oxidising agent that interferes/reacts like oxygen.
Background Concept
The dissolved oxygen method relies on redox reactions: oxygen oxidises iodide to iodine, which is then titrated with thiosulfate. Any other oxidising agent present in the sample can do the same thing, producing iodine and increasing the titre.
Understanding the Question
Tap water purified by chlorination contains . The question asks why the method is unsuitable for such samples.
Approach
Identify chlorine as an oxidising agent that participates in the same redox chemistry as oxygen.
Step-by-Step Reasoning
- is a strong oxidising agent.
- It can oxidise iodide to iodine, exactly as oxygen does.
- The iodine produced is then titrated, so the result appears as if there were more dissolved oxygen.
- The method therefore cannot distinguish oxygen from chlorine.
The mark scheme accepts any of: chlorine is an oxidising agent; chlorine reacts in the same way as oxygen; chlorine reacts with / / / reactants.
Key Takeaways
- This method measures oxidising agents, not specifically oxygen.
- Interfering species must be absent for accurate results.
Common Mistakes
- Saying chlorine "kills bacteria" or "is toxic" without linking to redox.
- Saying chlorine reacts with oxygen.
- Not explaining why this gives an incorrect oxygen concentration.
Things to Be Careful About
- Use the term "oxidising agent" for a concise mark-scheme answer.
- Mention that it interferes with the titration/chemistry.
The activation energy, , for the reaction between dilute hydrochloric acid, , and aqueous sodium thiosulfate, , can be determined by an initial rates method.
The solid sulfur formed is seen as a white suspension in the reaction mixture. The reactants are mixed and the time, , for a fixed quantity of sulfur to be formed is recorded.
A measure of the initial rate of the reaction is .
Standard solutions of and are supplied.
Measurements are taken for a series of temperatures using the following procedure.
step 1 A thermostatically controlled water bath is set up.
step 2 A conical flask is labelled A and a second conical flask is labelled B.
step 3 of is added to flask A. Flask A is placed in the water bath.
step 4 of is added to flask B. Flask B is placed in the same water bath.
step 5 Wait for 10 minutes.
step 6 Flask A is removed from the water bath and placed on a tile marked with a black cross.
step 7 The contents of flask B are added to flask A and a timer started.
step 8 The timer is stopped when the black cross is no longer visible. The time is recorded.
Answer
To ensure the solutions in flasks A and B reach thermal equilibrium with the water bath (and are at the same temperature) before mixing.
To ensure the solutions in flasks A and B reach thermal equilibrium with the water bath (and are at the same temperature) before mixing.
Background Concept
In kinetics experiments where the initial rate is measured at a specific temperature, the temperature of the reactants must be precisely controlled and known at the moment of mixing. If reactants are at different temperatures, the initial temperature of the mixture is ambiguous, and the reaction will proceed at a rate corresponding to a changing temperature rather than a fixed initial temperature.
Understanding the Question
The question asks why the two flasks containing the reactants are left in the thermostatically controlled water bath for 10 minutes before being mixed. This is a standard step in initial rates experiments.
Approach
Think about what happens when a liquid is placed in a temperature-controlled environment. Heat transfer will occur until thermal equilibrium is reached. The 10-minute wait ensures this equilibrium is achieved for both reactants independently.
Step-by-Step Reasoning
- Step 5 involves leaving flasks A and B in the water bath.
- The water bath is thermostatically controlled, meaning it maintains a constant temperature.
- Leaving the flasks for 10 minutes allows sufficient time for heat to transfer between the water bath and the solutions in both flasks.
- This ensures both solutions reach the exact temperature of the water bath and are at thermal equilibrium with each other.
- When they are mixed in step 7, the initial temperature of the reaction mixture is known and uniform, allowing the time to be meaningfully related to that specific temperature.
Key Takeaways
Always allow reactants to equilibrate to the reaction temperature before mixing in initial rates experiments. This ensures the measured rate corresponds to a well-defined, constant initial temperature.
Common Mistakes
- Saying "to heat the reactants": this is incomplete and doesn't explain why they need to be heated (to reach equilibrium).
- Saying "to ensure they are the same temperature": while true, it misses the crucial link to the water bath temperature (thermal equilibrium).
Things to Be Careful About
- Use precise terminology: "thermal equilibrium" or "same temperature as the water bath".
- Do not say "to prevent the reaction from starting early"; the reaction only starts when they are mixed.
The procedure does not mention how a value for the temperature of the mixture during the reaction is obtained.
State the temperature measurements that should be taken and at which stage in the procedure they should be taken.
Answer
Measure the temperature of the mixture in flask A:
- At the start of the reaction (immediately before step 7 / after step 6).
- At the end of the reaction (when the black cross is no longer visible / immediately after step 8).
Measure the temperature of the mixture in flask A at the start of the reaction (immediately before step 7) and at the end of the reaction (when the cross is no longer visible).
Background Concept
In exothermic or endothermic reactions, the temperature of the mixture changes as the reaction proceeds. For an initial rates experiment, we need a single representative temperature for the reaction. Since the reaction is relatively fast and the mixture is not perfectly insulated, the temperature will drift during the time .
Understanding the Question
The procedure does not specify how to determine the temperature during the reaction. We need to identify when to take temperature readings to capture the temperature at the start and end of the measured time interval.
Approach
Identify the time interval being measured (from step 7 to step 8). To get an accurate temperature for this interval, we should measure the temperature at the beginning and end of this interval.
Step-by-Step Reasoning
- The reaction starts at step 7 when flask B is added to flask A.
- The reaction ends at step 8 when the cross is no longer visible.
- To capture the temperature range during this interval, measure the temperature of the mixture in flask A:
- At the start: Immediately before step 7 (or after step 6, once mixed but before the timer starts). This gives the initial temperature.
- At the end: Immediately after step 8 (when the cross is no longer visible). This gives the final temperature.
- These two measurements bracket the reaction time .
Key Takeaways
When a reaction causes a temperature change, measure the temperature at the start and end of the reaction interval to establish the temperature range during which the reaction occurred.
Common Mistakes
- Suggesting to measure the temperature of the water bath: the water bath temperature is already known; we need the mixture temperature.
- Only measuring at one point: a single measurement doesn't account for any temperature change during the reaction.
Things to Be Careful About
- Specify which flask or mixture: the temperature of the reaction mixture in flask A after mixing, not the separate reactants.
- Be precise about when: "before step 7" and "after step 8" are clearer than "at the beginning and end".
State how to use the temperature measurements to determine an accurate value for the temperature of the mixture during the reaction.
Answer
Calculate the mean (average) of the two temperature measurements.
Calculate the mean (average) of the two temperature measurements.
Background Concept
When a quantity changes linearly (or approximately linearly) over a time interval, the average value over that interval is well-approximated by the arithmetic mean of the initial and final values.
Understanding the Question
Having taken two temperature measurements (start and end of reaction), how do we combine them to get a single accurate value for the temperature during the reaction?
Approach
Use basic statistics: the mean of two values gives the midpoint, which is a good estimate for the average temperature during the interval.
Step-by-Step Reasoning
- Let be the temperature at the beginning of the reaction.
- Let be the temperature at the end of the reaction.
- The temperature during the reaction is assumed to change approximately linearly between these two values.
- The mean temperature is .
- This mean value is used as the representative temperature for calculating and plotting the graph.
Key Takeaways
The arithmetic mean of initial and final temperatures provides a reasonable estimate for the average temperature during a reaction interval, assuming no significant heat loss or gain.
Common Mistakes
- Taking the temperature of the water bath instead: this ignores any temperature change in the reaction mixture.
- Using a weighted average without justification: the simple mean is the standard and expected method.
Things to Be Careful About
- Ensure the temperatures are in the same units (usually ) before calculating the mean.
- The mean temperature is then converted to Kelvin for use in the Arrhenius equation.
A student carries out the procedure at three different temperatures and records the measurements in Table 2.1.
Complete Table 2.1. Record values for temperature to the nearest whole number and the values for to four decimal places.
Table 2.1
| temperature, | time, | temperature, | |
|---|---|---|---|
| 15 | 176 | ||
| 24 | 92 | ||
| 32 | 62 |
Working
Conversions:
Calculations:
- For : ;
- For : ;
- For : ;
Answer
| temperature, | time, | temperature, | |
|---|---|---|---|
| 15 | 176 | 288 | 0.0057 |
| 24 | 92 | 297 | 0.0109 |
| 32 | 62 | 305 | 0.0161 |
See working
Background Concept
The Arrhenius equation relates the rate constant to temperature :
Taking the logarithm (base 10) of both sides:
Since the initial rate is proportional to (where is the time for a fixed amount of product to form), we can use as a proxy for . The equation becomes:
This is a linear equation of the form , where , , and the gradient .
Understanding the Question
We are given temperatures in and times in seconds. We need to convert the temperatures to Kelvin (required for the Arrhenius equation) and calculate to four decimal places (as specified).
Approach
- Convert to using .
- Calculate for each time value and round to four decimal places.
Step-by-Step Reasoning
Row 1: ,
- (to 4 d.p.)
Row 2: ,
- (to 4 d.p.)
Row 3: ,
- (to 4 d.p.)
Key Takeaways
Always convert temperatures to Kelvin when using the Arrhenius equation. Pay close attention to significant figures as specified in the question.
Common Mistakes
- Forgetting to convert to Kelvin: using in will give completely wrong results.
- Incorrect rounding: rounds to , not .
- Using natural log () instead of base-10 log (): the equation given uses (base 10), and the constant comes from .
Things to Be Careful About
- The question asks for to four decimal places, not four significant figures. has two significant figures but four decimal places.
- Ensure the calculator is set to the correct log base when plotting later (though here we just need ).
A second student carries out the procedure at six different temperatures and analyses their data to give the results in Table 2.2.
Table 2.2
| 0.00353 | –2.43 |
| 0.00336 | –1.99 |
| 0.00325 | –1.68 |
| 0.00314 | –1.47 |
| 0.00302 | –1.21 |
| 0.00287 | –0.82 |
Use the results from Table 2.2 to plot a graph on the grid in Fig. 2.1 to show the relationship between and . Use a cross (×) to plot each data point. Draw a line of best fit.
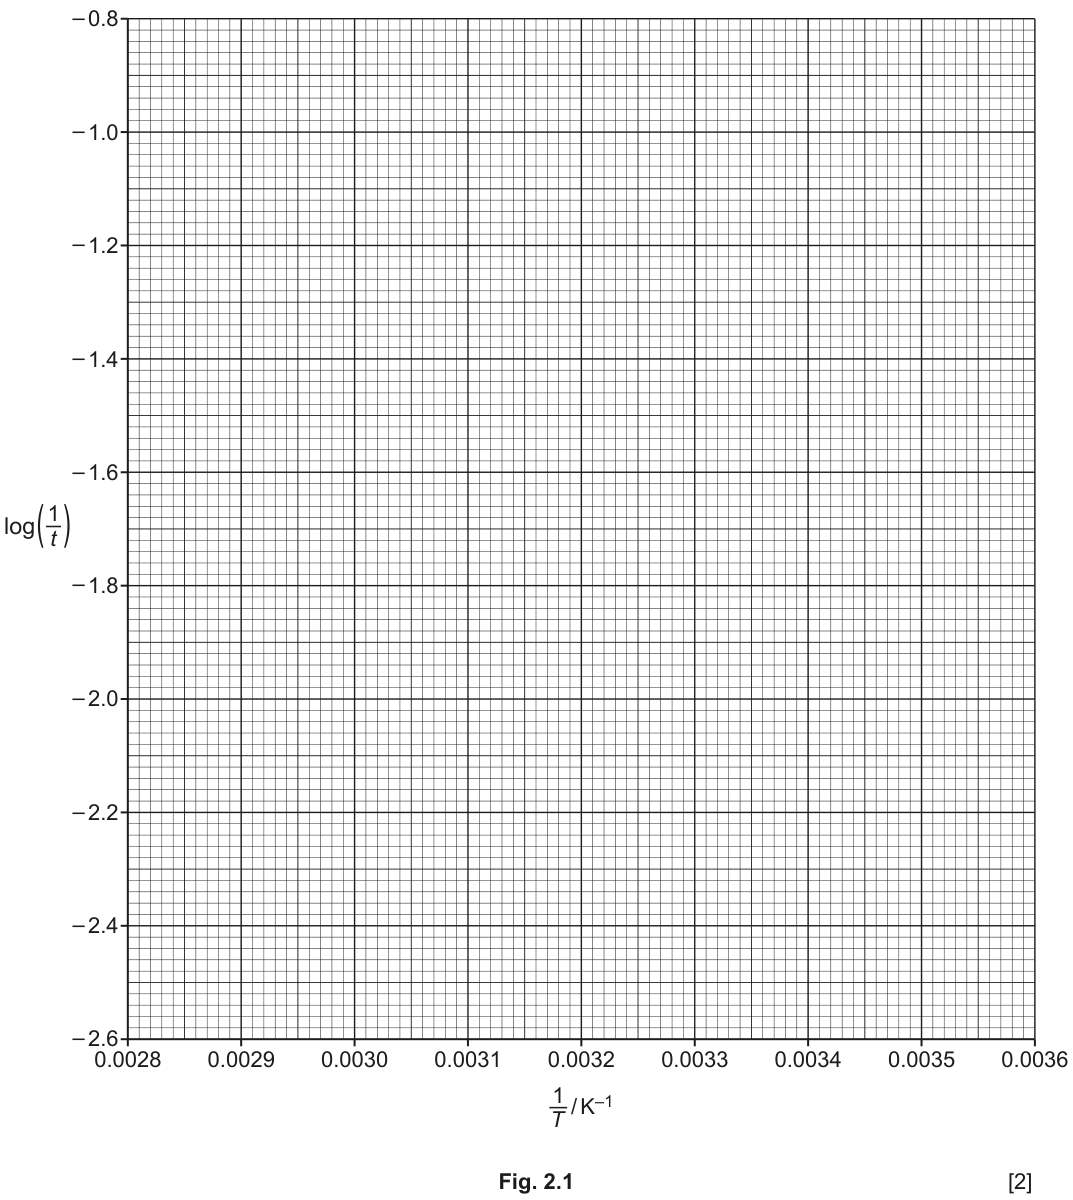
Answer
Plot the following points using × marks on the grid in Fig. 2.1:
Draw a straight line of best fit that passes close to all points, balancing the points above and below the line. One point (e.g., ) may be slightly off the line and can be treated as an anomaly.
See diagram
Background Concept
A graph of against should yield a straight line if the reaction follows Arrhenius behavior. The gradient of this line is related to the activation energy by:
Plotting the data correctly is essential for determining an accurate gradient.
Understanding the Question
We are given six pairs of values from Table 2.2 and asked to plot them on the provided grid and draw a line of best fit.
Approach
- Identify the axes: -axis is , -axis is .
- Plot each point carefully, ensuring correct alignment with the grid lines.
- Draw a straight line of best fit using a ruler, ensuring it passes as close as possible to all points, with roughly equal numbers of points above and below the line.
Step-by-Step Reasoning
Plotting points:
- : Near the top right.
- : Middle right.
- : Middle.
- : Middle left.
- : Lower left.
- : Bottom left.
Line of best fit:
- The points generally follow a linear trend with a negative gradient.
- A straight line drawn through the middle of the data cloud will have a gradient of approximately to .
- The point might lie slightly below the line; this is acceptable as an anomaly.
Key Takeaways
When plotting a graph for a linear relationship, always use a ruler for the line of best fit. Do not connect the dots with a zig-zag line.
Common Mistakes
- Plotting points incorrectly: misreading the axis scales (e.g., is not ).
- Drawing a curve instead of a straight line: the Arrhenius equation gives a linear relationship.
- Forcing the line through the origin: the line does not necessarily pass through .
Things to Be Careful About
- The -axis scale: increments of , so is small squares to the right of .
- The -axis scale: increments of , so is small squares below .
- Use × marks as specified, not dots or circles.
Determine the gradient of your line of best fit in Fig. 2.1. State the coordinates of both points you use in your calculation. These must be selected from your line of best fit. Give the gradient to three significant figures.
coordinates 1 .............................................. coordinates 2 ..............................................
Answer
Coordinates 1:
Coordinates 2:
Gradient calculation:
Gradient = (to 3 significant figures)
Gradient = -2.50 x 10^3 K
Background Concept
The gradient of the line of best fit is used to calculate the activation energy. It is crucial to use coordinates from the line of best fit, not from the original data points, to minimize the effect of experimental errors.
Understanding the Question
We need to determine the gradient of the line drawn in part (d)(i). We must state two coordinates from the line and show the calculation.
Approach
- Choose two points on the line of best fit that are far apart to minimize reading errors.
- Ensure the points are at convenient grid intersections or can be read accurately.
- Apply the gradient formula: .
Step-by-Step Reasoning
Selecting points:
- Look for points where the line crosses grid intersections clearly.
- Point 1: Let's use . This is on the line near the top right.
- Point 2: Let's use . This is on the line near the bottom left.
- These points are well-separated, reducing the relative error in the gradient calculation.
Calculating gradient:
Significant figures:
- The question asks for three significant figures.
- can be written as to clearly show 3 s.f.
- Alternatively, is acceptable if the context implies 3 s.f., but scientific notation is safer.
Key Takeaways
Always use points from the line of best fit, not the data points. Choose points that are far apart to minimize percentage error in the gradient.
Common Mistakes
- Using data points instead of line coordinates: this gives the gradient of a line through two specific points, not the best fit.
- Incorrect subtraction: must be calculated carefully, especially with negative numbers.
- Wrong number of significant figures: has 2, 3, or 4 s.f. depending on context; use for 3 s.f.
Things to Be Careful About
- The coordinates must be explicitly stated as requested.
- The gradient is negative; do not lose the sign.
- The units of the gradient are (since is dimensionless and is ).
An equation relating time and temperature variables is shown.
Determine the activation energy, , of this reaction using this equation and your answer to (d)(ii).
(If you were unable to find the gradient in (d)(ii), then use the value . This is not the correct answer.)
Include units in your answer.
Show your working.
Working
Equation relating gradient and :
Comparing with , the gradient .
Rearranging for :
Substitution:
- Gradient =
Convert to kJ mol:
Answer
47.9 kJ mol^-1
Background Concept
The Arrhenius equation in logarithmic form is:
Converting to base-10 logarithm ():
Since , we have:
For an initial rates experiment, , so is proportional to . The gradient of the graph against is therefore:
Understanding the Question
We are given the equation and asked to calculate using the gradient from part (d)(ii). We must include units.
Approach
- Rearrange the gradient equation to solve for .
- Substitute the gradient value and the gas constant .
- Calculate in J mol, then convert to kJ mol.
Step-by-Step Reasoning
Rearranging the equation:
Substituting values:
- Gradient = (from part d(ii))
Converting units:
- Divide by 1000 to get kJ mol:
- Round to 3 significant figures: .
Key Takeaways
The factor comes from . Always check whether the equation uses or and use the correct constant.
Common Mistakes
- Forgetting the negative sign: the gradient is negative, and must be positive.
- Using but not converting the final answer to kJ mol: the mark scheme requires kJ mol.
- Using the wrong value for : is the correct value for energy calculations.
- Calculating instead of rearranging correctly.
Things to Be Careful About
- The gas constant is , not (which is for ideal gas law).
- The gradient has units of K (since is dimensionless and is ). When multiplied by (J K mol), the K cancels, giving J mol.
- The question provides a fallback gradient of if you couldn't calculate it. Using this:
This would also be accepted if the working is correct.
Use your graph to state whether the results from the experiment are reliable. Justify your answer.
Answer
Yes, the results are reliable.
Justification: Most points lie on or near the line of best fit, with no significant anomalous points (or only one minor anomaly), indicating a strong linear relationship consistent with the Arrhenius equation.
Yes, the results are reliable because most points lie on or near the line of best fit, indicating a strong linear relationship.
Background Concept
The reliability of experimental data is assessed by how well the data fits the expected theoretical model. For a linear relationship, we look at:
- How close the points are to the line of best fit.
- The number of anomalous points (outliers).
- The strength of the correlation (how tightly the points cluster around the line).
Understanding the Question
We need to state whether the results are reliable and justify the answer based on the graph.
Approach
Examine the graph from part (d)(i). Count how many points lie on or near the line. Identify any anomalies. Draw a conclusion based on the overall trend.
Step-by-Step Reasoning
Observing the graph:
- Five out of six points lie very close to the line of best fit.
- One point (e.g., ) may lie slightly off the line, but this is a minor deviation.
- The overall trend is strongly linear, which is expected for the Arrhenius equation.
Conclusion:
- The results are reliable because the data shows a clear linear relationship with minimal scatter.
- The minor deviation of one point could be due to random experimental error (e.g., slight variation in timing or temperature measurement), but it does not invalidate the overall trend.
Alternative answer:
- If a student identifies a more significant anomaly or notes that points are widely scattered, they could argue the results are not reliable. However, the mark scheme accepts either answer as long as it is justified by the graph.
Key Takeaways
Reliability is about consistency and fit to the expected model. A few minor anomalies do not necessarily make data unreliable if the overall trend is clear.
Common Mistakes
- Saying "yes, because the line is straight": this is circular reasoning; you must explain why a straight line indicates reliability.
- Not mentioning the number of anomalous points: the justification must reference the graph.
- Saying "yes, because we used a line of best fit": the line is drawn because the data is reliable, not the other way around.
Things to Be Careful About
- The justification must be based on the graph, not on general statements about the experiment.
- Use terms like "most points lie on or near the line" or "few anomalous points".
- If you say "no", you must justify it by pointing to specific anomalies or poor fit.
Suggest a change to one controlled variable that the student could make so that the time measured for a given temperature is shorter.
Answer
Increase the concentration of one or both of the reactants (e.g., use a more concentrated or solution).
Increase the concentration of one or both of the reactants.
Background Concept
The rate of a reaction depends on the concentration of the reactants (for reactions that are not zero order with respect to a reactant). The rate equation is:
where and are the orders of reaction with respect to each reactant.
For this reaction, the rate is typically first order with respect to and first order with respect to (or at least not zero order for either). Therefore, increasing the concentration of either reactant will increase the rate.
Since , increasing the rate means decreasing the time .
Understanding the Question
We want the time measured for a given temperature to be shorter. This means we want the reaction to proceed faster. We need to suggest a change to a controlled variable that would achieve this.
Approach
Think about what factors affect the rate of reaction:
- Temperature (already controlled and fixed for each experiment)
- Concentration of reactants (can be changed)
- Catalyst (not applicable here)
- Surface area (not applicable for solutions)
Since we are looking for a change to a controlled variable (a variable that is kept constant during the experiment but could be changed between experiments), concentration is the most appropriate answer.
Step-by-Step Reasoning
- The time is inversely proportional to the rate: .
- To make shorter, we need to increase the rate.
- The rate depends on the concentrations of and .
- If we increase the concentration of (e.g., from to ), the rate will increase, and will decrease.
- Similarly, increasing the concentration of will increase the rate.
- Note: We cannot change the temperature, as that is the independent variable being investigated. We are looking for a change to a variable that is currently controlled (kept constant) but could be adjusted to speed up the reaction.
Key Takeaways
To decrease reaction time (increase rate), increase the concentration of reactants (assuming the reaction is not zero order with respect to them).
Common Mistakes
- Suggesting to increase the temperature: temperature is the independent variable; we are asked for a change to a controlled variable for a given temperature.
- Suggesting to add a catalyst: there is no catalyst for this reaction, and the question asks for a change to a controlled variable (concentration is more appropriate).
- Suggesting to decrease the volume: changing the volume while keeping the same concentration does not change the rate (rate depends on concentration, not volume). However, if the volume is decreased, the total amount of product needed to obscure the cross might also change, which complicates the experiment.
Things to Be Careful About
- The question asks for a change to one controlled variable.
- The change must result in a shorter time.
- Increasing concentration is the most straightforward and correct answer. Be specific: "increase the concentration of HCl" or "increase the concentration of Na2S2O3".