Chemistry 9701/52 — February/March 2024
Cambridge A-Level · Planning, Analysis and Evaluation · worked solutions for every part, with the mark scheme
Topics Analysis, Conclusions and Evaluation · Planning
Sea water contains about of chloride ions, .
The exact concentration of in sea water can be determined by titration with aqueous silver ions, , using aqueous potassium chromate(VI), , as an indicator.
When aqueous silver nitrate, , is added to a sample of sea water, silver ions react with chloride ions to form a precipitate of silver chloride.
When all of the has reacted with , the presence of unreacted is detected by chromate(VI) ions, . A red precipitate of is seen.
The amount of reacting with in the sample of sea water can be calculated in order to determine the concentration of in the sample of sea water.
A student uses the following method.
step 1 Use a weighing boat to weigh by difference approximately of into a glass beaker.
step 2 Use the sample of in the glass beaker to prepare of .
step 3 Transfer this solution into a dark brown glass bottle. Label this solution X.
step 4 Collect a sample of sea water and remove any solid material present.
step 5 Transfer of the sea water into a conical flask.
step 6 Add of to the conical flask.
step 7 Rinse a burette in preparation for the titration.
step 8 Fill the burette with solution X.
step 9 Slowly add solution X to the conical flask until the white precipitate turns red. This is the end-point.
Describe how the student should carry out step 1. Include a table in your answer to show how this process is recorded.
Answer
Place the weighing boat on the balance and add approximately 10.6 g of AgNO₃(s). Record the mass of the boat + AgNO₃. Transfer the AgNO₃(s) into the 100 cm³ beaker. Reweigh the empty weighing boat and record this mass. The mass of AgNO₃ transferred is the difference between the two readings.
| / g | |
|---|---|
| Mass of boat + AgNO₃ before transfer | |
| Mass of boat after transfer | |
| Mass of AgNO₃ transferred |
Weigh boat + AgNO₃, transfer to beaker, reweigh empty boat; mass transferred = difference. Table with three rows and unit g.
Background Concept
Weighing by difference is a laboratory technique for measuring the mass of a solid that is transferred from one container to another. Instead of trying to place a powder directly on a balance pan (which is messy and inaccurate), you weigh the container holding the solid, transfer some of the solid to the destination vessel, and then reweigh the now-lighter container. The mass transferred equals the difference between the two weighings. This method automatically accounts for any solid that sticks to the original container, because that residue is included in the "after" mass.
Understanding the Question
The student is told to "weigh by difference approximately 10.6 g of AgNO₃(s) into a 100 cm³ glass beaker." The question asks you to describe exactly how to do this and to present a table showing how the process is recorded. The two marks are for (M1) the correct order of weighing operations and (M2) a correctly formatted table with units.
Approach
The procedure has three logical steps: weigh the boat with the solid, transfer the solid, reweigh the empty boat. The table must have three rows — mass before transfer, mass after transfer, and the calculated mass transferred — with the unit "g" in the header.
Step-by-Step Reasoning
- Place a clean, dry weighing boat on the balance. Add approximately 10.6 g of AgNO₃(s) to it. Record the mass of boat + AgNO₃.
- Carefully tip the AgNO₃(s) into the 100 cm³ beaker. You do not need to get every grain out — that is the point of weighing by difference.
- Reweigh the empty (or nearly empty) weighing boat and record this mass.
- The mass of AgNO₃ transferred = (mass of boat + AgNO₃ before) − (mass of boat after).
The table should look like this, with the unit in the header:
| / g | |
|---|---|
| Mass of boat + AgNO₃ before transfer | |
| Mass of boat after transfer | |
| Mass of AgNO₃ transferred |
The "Mass of AgNO₃ transferred" row is a calculated value, not a direct reading.
Key Takeaways
Weighing by difference is the standard way to transfer a solid accurately. The table must always include units in the header, and the transferred mass is a difference of two readings.
Common Mistakes
- Forgetting to reweigh the empty boat — without the second weighing you cannot find the mass transferred.
- Putting the unit "g" in every cell instead of once in the header.
- Weighing the beaker before and after instead of the boat (the question specifically says the solid is transferred from the boat).
- Saying "weigh 10.6 g of AgNO₃ directly" — you cannot weigh a powder directly onto a balance easily.
Things to Be Careful About
The mark scheme credits the order of operations (M1) and the table with units (M2). Make sure both are present. The mass transferred is approximate ("approximately 10.6 g"), so you do not need to hit exactly 10.6 g — the precise mass is found by difference.
Describe how the student should prepare of in step 2, starting with the in the beaker in step 1.
Answer
- Dissolve the AgNO₃(s) in the beaker using a small volume of distilled water.
- Transfer the solution into a 250 cm³ volumetric flask. Rinse the beaker (and stirring rod) with distilled water and add the rinsings to the flask.
- Make up to the 250 cm³ mark with distilled water (add the final drops with a dropping pipette) and mix thoroughly.
Dissolve in distilled water, transfer to 250 cm³ volumetric flask with rinsing, make up to the mark.
Background Concept
To prepare a solution of accurately known concentration from a solid, you use a volumetric flask. A 250.0 cm³ volumetric flask is calibrated to contain exactly 250.0 cm³ when filled to the mark on its neck. The solid must be completely dissolved and quantitatively transferred — meaning every last particle is rinsed into the flask — before the flask is made up to the mark.
Understanding the Question
The student has the AgNO₃(s) in a 100 cm³ beaker (from step 1) and must prepare 250.0 cm³ of AgNO₃(aq). The three marks are for: (M1) dissolving the solid in water, (M2) transferring to the volumetric flask and rinsing, (M3) making up to the mark.
Approach
The sequence is: dissolve → transfer → rinse → make up to mark. Each step ensures the full mass of AgNO₃ ends up in the flask and the final volume is exactly 250.0 cm³.
Step-by-Step Reasoning
- Add a small volume of distilled water to the beaker containing the AgNO₃(s) and stir with a glass rod until the solid has completely dissolved. (M1)
- Pour the solution through a funnel into a 250 cm³ volumetric flask. (M2, first half)
- Rinse the beaker, the stirring rod and the funnel with distilled water, and add the rinsings to the flask. This ensures no AgNO₃ is left behind — a "quantitative transfer". (M2, second half)
- Add distilled water until the bottom of the meniscus sits exactly on the 250 cm³ mark. The final few drops should be added with a dropping pipette to avoid overshooting. Stopper the flask and invert it several times to mix the solution thoroughly. (M3)
Key Takeaways
Preparing a standard solution requires quantitative transfer (rinsing) and accurate filling to the calibration mark. The meniscus is read at eye level, at its bottom.
Common Mistakes
- Not rinsing the beaker and rod — this leaves AgNO₃ behind and the concentration will be too low.
- Filling past the mark — the solution is then too dilute and cannot be corrected.
- Using a measuring cylinder instead of a volumetric flask — not accurate enough for 250.0 cm³.
- Forgetting to mix after making up to the mark.
Things to Be Careful About
The mark scheme wants three distinct points: dissolve, transfer + rinse, top up to mark. Each is a separate mark. The rinsing is part of the transfer mark (M2), so it must be stated. "Top up to the mark" is the exact phrasing that scores M3.
Suggest why solution X is kept in a dark brown glass bottle in step 3 rather than a colourless glass bottle.
Answer
Sunlight decomposes silver nitrate, so the dark brown glass bottle protects the solution from light.
Sunlight decomposes silver nitrate.
Background Concept
Silver nitrate is light-sensitive. In the presence of sunlight (or strong light), it decomposes to metallic silver, nitrogen dioxide and oxygen:
The metallic silver makes the solution appear grey or black, and the concentration of Ag⁺ decreases because some has been converted to Ag(s).
Understanding the Question
The student is asked why solution X (AgNO₃(aq)) is stored in a dark brown glass bottle rather than a colourless one. This is a one-mark recall question.
Approach
The dark glass blocks light, protecting the light-sensitive AgNO₃ from decomposition.
Step-by-Step Reasoning
Sunlight decomposes silver nitrate. The dark brown glass absorbs most of the light, preventing (or greatly slowing) the decomposition, so the concentration of the AgNO₃ solution stays constant during storage.
Key Takeaways
Light-sensitive reagents are stored in dark (amber) bottles to protect them from photochemical decomposition.
Common Mistakes
- Saying "to prevent evaporation" — the bottle is stoppered for that.
- Saying "to keep it cool" — the bottle does not cool the contents.
- Saying "to prevent reaction with air" — not the reason.
Things to Be Careful About
The mark scheme accepts "sunlight decomposes silver nitrate" (or "light decomposes AgNO₃"). The idea of light sensitivity is the key point.
Answer
Filter the sea water.
Filter.
Background Concept
Sea water contains suspended solid material — sand, silt, fragments of organisms. Before a titration, the sample must be free of solids so that the volume measured (10.00 cm³) is exactly the volume of sea water and not partly solid, and so that the end-point is not obscured.
Understanding the Question
Step 4 says "remove any solid material present." The question asks how. One mark.
Approach
Filtration is the standard technique for removing insoluble solids from a liquid.
Step-by-Step Reasoning
Filter the sea water through filter paper in a funnel. The solid is retained on the filter paper and the clear filtrate (the sea water sample) is collected in a clean container.
Key Takeaways
Filtration separates an insoluble solid from a liquid.
Common Mistakes
- "Decanting" — this only removes large particles that settle, not fine suspended solids.
- "Centrifuging" — possible but not the expected answer for this simple step.
- "Distillation" — removes everything, not just solids, and is unnecessary.
Things to Be Careful About
The mark scheme accepts simply "filter". No further detail is needed for the single mark.
Identify the most appropriate piece of equipment that you would use to:
Answer
A 10 cm³ volumetric pipette.
10 cm³ volumetric pipette
Background Concept
A volumetric pipette is calibrated to deliver a single, fixed, very accurate volume — e.g. 10.00 cm³. It has a single graduation mark on the stem and a bulb in the middle. It is the correct instrument for transferring an exact volume of liquid.
Understanding the Question
Step 5 requires transferring exactly 10.00 cm³ of sea water. Which piece of equipment delivers this volume accurately?
Approach
Match the required volume and precision to the instrument. 10.00 cm³ with two decimal places demands a volumetric pipette.
Step-by-Step Reasoning
A 10 cm³ volumetric pipette is designed to deliver exactly 10.00 cm³. A measuring cylinder is only accurate to about ±0.5 cm³, and a burette delivers variable volumes (and would be awkward for a fixed 10.00 cm³). The volumetric pipette is the correct choice.
Key Takeaways
Volumetric pipettes deliver fixed, precisely calibrated volumes and are used for accurate volume transfer.
Common Mistakes
- Measuring cylinder — not accurate enough for "10.00 cm³".
- Burette — used for variable volumes in a titration, not for transferring a fixed sample.
- "10 cm³ pipette" without "volumetric" — the mark scheme wants the volumetric pipette.
Things to Be Careful About
The mark scheme accepts "(10 cm³) (volumetric) pipette". Both "10 cm³" and "volumetric" are expected.
Answer
A dropping pipette.
Dropping pipette
Background Concept
For adding a small, approximate volume (1 cm³) of a reagent, a dropping pipette is appropriate. It delivers liquid drop by drop, and each drop is roughly 0.05 cm³, so 1 cm³ is about 20 drops.
Understanding the Question
Step 6 requires adding 1 cm³ of K₂CrO₄(aq). The volume is specified as "1 cm³", not "1.00 cm³", so high precision is not required.
Approach
Choose the simplest instrument that delivers approximately 1 cm³: a dropping pipette.
Step-by-Step Reasoning
A dropping pipette delivers drops and is ideal for adding about 1 cm³ of indicator solution. A volumetric pipette or burette would be unnecessarily precise (and a 1 cm³ pipette is uncommon). The mark scheme notes the distinction: because the volume is 1 cm³ (not 1.00 cm³), a dropping pipette suffices.
Key Takeaways
Choose apparatus that matches the required precision of the measurement.
Common Mistakes
- 10 cm³ volumetric pipette — wrong volume and over-precise.
- Burette — overkill for adding an indicator.
- Measuring cylinder — too crude for even 1 cm³ and unnecessary.
Things to Be Careful About
The mark scheme explicitly notes the reasoning: "as 1 cm³, not 1.00 cm³ is asked for." The precision of the specification drives the choice of apparatus.
Chromate(VI) solutions are known to be carcinogenic. State what precaution should be taken when using in step 6 other than wearing safety goggles.
Answer
Wear chemically resistant gloves.
Wear chemically resistant gloves.
Background Concept
Potassium chromate(VI), K₂CrO₄, contains chromium in the +6 oxidation state. Chromate(VI) compounds are classified as carcinogenic (cancer-causing). Safe handling requires preventing skin contact and inhalation.
Understanding the Question
The student is asked for a precaution when using K₂CrO₄(aq) in step 6, other than wearing safety goggles. One mark.
Approach
Identify a precaution that specifically protects against the carcinogenic hazard: preventing skin contact.
Step-by-Step Reasoning
Wearing chemically resistant gloves prevents the chromate(VI) solution from coming into contact with the skin, where it could be absorbed. This is the standard additional precaution beyond eye protection.
Key Takeaways
Carcinogenic reagents require skin protection (gloves) and often work in a fume cupboard.
Common Mistakes
- "Wear a lab coat" — this is general lab practice, not specifically protective against the carcinogen.
- "Wash hands afterwards" — good practice but not the specific precaution the mark scheme wants.
- "Work in a fume cupboard" — relevant if the substance is volatile or produces dust, but for a solution, gloves are the expected answer.
Things to Be Careful About
The mark scheme accepts "wear chemically resistant gloves" (or similar). The key is skin protection.
Answer
Solution X.
Solution X
Background Concept
Before filling a burette, it must be rinsed with the solution that will go into it. If it is rinsed with distilled water, a film of water remains on the walls and dilutes the first portion of titrant, making the concentration lower than intended.
Understanding the Question
Step 7 says "rinse a burette in preparation for the titration." What should it be rinsed with? One mark.
Approach
The burette must be rinsed with the titrant — solution X.
Step-by-Step Reasoning
Rinsing with distilled water would leave water droplets on the inner walls, diluting solution X when it is added. Rinsing with solution X itself ensures the burette is coated with the correct concentration of titrant, so the titre is accurate.
Key Takeaways
Burettes (and pipettes) are rinsed with the solution they will contain, not with water.
Common Mistakes
- "Distilled water" — this would dilute the titrant.
- "Deionised water" — same problem.
- "Sea water" — wrong; the burette contains solution X.
Things to Be Careful About
The mark scheme accepts "solution X". The principle is that the rinse liquid must be the same as the solution being measured.
The student obtains the results shown in Table 1.1.
Table 1.1
| rough titration | titration 1 | titration 2 | titration 3 | |
|---|---|---|---|---|
| final volume / | 23.40 | 45.75 | 22.60 | 45.05 |
| initial volume / | 0.00 | 23.40 | 0.00 | 22.60 |
| titre / |
Answer
| rough titration | titration 1 | titration 2 | titration 3 | |
|---|---|---|---|---|
| titre / cm³ | 23.40 | 22.35 | 22.60 | 22.45 |
23.40; 22.35; 22.60; 22.45
Background Concept
In a titration, the titre is the volume of titrant delivered from the burette, calculated as:
Understanding the Question
Table 1.1 has the final and initial burette readings for four titrations (rough, 1, 2, 3). The titre row is empty and must be completed.
Approach
Subtract the initial reading from the final reading for each titration.
Step-by-Step Reasoning
- Rough: 23.40 − 0.00 = 23.40 cm³
- Titration 1: 45.75 − 23.40 = 22.35 cm³
- Titration 2: 22.60 − 0.00 = 22.60 cm³
- Titration 3: 45.05 − 22.60 = 22.45 cm³
Key Takeaways
Titre = final − initial. Always check that the titre is a sensible volume for the reaction.
Common Mistakes
- Subtracting the wrong way (initial − final) giving negative or wrong values.
- Copying the final volume instead of the difference.
Things to Be Careful About
All four values must be recorded to two decimal places, consistent with the burette readings. The mark scheme gives: 23.40; 22.35; 22.60; 22.45.
Working
Concordant titres are 22.35 cm³ and 22.45 cm³ (22.60 cm³ is not concordant).
Answer
22.40 cm³
22.40 cm³
Background Concept
The mean titre is calculated only from concordant titres — those within 0.10 cm³ of each other. The rough titration is never included because it is a quick approximation. If one titre is clearly outside the concordant range, it is discarded as an anomaly.
Understanding the Question
The four titres are 23.40 (rough), 22.35, 22.60, 22.45. Which are concordant, and what is the mean?
Approach
Identify the concordant set, exclude the rough and any outliers, then average the remaining values.
Step-by-Step Reasoning
The rough titre (23.40) is excluded. Of the three accurate titres — 22.35, 22.60, 22.45 — the range is 0.25 cm³. Titration 2 (22.60) is more than 0.10 cm³ from the other two, so it is not concordant. Titrations 1 and 3 (22.35 and 22.45) are within 0.10 cm³ of each other and are concordant.
Key Takeaways
Only concordant titres are averaged; the rough titration is always excluded.
Common Mistakes
- Including the rough titration in the mean.
- Averaging all three accurate titres (22.35, 22.60, 22.45) — this gives 22.47, which is wrong because 22.60 is not concordant.
- Not showing the working.
Things to Be Careful About
The mark scheme requires the working: (22.35 + 22.45) ÷ 2 = 22.40 cm³. The answer must be 22.40, not 22.4 (keep two decimal places to match the data).
Use the mean titre from (h)(ii) to calculate the concentration of chloride ions in the sample of sea water.
Assume the mass of solid silver nitrate used in step 2 was .
Working
Since , moles of Cl⁻ in 10.00 cm³ = mol.
Answer
0.560 mol dm⁻³
0.560 mol dm⁻³
Background Concept
This is a titration stoichiometry calculation. The reaction is:
so Ag⁺ and Cl⁻ react in a 1:1 mole ratio. The concentration of the AgNO₃ solution is found from the mass of solid and the volume of the flask. The amount of Ag⁺ that reacts with Cl⁻ is the amount in the titre volume, found by proportion.
Understanding the Question
Given the mean titre (22.40 cm³) and the mass of AgNO₃ (10.62 g in 250.0 cm³), calculate the concentration of Cl⁻ in the sea water sample (10.00 cm³). Three marks: M1 (moles of AgNO₃), M2 (moles of Ag⁺ reacting with Cl⁻), M3 (concentration of Cl⁻).
Approach
- Find moles of AgNO₃ from mass/Mr.
- Find moles of Ag⁺ in the titre by proportion: total moles × titre/250.
- Since 1:1, this equals moles of Cl⁻ in the 10.00 cm³ sample.
- Convert to concentration in mol dm⁻³.
Step-by-Step Reasoning
Step 1: Calculate the molar mass of AgNO₃:
Step 2: Moles of AgNO₃ in 250.0 cm³:
Step 3: Moles of Ag⁺ in the 22.40 cm³ titre:
Step 4: Since Ag⁺ : Cl⁻ = 1:1, moles of Cl⁻ in 10.00 cm³ = 5.60 × 10⁻³ mol.
Step 5: Concentration of Cl⁻:
Key Takeaways
Titration calculations follow: moles of known → stoichiometric ratio → moles of unknown → concentration. Proportional reasoning connects the titre volume to the total flask volume.
Common Mistakes
- Forgetting to convert cm³ to dm³ when calculating concentration.
- Using the wrong volume (250 instead of 10, or vice versa).
- Forgetting the 1:1 ratio (it happens to be 1:1 here, so it does not change the numbers, but the reasoning must be stated).
- Rounding too early — keep intermediate values to enough significant figures.
Things to Be Careful About
The mark scheme gives M1 = 0.0625..., M2 = 5.60 × 10⁻³, M3 = 0.560 mol dm⁻³. The final answer has three significant figures, consistent with the data (10.62 g has 4 s.f., but 22.40 has 4 s.f. — so 0.560 with 3 s.f. is appropriate; the mark scheme accepts 0.560).
Calculate the percentage error in the titre in titration 2. Show your working.
percentage error = .................... %
Working
Each burette reading has an uncertainty of ±0.05 cm³, and the titre uses two readings.
Answer
0.442%
0.442%
Background Concept
A burette is read to the nearest 0.05 cm³, so each reading has an uncertainty of ±0.05 cm³. A titre involves two readings (final and initial), so the total absolute uncertainty is:
The percentage error is:
Understanding the Question
Calculate the percentage error in the titre of titration 2, which is 22.60 cm³. One mark, working must be shown.
Approach
Apply the formula with the titre of 22.60 cm³ and total uncertainty of 0.10 cm³.
Step-by-Step Reasoning
The 0.10 comes from two burette readings, each ±0.05 cm³.
Key Takeaways
Percentage error quantifies the uncertainty of a measurement relative to its size. For a titre, always double the burette reading uncertainty because two readings are involved.
Common Mistakes
- Using 0.05 instead of 0.10 (forgetting there are two readings).
- Not showing the working — the mark scheme requires it.
- Expressing the answer as a fraction (0.00442) instead of a percentage (0.442%).
Things to Be Careful About
The mark scheme requires working: [(0.05 × 2)/22.60] × 100 = 0.442%. The answer is 0.442% (three significant figures).
Spectroscopic analysis of the sample of sea water accurately determined the concentration of to be lower than that determined by titration with .
Suggest why the student’s method gave a higher value.
Answer
Ag⁺ ions react with other substances in the sample of sea water (e.g. bromide or iodide ions), so more Ag⁺ is consumed than is needed for Cl⁻ alone, giving a higher apparent Cl⁻ concentration.
Ag⁺ ions react with other substances in the sea water, consuming extra Ag⁺.
Background Concept
The titration assumes that every mole of Ag⁺ added reacts with Cl⁻. In reality, sea water contains other anions — notably bromide (Br⁻) and iodide (I⁻) — that also form insoluble silver salts (AgBr, AgI). These consume additional Ag⁺, making the titre larger than it would be if only Cl⁻ were present.
Understanding the Question
Spectroscopic analysis gives a lower Cl⁻ concentration than the titration. Why is the titration value higher? One mark.
Approach
Identify that Ag⁺ reacts with species other than Cl⁻ in the sea water sample.
Step-by-Step Reasoning
When the calculation assumes all the Ag⁺ reacted with Cl⁻, but some Ag⁺ actually reacted with other ions (Br⁻, I⁻, or other precipitating anions), the calculated Cl⁻ concentration is higher than the true value. The titre is too large because extra Ag⁺ is consumed by these other species.
Key Takeaways
A titration gives accurate results only if the titrant reacts exclusively with the analyte. Interfering species cause systematic errors.
Common Mistakes
- Saying "the AgNO₃ was impure" — that would affect the titre differently and is not the expected reason.
- Saying "the sea water was not filtered properly" — the question already filtered it.
- Vague answers like "human error" — the mark scheme wants the specific chemical reason.
Things to Be Careful About
The mark scheme accepts "Ag⁺ ions react with other substances in the sample of sea water." The key idea is that other ions in sea water consume Ag⁺.
A student wants to investigate the rate of the hydrolysis of methyl methanoate, .
The reaction is catalysed by dilute hydrochloric acid, .
The amount of methanoic acid, , produced as the reaction progresses can be monitored by titration with aqueous sodium hydroxide, , of known concentration using thymolphthalein as the indicator.
To determine this, the volume of needed to neutralise the from the catalyst needs to be found beforehand.
The student uses the following procedure.
step 1 Add approximately of iced water to a conical flask, A.
step 2 Add of to a conical flask, B.
Conical flask B is the flask in which the reaction takes place.
step 3 Transfer of from conical flask B to conical flask A. Carry out a single titration of the contents of conical flask A with of known concentration.
step 4 Add of methyl methanoate to conical flask B, swirl the reaction mixture and immediately start a stopwatch.
step 5 After 1 minute transfer of the reaction mixture from conical flask B into conical flask A. Carry out a further single titration of the contents of conical flask A against . Do not empty the contents of conical flask A between titrations.
step 6 After 10 minutes transfer of the reaction mixture from conical flask B into conical flask A. Titrate the contents of conical flask A against .
step 7 Repeat step 6 at intervals of 10 minutes for 1 hour.
State which step is used to determine the concentration of ions from the catalyst in the mixture.
Answer
Step 3
Step 3
Background Concept
In kinetic experiments monitored by titration, the total acid present at any time includes both the catalyst (which is not consumed) and the product acid formed by the reaction. To determine how much product acid has formed, one must first establish the volume of base needed to neutralise the catalyst alone. This is analogous to a 'blank titration' in analytical chemistry.
Understanding the Question
The question asks which step in the described procedure is used to determine the volume of NaOH needed to neutralise only the H⁺ from the HCl catalyst, before any reaction has taken place.
Approach
Look for the step where a sample of the catalyst solution is taken and titrated before methyl methanoate has been added — i.e. before the reaction has started.
Step-by-Step Reasoning
- Step 1: Prepare iced water in flask A — this is the quenching medium, not a measurement.
- Step 2: Add HCl to flask B — this is setting up the reaction vessel.
- Step 3: Transfer 2.00 cm³ of 0.250 mol dm⁻³ HCl from flask B to flask A and titrate. At this point, methyl methanoate has NOT yet been added (that happens in step 4), so the only acid present is the catalyst HCl. This titration gives the volume of NaOH needed to neutralise the catalyst alone.
- Steps 4–7: The reaction is underway; titrations now measure catalyst + product acid.
Therefore, Step 3 is the calibration/blank step.
Key Takeaways
- In reactions catalysed by an acid or base that is not consumed, the catalyst's contribution must be measured separately (a 'blank') before it can be subtracted from total measurements.
- The blank must be taken from the same solution but before the reactant that produces the monitored species is added.
Common Mistakes
- Choosing Step 2 (adding HCl to flask B) — this is preparation, not measurement.
- Choosing Step 4 — this is when the reaction starts, not when the blank is measured.
Things to Be Careful About
- Read the procedure sequentially and identify exactly when methyl methanoate is first added (step 4). Any titration before that point measures only the catalyst.
The iced water in conical flask A is used to significantly reduce the rate of reaction.
Suggest two reasons why the rate of reaction is significantly reduced when the reaction mixture is transferred to conical flask A.
Answer
- The iced water lowers the temperature of the reaction mixture, reducing the kinetic energy of particles and the frequency of successful collisions.
- The iced water dilutes the reaction mixture, decreasing the concentration of reactants and therefore reducing the frequency of collisions.
- Lowers the temperature; 2. Decreases the concentration (by dilution)
Background Concept
The rate of a chemical reaction depends on the frequency of successful collisions between reactant particles. Two key factors that affect this are temperature (which determines the kinetic energy distribution and the proportion of particles exceeding the activation energy) and concentration (which determines how often particles collide). In kinetic experiments where a sample must be removed for analysis without the reaction continuing, both factors are exploited to 'quench' the reaction.
Understanding the Question
The student transfers 2.00 cm³ of the reaction mixture into flask A containing ~150 cm³ of iced water. The question asks for two reasons why this dramatically slows the reaction in flask A, so that the composition at the moment of transfer is effectively 'frozen' for the subsequent titration.
Approach
Identify the two changes that occur when the small volume of reaction mixture enters the large volume of iced water: (1) temperature change, (2) concentration change.
Step-by-Step Reasoning
- Temperature: The iced water is at or near 0 °C, while the reaction in flask B is presumably at room temperature (~20–25 °C). The large volume of cold water (150 cm³ vs 2 cm³) rapidly cools the transferred mixture. Lower temperature means fewer particles have energy ≥ Eₐ, so the rate of successful collisions drops sharply.
- Concentration (dilution): The 2.00 cm³ sample is diluted into ~150 cm³ of water — a dilution factor of about 75. The concentrations of methyl methanoate, water, and HCOOH in the mixture are all drastically reduced. Since rate ∝ concentration (for a given order), the rate falls proportionally.
Both effects work together to make the reaction in flask A effectively stop, so the titration measures the composition at the instant of transfer.
Key Takeaways
- Quenching a reaction sample relies on simultaneously reducing temperature and concentration.
- A large volume of cold diluent relative to the sample volume ensures both effects are significant.
- This technique is common in kinetics experiments where samples are withdrawn at timed intervals.
Common Mistakes
- Writing only one reason (e.g. 'it dilutes the mixture') and missing the temperature effect.
- Saying 'the catalyst is removed' — HCl is still present, just diluted.
- Saying 'the reaction stops completely' — it is significantly slowed, not stopped.
Things to Be Careful About
- The mark scheme requires two distinct factors: temperature AND concentration. Do not give two ways of saying the same thing.
Table 2.1 shows the readings taken by the student.
The titrations in steps 4–7 show the volume of needed to neutralise both the ions from the catalyst, , and from the produced in the reaction.
volume of needed, in , to neutralise from catalyst =
volume of , in , used to neutralise from at time,
volume of , in , used to neutralise from at
Table 2.1
| reading | time, / min | total volume of needed to neutralise total amount of / | / | / |
|---|---|---|---|---|
| 1 | 1 | 12.60 | ||
| 2 | 13 | 17.70 | ||
| 3 | 20 | 19.90 | ||
| 4 | 30 | 22.10 | ||
| 5 | 40 | |||
| 6 | 50 | 24.90 | ||
| 7 | 60 | 25.90 |
The student forgot to take reading 5.
Working
Answer
| reading | time, / min | total volume of NaOH / cm³ | / cm³ | / cm³ |
|---|---|---|---|---|
| 1 | 1 | 12.60 | 1.20 | 13.30 |
| 2 | 13 | 17.70 | 6.30 | 8.20 |
| 3 | 20 | 19.90 | 8.50 | 6.00 |
| 4 | 30 | 22.10 | 10.70 | 3.80 |
| 5 | 40 | |||
| 6 | 50 | 24.90 | 13.50 | 1.00 |
| 7 | 60 | 25.90 | 14.50 | 0.00 |
V_t column: 1.20, 6.30, 8.50, 10.70, blank, 13.50, 14.50; (V∞ - V_t) column: 13.30, 8.20, 6.00, 3.80, blank, 1.00, 0.00
Background Concept
In a kinetic experiment where the product is an acid monitored by titration, the total volume of base used at any time includes both the catalyst (constant) and the product (increasing with time). To isolate the product contribution, the blank (catalyst-only) volume is subtracted. To show the reaction approaching completion, the quantity (V_∞ - V_t) is used, which represents the 'remaining' reactant and decreases exponentially toward zero for a first-order reaction.
Understanding the Question
The table gives total NaOH volumes at various times. The student must compute:
- Column 4: = total volume − 11.40 cm³ (the volume that neutralises the HCOOH produced)
- Column 5: = 14.50 − (where is the value at 60 min, when the reaction is essentially complete)
Approach
- First calculate from the final reading: cm³.
- For each row, subtract 11.40 from the total to get .
- For each row, subtract from 14.50 to get .
Step-by-Step Reasoning
- Reading 1: ;
- Reading 2: ;
- Reading 3: ;
- Reading 4: ;
- Reading 5: blank (not taken)
- Reading 6: ;
- Reading 7: ;
Key Takeaways
- The blank subtraction isolates the product contribution.
- is a measure of remaining reactant and is used to determine reaction order from the shape of the decay curve.
Common Mistakes
- Forgetting to subtract 11.40 and writing the total volume directly as .
- Using the wrong value for (e.g. using 25.90 instead of 14.50).
- Arithmetic errors in subtraction.
Things to Be Careful About
- All values should be given to 2 decimal places to match the precision of the original data.
- The blank row (reading 5) should be left empty, not filled with a guessed value.
Answer
Time
Time
Background Concept
The independent variable is the variable that the experimenter deliberately changes or controls. In a kinetics experiment, time is the independent variable because samples are withdrawn at chosen time intervals.
Understanding the Question
Identify which variable is being systematically varied by the experimenter in this procedure.
Approach
The student transfers samples at 1 min, then at intervals of 10 minutes (10, 20, 30, 40, 50, 60 min). Time is what the experimenter chooses and controls — it is the independent variable.
Step-by-Step Reasoning
- The dependent variable is the volume of NaOH (or , or ), which is measured in response to time.
- The independent variable is time, which is set by the experimenter.
Key Takeaways
- Independent variable = what you change; Dependent variable = what you measure.
- In kinetics, time is almost always the independent variable.
Common Mistakes
- Writing 'concentration of HCOOH' as the independent variable — this is what changes as a result of the reaction (dependent).
- Writing 'volume of NaOH' — this is the dependent variable.
Things to Be Careful About
- Simply writing 'time' is sufficient; no unit needed for identification.
Identify one variable that needs to be controlled, apart from concentrations and volumes of solutions.
Answer
Temperature (of flask B / the reaction mixture)
Temperature (of flask B)
Background Concept
In any experiment investigating the effect of one variable on another, all other variables that could affect the outcome must be kept constant (controlled). For a reaction rate experiment, the most critical controlled variable (apart from concentrations and volumes, which are excluded by the question) is temperature, since rate is exponentially dependent on temperature via the Arrhenius equation.
Understanding the Question
The question asks for one controlled variable, explicitly excluding concentrations and volumes of solutions. This means we need to identify another factor that, if it changed, would alter the rate and invalidate the comparison between time points.
Approach
Consider what could vary during the experiment that would affect the rate in flask B (where the reaction proceeds). Temperature is the obvious answer — if the room temperature fluctuated or if the reaction were exothermic/endothermic causing self-heating/cooling, the rate constant would change.
Step-by-Step Reasoning
- The reaction in flask B proceeds over 60 minutes. If the temperature of flask B changed during this time, the rate constant would change, and the data would not represent a single rate at a single temperature.
- Therefore, temperature must be controlled (e.g. by using a water bath).
Other acceptable answers could include: the volume of iced water in flask A (to ensure consistent quenching), the concentration of NaOH used for titration, or the time between transfer and titration. However, the mark scheme specifically accepts temperature of flask B.
Key Takeaways
- Temperature is the most important controlled variable in kinetics experiments.
- Always consider what could drift or change over the duration of an experiment.
Common Mistakes
- Writing 'concentration of HCl' — the question excludes concentrations.
- Writing 'volume of methyl methanoate' — the question excludes volumes.
- Writing 'the indicator' — this doesn't affect the rate in flask B.
Things to Be Careful About
- The question says 'apart from concentrations and volumes of solutions', so do not give those as answers.
Reading 2 should have been taken at 10 minutes and not at 13 minutes.
State whether this result should have been included or not. Explain your answer.
Answer
Yes, it should be included. The titre value is accurate and corresponds to the actual time at which it was taken (13 min), so it is a valid data point at min.
Yes; the value is accurate and corresponds to the correct time (13 min)
Background Concept
In data analysis, a reading taken at an unexpected time is not automatically invalid. What matters is whether the measurement itself is accurate and whether the time is recorded correctly. An anomalous result (one that does not fit the expected trend) may be excluded, but a correctly measured value at a slightly different time is simply a data point at that time.
Understanding the Question
Reading 2 was supposed to be at 10 minutes but was actually taken at 13 minutes. The question asks whether this result should be included in the analysis.
Approach
Consider: is the measurement itself wrong? No — the titration was performed correctly and gives an accurate volume. Is the time wrong? No — it was recorded as 13 min, which is when it was actually taken. Therefore, it is a perfectly valid data point at min and should be plotted at 13 min on the graph.
Step-by-Step Reasoning
- The volume of NaOH (17.70 cm³) accurately reflects the amount of HCOOH present at the moment the sample was transferred.
- The time (13 min) is correctly recorded.
- There is no error in either the measurement or the timing record.
- The only 'issue' is that it was not taken at the planned interval, but this does not make it invalid.
- Therefore, include it and plot at min.
Key Takeaways
- A data point is valid if both the measured quantity and the time are correctly recorded, even if the time differs from the plan.
- Anomalous results (values inconsistent with the trend) are different from off-schedule but accurate results.
Common Mistakes
- Saying 'No, exclude it' because it was not taken at the planned time — this confuses scheduling error with measurement error.
- Saying 'No, it is anomalous' — it is not anomalous; it simply falls at 13 min rather than 10 min.
Things to Be Careful About
- The answer requires BOTH parts: 'Yes' AND the justification that the value is accurate and corresponds to the correct (recorded) time.
Plot a graph on the grid in Fig. 2.1 to show the relationship between and time.
Use a cross () to plot each data point. Draw a line of best fit.
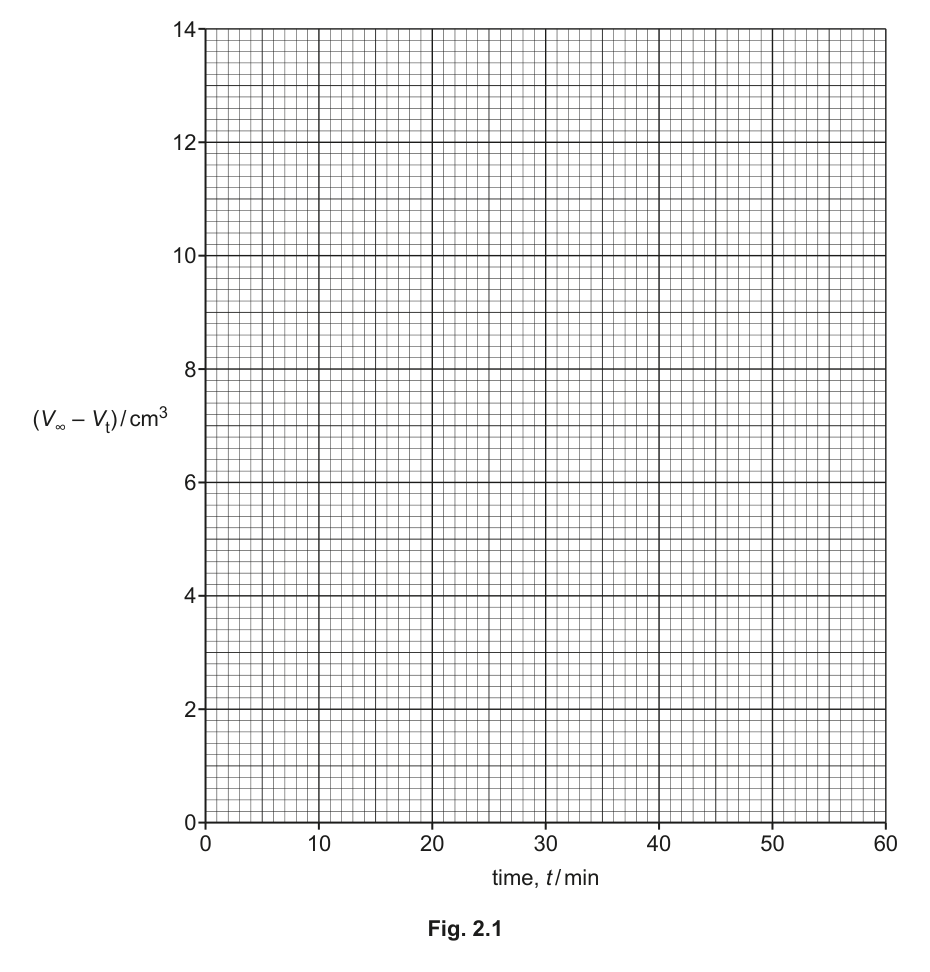
Answer
Plot the following points as crosses (×) on the grid:
Draw a smooth curve of best fit through the points (exponential decay shape, passing as close to all points as possible).
Six points plotted at (1, 13.30), (13, 8.20), (20, 6.00), (30, 3.80), (50, 1.00), (60, 0.00) with a smooth curve of best fit showing exponential decay
Background Concept
For a first-order reaction, the concentration of remaining reactant decreases exponentially with time: . The quantity is proportional to the remaining methyl methanoate concentration, so a plot of against time should give a smooth exponential decay curve approaching zero asymptotically.
Understanding the Question
The student must plot on the y-axis against time on the x-axis using the provided grid (Fig. 2.1), marking each point with a cross and drawing a line of best fit.
Approach
- Read each value from the completed table.
- Locate each point on the grid using the correct x (time) and y (volume) coordinates.
- Draw a smooth curve that passes as close to all points as possible, respecting the expected exponential decay shape.
Step-by-Step Reasoning
- Point 1: — very close to the y-axis, near the top of the graph.
- Point 2: — at 13 min (not 10), value 8.20.
- Point 3: — on the 20 min line, at 6.00.
- Point 4: — on the 30 min line, just below 4.
- Point 5: not plotted (no data).
- Point 6: — on the 50 min line, at 1.00.
- Point 7: — on the 60 min line, at 0.
The curve should be a smooth exponential decay: steep initially, gradually flattening toward zero. It should pass through or very near all six plotted points. The point at (60, 0.00) should be on the x-axis.
Key Takeaways
- Always plot at the actual recorded time, not the intended time.
- A curve of best fit for exponential decay should be smooth and asymptotic to the x-axis.
- Do not use a ruler to connect points (that would be a point-to-point line, not a curve of best fit).
Common Mistakes
- Plotting point 2 at instead of .
- Drawing a straight line instead of a curve.
- Forcing the curve through every point exactly (a best-fit curve may miss some points slightly).
- Not using crosses (×) as specified.
- Omitting the point at (60, 0.00).
Things to Be Careful About
- The mark scheme requires 6 points plotted correctly (M1) and a line of best fit (M2).
- The curve should be smooth, not angular.
- Points should be placed to within half a small square of the correct position.
Reading 5 was not taken. Use the graph to predict the total volume of needed to neutralise the total amount of at 40 minutes.
Working
From the graph, at min cm³
cm³
Total volume of NaOH cm³
Answer
cm³ (accept values in the range 23.5–24.3 cm³ depending on graph reading)
23.90 cm³
Background Concept
When a data point is missing from an experiment, the graph (which shows the trend) can be used to estimate the missing value. The total volume of NaOH at any time equals the catalyst contribution (11.40 cm³) plus the product contribution (). Since , we can work backwards from the graph.
Understanding the Question
Reading 5 (at 40 min) was not taken. Use the curve of best fit from part (c)(v) to find at 40 min, then calculate the total volume of NaOH that would have been needed.
Approach
- Read at min from the graph.
- Calculate .
- Calculate total volume = .
Alternatively: total volume = 25.90 − (value read from graph at 40 min), since 25.90 is the total at 60 min and the graph shows how much less the total decreases.
Step-by-Step Reasoning
- From the graph at min, cm³ (this value depends on the student's curve; the mark scheme allows a range).
- Method 1: cm³; Total = cm³.
- Method 2 (equivalent): Total = cm³.
- Both methods give the same answer because .
Key Takeaways
- A graph can fill in missing data points by interpolation.
- The relationship between total volume, catalyst volume, and product volume must be understood to convert between them.
Common Mistakes
- Reading the value from the graph incorrectly (e.g. reading instead of ).
- Forgetting to add back the 11.40 cm³ catalyst contribution.
- Reporting the graph value directly as the total volume.
Things to Be Careful About
- The answer depends on the student's graph, so a range of values is acceptable (approximately 23.5–24.3 cm³).
- The mark scheme specifically states: '25.90 − (V∞ − V) at 40 minutes from the graph', confirming the method.
It is not possible to repeat the experiment.
State whether the data from the experiment is reliable. Justify your answer.
Answer
No, the data is not reliable. There is an anomalous point on the graph (the point at min lies above the curve of best fit), indicating inconsistency in the results.
No; there is an anomalous point on the graph
Background Concept
Reliability refers to the consistency of repeated measurements. In a single-run experiment (which cannot be repeated), reliability is assessed by examining how closely the data points follow a smooth trend. If points scatter widely or one point deviates significantly from the expected curve, the data may be considered unreliable. Conversely, if all points lie on or very close to the best-fit line, the data can be considered reliable even from a single run.
Understanding the Question
The experiment cannot be repeated, so the student must judge reliability from the single set of data by examining the graph. The question requires a yes/no answer WITH justification.
Approach
Look at the scatter of points relative to the curve of best fit. Consider whether any point is clearly off the trend (anomalous).
Step-by-Step Reasoning
- The point at lies noticeably above the smooth exponential decay curve that fits the other points well. This suggests either a timing error, a transfer error, or random variation.
- The point at being exactly zero is also suspicious for a first-order reaction (which approaches zero asymptotically but never quite reaches it in finite time), though this could be within experimental precision.
- Because there is at least one point that does not fit the smooth trend, the data can be judged unreliable.
Alternative acceptable answer: Yes, the data is reliable because all points lie on or close to the line of best fit. This would be valid if the student's curve passes through or very near all points.
The mark scheme accepts either answer provided the justification is consistent with the student's own graph.
Key Takeaways
- Reliability from a single run is judged by the scatter of points around the best-fit line.
- An anomalous point (one that deviates significantly from the trend) undermines reliability.
- The justification must match the answer given (if you say 'yes', you must point to good agreement; if 'no', you must identify the anomaly).
Common Mistakes
- Saying 'No, because there is only one set of readings' — the question acknowledges it cannot be repeated, so this is not a valid criticism of the data itself.
- Saying 'No, because reading 5 is missing' — a missing point affects completeness, not reliability of the points that were taken.
- Giving only 'Yes' or 'No' without justification.
Things to Be Careful About
- The mark scheme requires BOTH the judgement (yes/no) AND the justification. A bare 'No' scores zero.
- The justification must reference the graph (anomalous point / points on the line of best fit), not the experimental procedure.