Chemistry 9701/53 — October/November 2023
Cambridge A-Level · Planning, Analysis and Evaluation · worked solutions for every part, with the mark scheme
Topics Analysis, Conclusions and Evaluation · Planning
The concentration of dissolved oxygen in a sample of water can be measured using the following method.
Manganese(II) hydroxide, , is oxidised by the oxygen dissolved in a sample of water to form manganese(III) hydroxide, .
The manganese(III) hydroxide then reacts with iodide ions to produce aqueous iodine.
The amount of iodine produced is proportional to the amount of dissolved oxygen.
of the solution containing aqueous iodine is transferred into a conical flask and titrated against sodium thiosulfate, .
Complete Table 1.1 and determine the mean titre to be used in calculating the concentration of dissolved oxygen.
Table 1.1
| trial run | run 1 | run 2 | run 3 | |
|---|---|---|---|---|
| final burette reading / | 27.30 | 28.10 | 28.25 | 26.95 |
| initial burette reading / | 0.00 | 1.10 | 1.55 | 0.15 |
| titre / |
mean titre = ..............................
Calculate the concentration of dissolved oxygen in the of solution. Show your working.
concentration of dissolved oxygen in of solution = ..............................
Suggest a suitable piece of apparatus for the transfer of of the solution containing aqueous iodine.
Water samples are collected in full sealed flasks.
Explain why the sealed flask must be completely full.
The concentration of oxygen in water at different temperatures is shown in Table 1.2. The concentration value is missing for .
Table 1.2
| temperature / | concentration of oxygen / |
|---|---|
| 0 | 4.58 |
| 5 | 3.97 |
| 10 | 3.20 |
| 15 | 3.13 |
| 20 | 2.82 |
| 25 | |
| 30 | 2.33 |
| 35 | 2.15 |
| 40 | 2.05 |
Plot a graph of concentration of oxygen (-axis) against temperature (-axis) on the grid. Use a cross () to plot each data point. Draw a smooth curve of best fit.
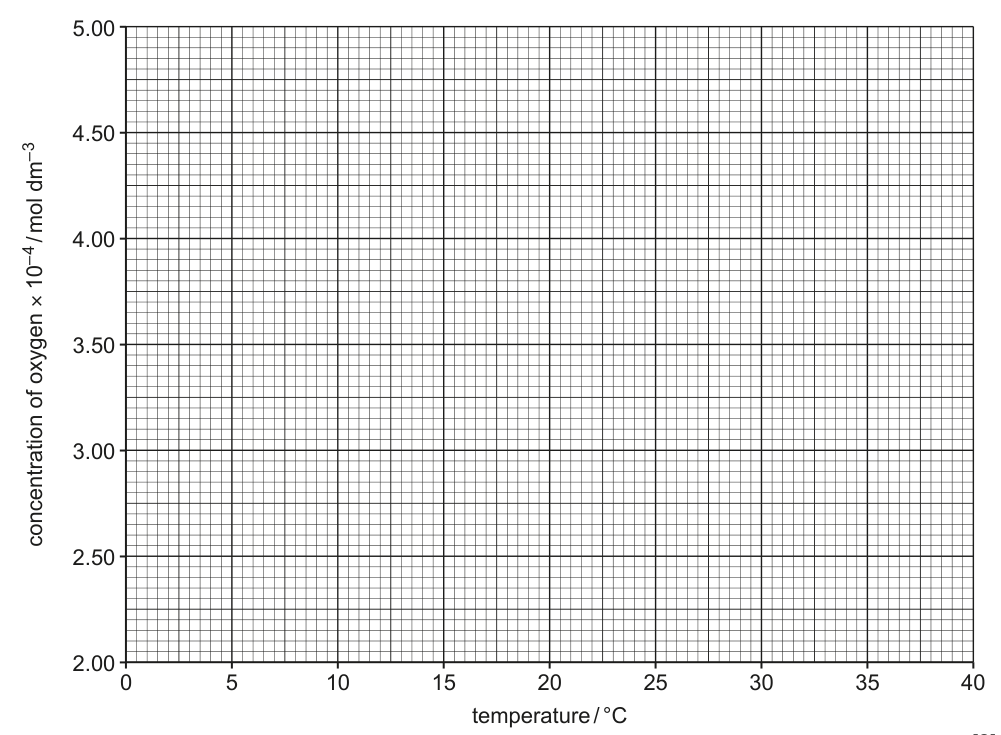
Use the graph to deduce the concentration of oxygen at .
concentration of oxygen at = ..............................
Circle the most anomalous point on the graph.
Suggest an explanation for this anomaly. Assume that there was no error in measuring oxygen concentration.
The rest of this paper
1 more questions- Q2Planning · Analysis, Conclusions and Evaluation18M