Chemistry 9701/52 — October/November 2023
Cambridge A-Level · Planning, Analysis and Evaluation · worked solutions for every part, with the mark scheme
Topics Analysis, Conclusions and Evaluation · Planning
Thermometric titrations can be used to determine the standard enthalpy change of neutralisation.
The maximum temperature reached in a thermometric titration occurs at the point of neutralisation between an acid and an alkali.
A diagram of the apparatus used is shown in Fig. 1.1.
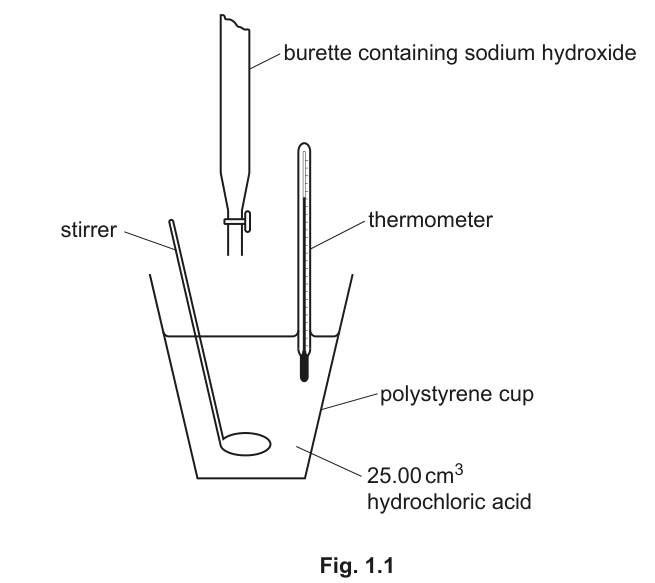
A student uses the following method.
Step 1 Transfer of dilute hydrochloric acid, , to a polystyrene cup.
Step 2 Place a thermometer with divisions into the in the polystyrene cup and leave it for 3 minutes. Record the temperature.
Step 3 Add aqueous sodium hydroxide, , from a burette. Stir and record the temperature of the solution in the polystyrene cup.
Step 4 Immediately add another of . Stir and record the temperature of the solution in the polystyrene cup.
Step 5 Repeat Step 4 until there is no further increase in temperature. Once the temperature starts to decrease, repeat Step 4 three more times.
The student obtains the results shown in Table 1.1.
Table 1.1
| volume of added / | temperature / |
|---|---|
| 0.00 | 18.8 |
| 5.00 | 21.3 |
| 10.00 | 23.8 |
| 15.00 | 26.4 |
| 20.00 | 27.4 |
| 25.00 | 26.2 |
| 30.00 | 25.1 |
| 35.00 | 24.0 |
| 40.00 | 23.2 |
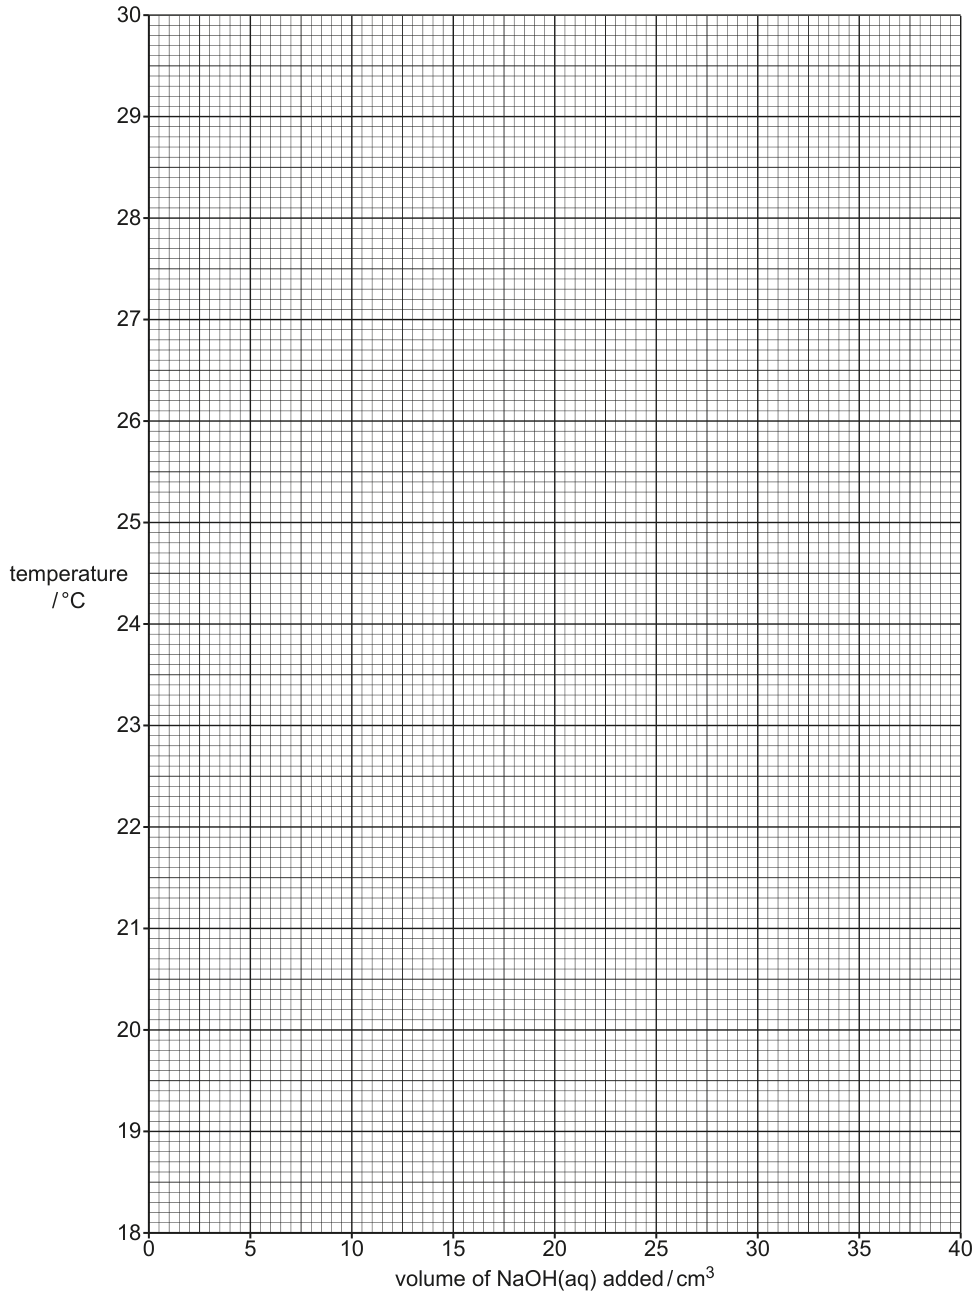
Plot a graph of temperature (-axis) against volume of added (-axis) on the grid. Use a cross () to plot each data point.
Draw two straight lines of best fit. One for the rise in temperature and one for the fall in temperature. Extrapolate the two lines so they intersect.
Answer
- Plot all 9 data points correctly using crosses ().
- Draw a straight line of best fit through the rising temperature points (0.00 to 20.00 cm).
- Draw a straight line of best fit through the falling temperature points (25.00 to 40.00 cm).
- Extrapolate both lines so they intersect at the point of maximum temperature.
See diagram
Background Concept
In a thermometric titration, the temperature of the solution changes as the reaction proceeds. Before the equivalence point, adding the titrant causes an exothermic reaction, raising the temperature. After the equivalence point, adding excess titrant cools the mixture down. By plotting temperature against volume and drawing two lines of best fit (one for the rising section, one for the falling section), their intersection gives the theoretical maximum temperature and the exact volume of titrant required for neutralisation, correcting for heat losses that occur during the experiment.
Understanding the Question
The question asks you to plot the provided temperature-volume data on a graph and draw two straight lines of best fit that intersect. This intersection point represents the equivalence point of the titration.
Approach
Plot each data point from Table 1.1 accurately. Identify the points where temperature is increasing (before neutralisation) and where it is decreasing (after neutralisation). Draw a line of best fit through each set, then extend (extrapolate) them until they cross.
Step-by-Step Reasoning
- Plot the nine points: (0.00, 18.8), (5.00, 21.3), (10.00, 23.8), (15.00, 26.4), (20.00, 27.4), (25.00, 26.2), (30.00, 25.1), (35.00, 24.0), (40.00, 23.2).
- Draw a straight line of best fit through the first five points (0.00 to 20.00 cm), which show a temperature rise.
- Draw a second straight line of best fit through the last four points (25.00 to 40.00 cm), which show a temperature fall.
- Extend both lines beyond the data points so they intersect. The intersection gives the corrected maximum temperature and volume.
Key Takeaways
Graphical methods in practical chemistry allow you to correct for systematic errors like heat loss by extrapolating to the theoretical equivalence point.
Common Mistakes
- Connecting all points with a single smooth curve instead of using two distinct straight lines of best fit.
- Forgetting to extrapolate the lines so they actually intersect outside the plotted data range.
- Plotting points incorrectly or using dots instead of the specified crosses ().
Things to Be Careful About
- Ensure the axes are correctly labelled with quantities and units.
- Use the correct symbol (cross) for data points as specified.
- Lines of best fit should have roughly equal numbers of points on either side; do not force the line through every point.
Use your graph to determine the maximum temperature change of the mixture. Assume the initial temperature of is .
maximum temperature change of the mixture = ..............................
Working
Intersection temperature (from graph) = 27.8 C
Initial temperature = 18.8 C
maximum temperature change = 27.8 - 18.8 = 9.0 C
Answer
9.0
9.0
Background Concept
The maximum temperature change () is the difference between the theoretical maximum temperature at the equivalence point and the initial temperature of the reactants. In thermometric titrations, this value is read from the intersection of the extrapolated lines of best fit, not from the highest recorded data point, because heat is lost to the surroundings during the experiment.
Understanding the Question
You must use the graph from part (a)(i) to find the maximum temperature change, assuming the initial temperature of the NaOH(aq) is 18.8 C (same as the HCl(aq)).
Approach
Read the y-coordinate (temperature) of the intersection point from your graph. Subtract the initial temperature (18.8 C) from this value.
Step-by-Step Reasoning
- From the graph in part (a)(i), the intersection of the two lines of best fit occurs at a temperature of approximately 27.8 C.
- The initial temperature is given as 18.8 C.
- Maximum temperature change = 27.8 - 18.8 = 9.0 C.
Key Takeaways
Always use the extrapolated intersection point for in thermometric titrations to account for heat loss.
Common Mistakes
- Using the highest recorded temperature (27.4 C at 20.00 cm) instead of the extrapolated maximum (27.8 C).
- Forgetting to subtract the initial temperature to find the change.
Things to Be Careful About
- Read the graph to the nearest 0.1 C.
- Ensure you are reading the y-axis (temperature), not the x-axis (volume).
Use your graph to determine the volume of needed to neutralise of .
volume of = ..............................
Answer
volume of NaOH(aq) = 21.0 cm
21.0
Background Concept
The volume of titrant required to reach the equivalence point is found at the x-coordinate of the intersection of the two lines of best fit on the temperature-volume graph.
Understanding the Question
Determine the volume of NaOH(aq) needed to neutralise the HCl(aq) by reading the x-value at the intersection point from your graph.
Approach
Read the x-coordinate (volume) of the intersection point from the graph in part (a)(i).
Step-by-Step Reasoning
- From the graph, the intersection occurs at a volume of approximately 21.0 cm.
Key Takeaways
The intersection point gives both the maximum temperature and the exact volume of titrant needed for neutralisation.
Common Mistakes
- Reading the wrong axis (reading temperature instead of volume).
- Reading the value from the data table instead of the extrapolated graph.
Things to Be Careful About
- Read to the nearest 0.5 cm or 1.0 cm depending on the grid scale.
Use your answer to (iii) to calculate the concentration of in .
concentration of = ..............................
Working
Moles of HCl = mol
From the equation:
Moles of NaOH = Moles of HCl = 0.0250 mol
Volume of NaOH (from part (a)(iii)) = 21.0 cm
Concentration of NaOH = mol dm
Answer
1.19
1.19
Background Concept
In a neutralisation reaction between a strong acid and a strong base, the stoichiometry is 1:1. The concentration of an unknown solution can be found using the formula , where is the number of moles and is the volume in dm.
Understanding the Question
Calculate the concentration of NaOH(aq) using the volume determined in part (a)(iii) and the known concentration and volume of HCl(aq).
Approach
- Calculate moles of HCl.
- Use the 1:1 mole ratio to find moles of NaOH.
- Convert the volume of NaOH from cm to dm.
- Calculate concentration.
Step-by-Step Reasoning
- mol.
- From the balanced equation, mol.
- Volume of NaOH = 21.0 cm = 0.0210 dm.
- mol dm.
Key Takeaways
Always convert volumes to dm when calculating concentration in mol dm.
Common Mistakes
- Forgetting to divide the volume by 1000.
- Using the wrong volume (e.g., total volume added instead of volume at equivalence point).
- Not using the correct number of significant figures (3 s.f. is appropriate here).
Things to Be Careful About
- Ensure the volume used is the one from part (a)(iii), not a value from the table.
- Carry out calculations to at least 3 significant figures.
Suggest why a titration using an indicator is more accurate than a thermometric titration.
Answer
An indicator changes colour rapidly (instantly) at the end-point, allowing for a more precise determination of the volume of titrant added compared to the slower, less distinct temperature change in a thermometric titration.
See answer
Background Concept
In a standard acid-base titration, an indicator changes colour very rapidly over a narrow pH range, providing a sharp, easily detectable end-point. In a thermometric titration, the temperature change is gradual and heat loss to the surroundings means the maximum temperature is not immediately obvious, requiring extrapolation.
Understanding the Question
Explain why an indicator-based titration is more accurate than a thermometric titration.
Approach
Compare the sharpness and immediacy of the end-point detection in both methods.
Step-by-Step Reasoning
- An indicator changes colour almost instantaneously at the equivalence point.
- This allows the titration to be stopped immediately, giving a more precise volume reading.
- In a thermometric titration, the temperature change is gradual, and heat loss means the true maximum is not directly observed, reducing accuracy.
Key Takeaways
Visual end-points with indicators are generally sharper and more precise than thermal end-points.
Common Mistakes
- Saying "indicators are more accurate" without explaining why (e.g., rapid colour change).
- Mentioning heat loss as the reason for indicator accuracy (heat loss affects thermometric, not indicator titrations).
Things to Be Careful About
- Focus on the speed and sharpness of the end-point detection.
- Use precise terminology: "changes colour rapidly" or "instantly".
Suggest a suitable piece of apparatus for the transfer of of in Step 1.
Answer
(25 cm) volumetric pipette
volumetric pipette
Background Concept
A volumetric pipette is used to measure a precise, fixed volume of liquid (e.g., 25.00 cm) with high accuracy. It is more accurate than a measuring cylinder or a burette for transferring a single fixed volume.
Understanding the Question
Identify the apparatus used to transfer exactly 25.00 cm of HCl(aq) in Step 1.
Approach
Recall the apparatus used for precise volume transfer.
Step-by-Step Reasoning
The volume is 25.00 cm, which requires high precision. A volumetric pipette is the correct apparatus for this task.
Key Takeaways
Volumetric pipettes are used for precise, fixed-volume transfers.
Common Mistakes
- Suggesting a measuring cylinder (not precise enough).
- Suggesting a burette (used for variable volumes, not fixed transfers).
- Forgetting to specify the size (25 cm).
Things to Be Careful About
- Include the size if possible, though "volumetric pipette" is often accepted.
Determine the percentage error of the measured temperature increase when the first of is added.
Show your working.
percentage error = ..............................
Working
Temperature increase = 21.3 - 18.8 = 2.5 C
Uncertainty in temperature reading = C
Uncertainty in temperature change = C
Percentage error =
Answer
8.0%
8.0%
Background Concept
When calculating a difference between two measurements (like a temperature change), the absolute uncertainties add together. If a thermometer has an uncertainty of C, the uncertainty in is C. Percentage error is calculated as .
Understanding the Question
Calculate the percentage error in the temperature increase when the first 5.00 cm of NaOH is added.
Approach
- Calculate the temperature increase.
- Determine the absolute uncertainty in the temperature change.
- Calculate the percentage error.
Step-by-Step Reasoning
- Temperature increase = 21.3 - 18.8 = 2.5 C.
- The thermometer has 0.2 C divisions, so the uncertainty in each reading is C.
- Uncertainty in = C.
- Percentage error = .
Key Takeaways
Uncertainties in differences add together. Always consider how measurement precision affects calculated values.
Common Mistakes
- Using only C for the uncertainty in (forgetting that two readings are involved).
- Calculating percentage error using the wrong uncertainty value.
Things to Be Careful About
- The thermometer has 0.2 C divisions, so the uncertainty is half of that: C.
- Ensure the percentage error is expressed correctly.
The standard enthalpy change of neutralisation, , is defined as the enthalpy change when one mole of forms from and .
In another experiment a student finds that of of increases the temperature by when added to of of .
The equation for the reaction between and is shown.
Use the formula to determine the standard enthalpy change of neutralisation, , in .
Assume the mass of of solution is .
Working
Total volume of solution = 25.00 + 22.10 = 47.10 cm
Mass of solution, = 47.10 g
C
J g C
J = 1.181268 kJ
Moles of NaOH = mol
Moles of HO formed = 0.02210 mol
kJ mol
Answer
-53.5
-53.5
Background Concept
The enthalpy change of a reaction can be calculated using , where is the heat energy, is the mass of the solution, is the specific heat capacity (usually 4.18 J g C for aqueous solutions), and is the temperature change. The molar enthalpy change is then , where is the number of moles of the limiting reactant (or product formed). The negative sign indicates an exothermic reaction.
Understanding the Question
Calculate the standard enthalpy change of neutralisation using the provided data.
Approach
- Calculate the total mass of the solution.
- Calculate the heat energy released ().
- Calculate the moles of water formed.
- Calculate the molar enthalpy change.
Step-by-Step Reasoning
- Total volume = 25.00 + 22.10 = 47.10 cm. Mass = 47.10 g (assuming density = 1.00 g cm).
- J = 1.181268 kJ.
- Moles of NaOH = mol. Since HCl is in excess (25.00 cm of 1.00 M), NaOH is limiting, and 0.02210 mol of HO is formed.
- kJ mol.
Key Takeaways
Always include the negative sign for exothermic reactions. Ensure units are consistent (J to kJ, cm to dm).
Common Mistakes
- Forgetting to add the volumes to get the total mass.
- Forgetting to convert J to kJ.
- Not including the negative sign.
- Using the wrong number of moles (e.g., moles of HCl instead of NaOH).
Things to Be Careful About
- The formula is , not .
- Use 4.18 J g C for unless stated otherwise.
The theoretical value for the standard enthalpy change of neutralisation in the reaction between and is .
Give one reason why the value you obtained in (d) differs from the theoretical value.
If you were unable to obtain an answer to (d), use . This is not the correct answer.
Answer
Heat loss to the surroundings (or the polystyrene cup, or the thermometer).
Heat loss to surroundings
Background Concept
In calorimetry experiments, heat is inevitably lost to the surroundings (the air, the container, the thermometer, the stirrer). This means the measured temperature change is smaller than the theoretical value, leading to a less exothermic (less negative) enthalpy change.
Understanding the Question
Explain why the experimental value (-53.5 kJ mol) differs from the theoretical value (-57.6 kJ mol).
Approach
Identify the most common source of error in simple calorimetry experiments.
Step-by-Step Reasoning
The experimental value is less exothermic than the theoretical value. This is because some of the heat released by the reaction is lost to the surroundings rather than being absorbed by the solution. This results in a smaller measured and thus a smaller calculated .
Key Takeaways
Heat loss is the primary source of error in simple calorimetry.
Common Mistakes
- Saying "human error" or "not accurate enough" (too vague).
- Saying heat was gained from the surroundings (this would make the value more exothermic, not less).
Things to Be Careful About
- Be specific: "heat loss to the surroundings" is a creditable answer.
- Avoid vague terms like "errors".
Suggest why the standard enthalpy change of neutralisation determined using ethanoic acid is less exothermic than the standard enthalpy change using hydrochloric acid.
Answer
- Ethanoic acid is a weak acid and is only partially dissociated.
- Energy is required (endothermic) to dissociate the ethanoic acid molecules before neutralisation can occur.
- This energy requirement reduces the overall exothermic enthalpy change.
See answer
Background Concept
The standard enthalpy change of neutralisation for a strong acid and strong base is approximately -57.6 kJ mol. This is the enthalpy change for the reaction: . For a weak acid, the acid is not fully dissociated in solution. Before the neutralisation reaction can occur, energy must be absorbed to dissociate the weak acid molecules: . This endothermic process reduces the overall exothermic enthalpy change.
Understanding the Question
Explain why the enthalpy change of neutralisation using ethanoic acid is less exothermic (less negative) than with hydrochloric acid.
Approach
- State that ethanoic acid is a weak acid.
- Explain that energy is required for its dissociation.
- Conclude that this reduces the overall heat released.
Step-by-Step Reasoning
- Ethanoic acid () is a weak acid, meaning it exists mostly as intact molecules in solution, not as and ions.
- During neutralisation, the ethanoic acid molecules must first dissociate to provide ions. This dissociation process is endothermic (requires energy).
- The energy absorbed to dissociate the acid partially cancels out the energy released by the formation of water, resulting in a less exothermic overall enthalpy change.
Key Takeaways
Weak acid neutralisation is less exothermic than strong acid neutralisation due to the endothermic dissociation of the weak acid.
Common Mistakes
- Saying "weak acids don't react as much" (they do react completely with a strong base, but the energy profile is different).
- Not mentioning that dissociation requires energy.
- Forgetting to state that ethanoic acid is a weak acid.
Things to Be Careful About
- Use precise terminology: "partially dissociated", "endothermic dissociation".
- Ensure you explain why the value is less exothermic (energy required for dissociation).
The rest of this paper
1 more questions- Q2Planning · Analysis, Conclusions and Evaluation16M