Chemistry 9701/52 — February/March 2019
Cambridge A-Level · Planning, Analysis and Evaluation · worked solutions for every part, with the mark scheme
Topics Planning · Analysis, Conclusions and Evaluation
The reaction between hydrogen peroxide, , and iodide ions, , takes place in acidic conditions.
The rate of this reaction can be found by measuring the time taken for a given amount of iodine, , to form.
This is done by adding a known amount of thiosulfate ions, , and allowing the formed in reaction 1 to react with the .
After the ions have all reacted in reaction 2, any further formed in reaction 1 can be detected using an indicator.
A student carried out a series of experiments to determine the order of reaction with respect to the concentration of ions in reaction 1.
The student prepared the following solutions.
- solution A:
- solution B:
The student also had access to the following chemicals.
- solution C:
- distilled water
- a suitable indicator
The student prepared solution A in a volumetric flask.
The student used a balance accurate to two decimal places and a weighing boat. A weighing boat is a small container used to hold solid samples when they are weighed.
Determine the mass, in g, of needed to prepare of solution A.
[: K, 39.1; I, 126.9]
The student weighed the empty weighing boat. The student then added solid to the weighing boat until the mass of calculated in (i) was reached. The student transferred all of the from the weighing boat into a beaker.
Describe how the student could check that the mass of transferred into the beaker was exactly the same as the mass calculated in (i).
The student dissolved the in the beaker in distilled water and transferred the solution formed into a volumetric flask. Distilled water was added to the volumetric flask until the volume of the solution was exactly . Care was taken to avoid parallax errors.
Describe:
- how the student should transfer all the solution from the beaker into the volumetric flask
- how the student should fill the volumetric flask exactly up to the mark.
The student rinsed a burette with solution A before filling it with solution A.
Explain why this improves the accuracy of the results.
The student was given a solution of .
Determine the volume, in , of this solution that should be added to a volumetric flask to prepare of solution B. Give your answer to two decimal places.
Experiment 1 was carried out using a series of steps.
- step 1: The student used a measuring cylinder to measure of . This was transferred to a conical flask.
- step 2: The student added of distilled water from a burette to the conical flask.
- step 3: The student added of solution A from a burette to the conical flask.
- step 4: The student added of solution B from a burette to the conical flask.
- step 5: The student added of indicator from a teat pipette to the conical flask.
- step 6: The student used a burette to add of solution C to a small beaker. The contents of the beaker were added to the conical flask and a stopclock was started immediately. The stopclock was stopped when the formed caused the indicator to change colour.
In Experiments 2–6 the student repeated steps 1–6 but using the volumes of distilled water and solution A given in the table.
The student carried out two trials of each experiment.
| experiment | volume of / | volume of distilled water / | volume of solution A, / | volume of solution B / | volume of indicator / | trial 1 time / s | trial 2 time / s |
|---|---|---|---|---|---|---|---|
| 1 | 25.0 | 20.00 | 5.00 | 5.00 | 1.0 | 218 | 220 |
| 2 | 25.0 | 15.00 | 10.00 | 5.00 | 1.0 | 112 | 113 |
| 3 | 25.0 | 12.50 | 12.50 | 5.00 | 1.0 | 100 | |
| 4 | 25.0 | 10.00 | 15.00 | 5.00 | 1.0 | 77 | 76 |
| 5 | 25.0 | 5.00 | 20.00 | 5.00 | 1.0 | 59 | 59 |
| 6 | 25.0 | 0.00 | 25.00 | 5.00 | 1.0 | 47 | 49 |
In Experiment 3, trial 2, the indicator changed colour as soon as the student added solution C to the conical flask. No results were recorded for Experiment 3, trial 2.
Suggest which step the student did not carry out in Experiment 3, trial 2.
Suggest why the results shown in the table could be considered reliable.
What was the percentage error in the burette reading for measuring the volume of solution A in Experiment 5?
Suggest why a measuring cylinder was used to measure the volume of rather than a more accurate piece of apparatus, such as a burette.
For Experiments 1–6, state:
- the independent variable
- the dependent variable.
The rate equation can be written as where is proportional to the volume of solution A and is the order of reaction with respect to .
Use only the results of Experiments 1–6 given in (d) to complete the table where:
- is the volume of solution A used in
- is the average time taken in trial 1 and trial 2 in s.
Give all values to three significant figures.
| experiment | / | / s | / | ||
|---|---|---|---|---|---|
| 1 | 5.00 | ||||
| 2 | 10.00 | ||||
| 3 | 12.50 | 100 | 0.0100 | ||
| 4 | 15.00 | ||||
| 5 | 20.00 | ||||
| 6 | 25.00 |
Rate can be expressed as .
The rate equation can be expressed as shown.
where:
- is a constant
- is proportional to .
On the grid:
- Plot a graph of against . Use a cross () to plot each data point.
- Draw a line of best fit.
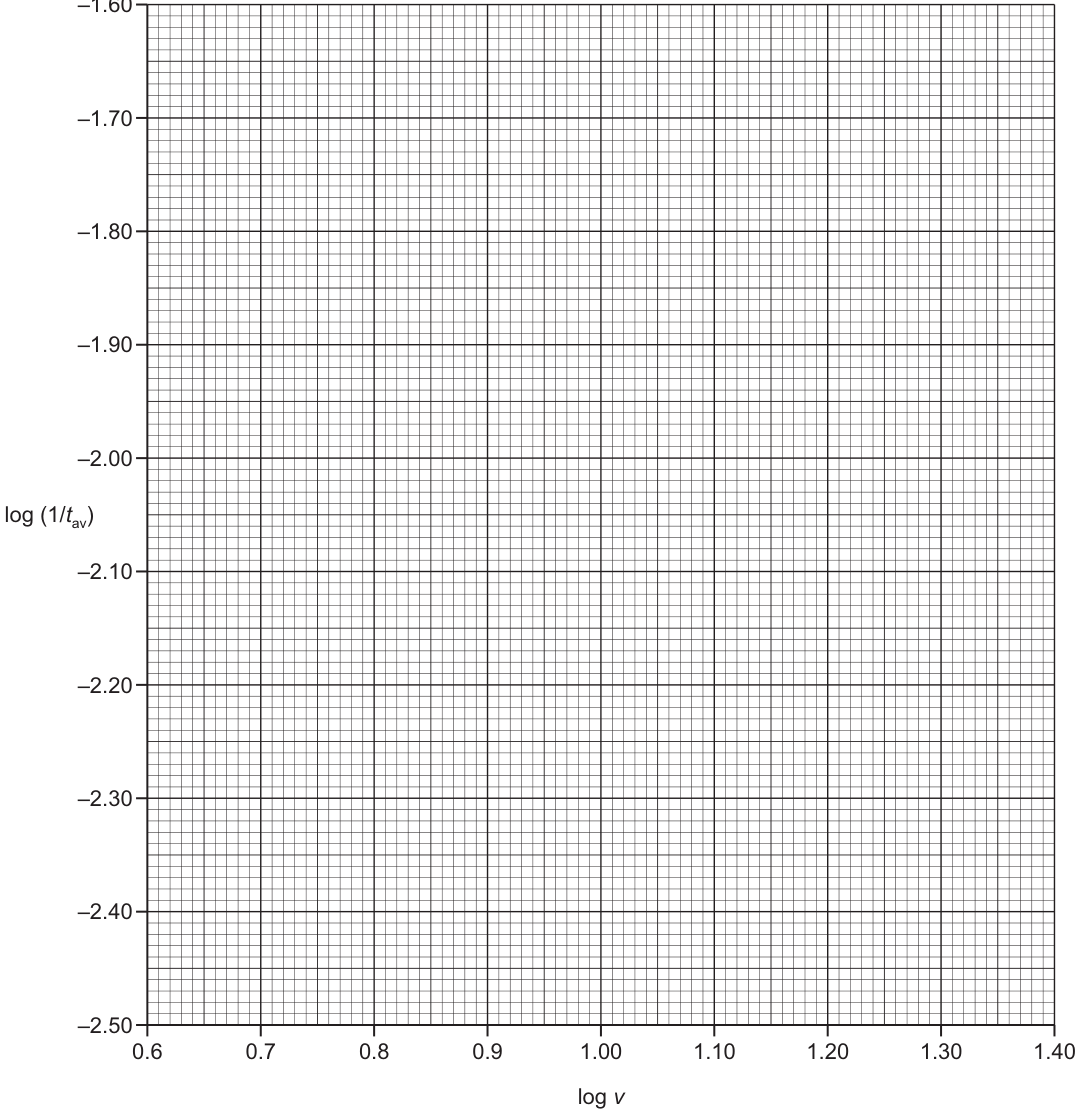
Use your graph to determine the gradient of the line of best fit. State the coordinates of both points you used in your calculation. Give the gradient to three significant figures.
Determine the order of reaction with respect to .
co-ordinates 1: .............................................
co-ordinates 2: .............................................
The rest of this paper
1 more questions- Q2Analysis, Conclusions and Evaluation · Planning10M