Chemistry 9701/52 — February/March 2017
Cambridge A-Level · Planning, Analysis and Evaluation · worked solutions for every part, with the mark scheme
Topics Analysis, Conclusions and Evaluation · Planning
The enthalpy change of reaction, , for the decomposition of sodium hydrogencarbonate, , cannot be measured directly.
A student must carry out two separate experiments and use the results of these experiments to determine the enthalpy change of reaction for the decomposition of sodium hydrogencarbonate.
Suggest why the enthalpy change of reaction, , for the decomposition of sodium hydrogencarbonate cannot be measured directly.
In both experiments the student used a weighing boat. A weighing boat is a small vessel used to contain solid samples when they are weighed.
Experiment 1 Reaction between sodium carbonate, , and dilute hydrochloric acid,
step 1 The student added approximately of to a weighing boat and accurately measured the combined mass of the weighing boat and . This mass was recorded in Table 1.1.
step 2 The student used a measuring cylinder to measure of .
step 3 The experiment was carried out and the results were recorded in Table 1.2.
step 4 The student reweighed the empty weighing boat and recorded the mass in Table 1.1.
Table 1.1 mass results from Experiment 1
| mass of weighing boat and / g | 4.15 |
| mass of empty weighing boat after addition of to / g | 0.97 |
| mass of added / g |
Table 1.2 temperature results from Experiment 1
| time / minutes | 0 | 1 | 2 | 3 | 5 | 6 | 7 | 8 | 9 | 10 | |
|---|---|---|---|---|---|---|---|---|---|---|---|
| temperature of mixture / °C | 20.0 | 19.8 | 19.8 | 19.8 | 24.6 | 24.7 | 24.5 | 24.3 | 24.1 | 23.9 |
Outline how the student carried out step 3 of the experiment.
You may find it helpful to write your answer as a series of smaller steps.
Draw a labelled diagram of the apparatus.
The student plotted a graph of the results and drew two lines of best fit which were both extrapolated as shown.
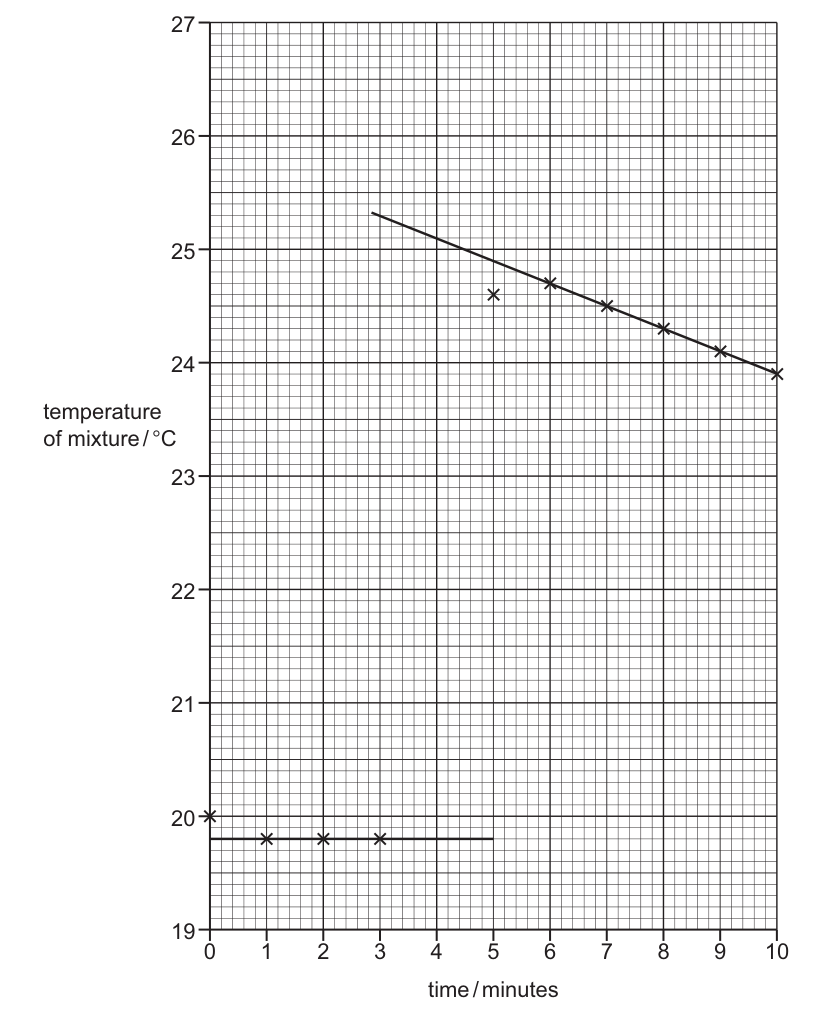
Use the graph to determine the theoretical temperature increase at 4 minutes.
theoretical temperature increase = .............................. °C
Use Table 1.1 on page 2 to determine the mass of which was added to the .
Use this value and your answer to (c) to determine the enthalpy change, , for the reaction shown.
Give your answer to three significant figures.
[Assume that the specific heat capacity of the solution is .]
[: Na, 23.0; C, 12.0; O, 16.0]
Explain why the student did not add the to the at 0 minutes.
Suggest why the temperature measured at 5 minutes was lower than the temperature measured at 6 minutes.
Experiment 2 Reaction between sodium hydrogencarbonate, , and dilute hydrochloric acid,
step 1 The student weighed an empty weighing boat and recorded the mass in Table 1.3.
step 2 The student added exactly of to the weighing boat and recorded the mass in Table 1.3.
step 3 The student carried out the same experimental procedure as in steps 2 and 3 of Experiment 1.
Table 1.3 mass results from Experiment 2
| mass of empty weighing boat / g | 0.95 |
| mass of weighing boat and / g | 5.15 |
| mass of added / g |
Explain why the method of determining the mass of solid added in Experiment 2 is less accurate than the method of determining the mass of solid added in Experiment 1.
In Experiment 2 a measuring cylinder was used to measure the of .
The measuring cylinder had graduations.
Calculate the maximum percentage error in measuring of with this measuring cylinder.
maximum percentage error = .............................. %
Explain why measuring the concentration of the more precisely would not affect the result of the experiment.
Suggest what the student should change to reduce the percentage error associated with the temperature readings without changing the apparatus.
The student used the results from Experiment 2 and correctly determined the enthalpy change for the reaction between and , , to be .
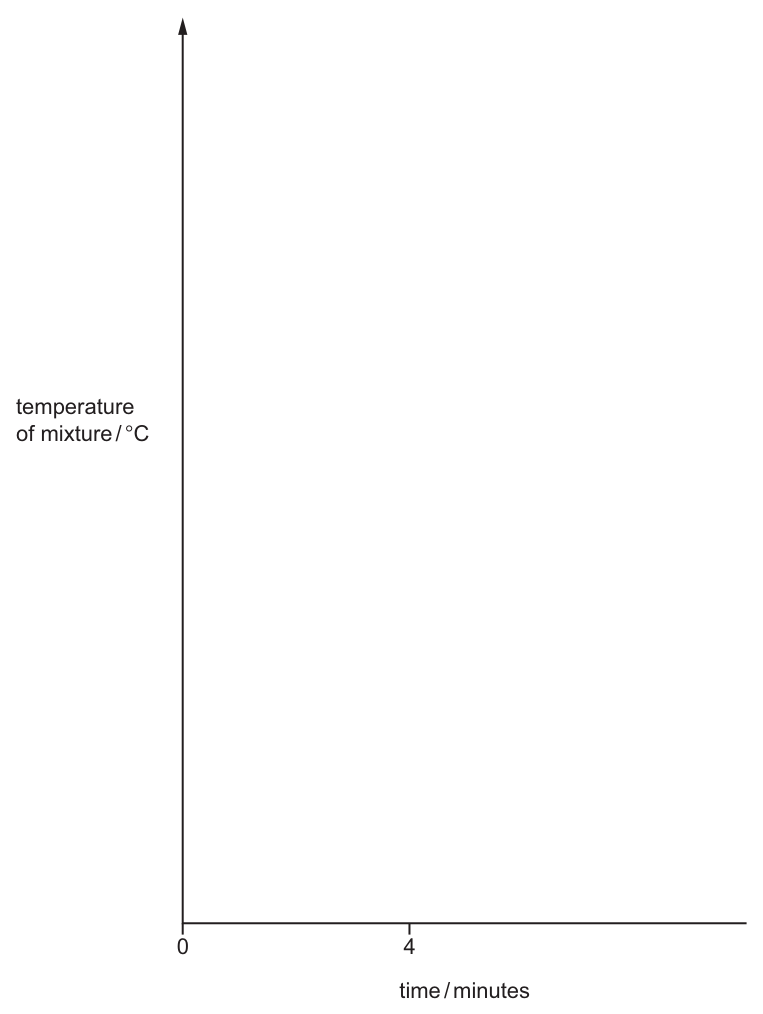
Use the axes to draw a sketch graph of the expected results of Experiment 2.
Use from (d) and from (h) to determine the enthalpy change of reaction, , for the decomposition of .
An energy cycle has been drawn for you.
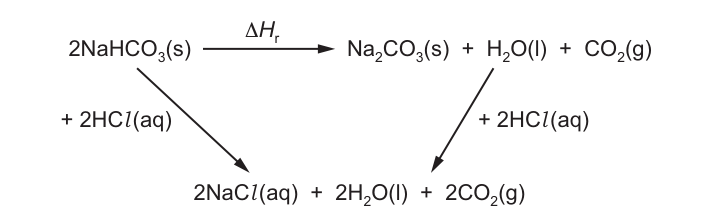
If you were unable to calculate in (d), assume . This is not the correct value of .
The rest of this paper
1 more questions- Q2Analysis, Conclusions and Evaluation · Planning12M