Chemistry 9701/52 — October/November 2011
Cambridge A-Level · Planning, Analysis and Evaluation · worked solutions for every part, with the mark scheme
Topics Analysis, Conclusions and Evaluation · Planning
When potassium nitrate dissolves in water, the temperature of the solution goes down because the enthalpy of solution is endothermic.
You are to plan an experiment to investigate how the solubility of potassium nitrate varies with temperature. The units of solubility are grams per one hundred grams of water (g/100g water).
Predict how the solubility of potassium nitrate will change if the solution temperature is increased.
Explain your prediction using the fact that dissolving potassium nitrate is endothermic.
Answer
- Solubility increases as temperature increases.
- Dissolving potassium nitrate is endothermic, so it requires energy. Increasing the temperature supplies more energy, promoting the forward (dissolution) reaction and thus increasing solubility.
Solubility increases with temperature.
Background Concept
The solubility of most solid solutes in liquid solvents is temperature-dependent. For an endothermic dissolution process (where ), heat is absorbed from the surroundings as the solid dissolves. According to Le Chatelier's principle, if a system at equilibrium is subjected to a change in temperature, the position of equilibrium will shift to counteract that change. For an endothermic reaction, increasing the temperature adds heat, which the system counteracts by absorbing more heat—shifting the equilibrium to the right (the forward direction).
Understanding the Question
The question asks for a prediction about how the solubility of potassium nitrate () changes with temperature, given that its dissolution is endothermic. It then asks for an explanation based on thermodynamic principles.
Approach
Use Le Chatelier's principle. Treat the dissolution as an equilibrium: . Since the forward reaction is endothermic, adding heat (increasing temperature) favours the forward reaction, meaning more solid will dissolve.
Step-by-Step Reasoning
- Prediction: Because the dissolution is endothermic, higher temperatures allow more solute to dissolve. Therefore, solubility increases with temperature.
- Explanation: The dissolution of requires energy (it is endothermic). Supplying more heat by increasing the temperature provides the energy needed to break the ionic lattice and hydrate the ions. The equilibrium shifts to the right to absorb the added heat, resulting in a higher concentration of dissolved ions, i.e., higher solubility.
Key Takeaways
For endothermic dissolution processes, solubility increases with temperature. This is a direct application of Le Chatelier's principle to a phase-equilibrium system.
Common Mistakes
- Stating that solubility decreases with temperature (confusing endothermic with exothermic dissolution).
- Failing to link the explanation to the endothermic nature of the process (e.g., just saying "it dissolves better when hot" without mentioning energy/heat absorption).
Things to Be Careful About
- Ensure the explanation explicitly mentions that the process is endothermic and requires energy/heat. "Supplying heat promotes the change" is a key phrase that earns the mark.
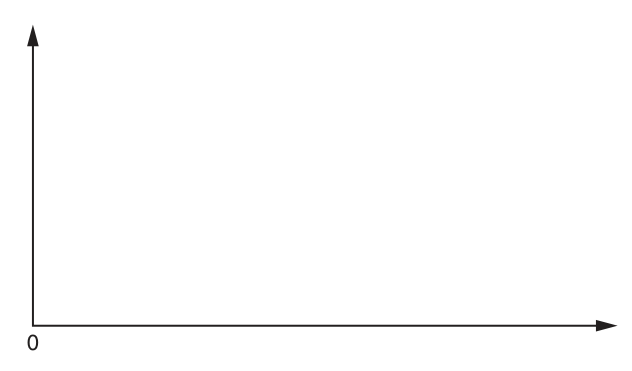
Display your prediction in the form of a sketch graph, labelling clearly the axes.
Answer
- y-axis: Solubility (g/100 g water)
- x-axis: Temperature (°C)
- A curve or straight line starting from the origin (or near it) and increasing upwards to the right.
Sketch graph with solubility on the y-axis and temperature on the x-axis, showing an increasing trend.
Background Concept
A solubility curve plots the amount of solute that can dissolve in a fixed amount of solvent (usually 100 g of water) against temperature. For substances like potassium nitrate where dissolution is endothermic, the curve slopes upwards, indicating that solubility increases as temperature rises.
Understanding the Question
You must display the prediction from part (a)(i) as a sketch graph. The axes must be clearly labelled with the correct variables and appropriate units.
Approach
Draw a set of axes. Place the independent variable (temperature) on the x-axis and the dependent variable (solubility) on the y-axis. Draw a line or curve that increases from left to right to reflect the prediction.
Step-by-Step Reasoning
- Axes labels: The x-axis represents temperature, typically in degrees Celsius (°C). The y-axis represents solubility, given in the question as grams per 100 g of water (g/100 g water).
- Curve shape: Since solubility increases with temperature, the graph must slope upwards. A smooth curve that rises steeply (convex upwards) or a straight line with a positive gradient is acceptable. The mark scheme notes that a concave curve that becomes vertical is not accepted, as it implies an unrealistic infinite solubility at a finite temperature.
- Sketch nature: It is a sketch, so exact numerical values are not required, but the trend must be clear and the axes must be labelled.
Key Takeaways
When sketching a graph, always label both axes with the physical quantity and its unit. The shape of the curve must reflect the predicted relationship between the variables.
Common Mistakes
- Forgetting to include units on the axis labels.
- Plotting temperature on the y-axis and solubility on the x-axis (reverse of convention).
- Drawing a curve that flattens out or decreases, contradicting the prediction.
Things to Be Careful About
- The question specifies the units of solubility as g/100g water. Use this exactly on the y-axis label.
- Ignore units unless the unit is the label itself; the mark scheme accepts 'solubility' or 'solubility (g/100 g water)' on the y-axis.
In the experiment you are about to plan, identify the following.
the independent variable
Answer
Temperature.
Temperature
Background Concept
In an experiment, the independent variable is the factor that is deliberately changed or controlled by the experimenter to test the effects on the dependent variable. Here, the aim is to investigate how solubility varies with temperature, meaning temperature is the variable being manipulated.
Understanding the Question
Identify the independent variable for the planned experiment.
Approach
The experiment investigates the effect of temperature on solubility. Therefore, temperature is the independent variable.
Step-by-Step Reasoning
The question states: 'investigate how the solubility of potassium nitrate varies with temperature'. The phrase 'varies with' indicates that temperature is the independent variable (x-axis) and solubility is the dependent variable (y-axis).
Key Takeaways
The independent variable is the one you change; the dependent variable is the one you measure.
Common Mistakes
- Confusing the independent and dependent variables.
- Stating 'temperature of the solution' instead of just 'temperature' (though often accepted, 'temperature' is the core variable).
Things to Be Careful About
- Keep the answer concise. 'Temperature' is sufficient.
the dependent variable
Answer
Solubility (of potassium nitrate).
Solubility
Background Concept
The dependent variable is the factor that is measured or observed in response to changes in the independent variable. In solubility experiments, this is typically expressed as the mass of solute dissolved per fixed mass of solvent (e.g., g/100 g water).
Understanding the Question
Identify the dependent variable for the planned experiment.
Approach
The experiment measures how solubility changes as temperature changes. Thus, solubility is the dependent variable.
Step-by-Step Reasoning
The question asks to investigate 'how the solubility... varies with temperature'. Solubility is the quantity being measured and plotted on the y-axis. It must be expressed as a double quantity (mass of solute per mass of solvent), not just the mass of solute dissolved, because the amount of solvent could vary between experiments.
Key Takeaways
The dependent variable is what you measure. For solubility, it is the ratio of solute mass to solvent mass.
Common Mistakes
- Stating 'mass of solute' or 'amount of solute' as the dependent variable. This is incorrect because if the mass of water varies, the mass of solute dissolved will vary even if solubility is constant. Solubility is a normalized quantity (g/100g water).
- Stating 'concentration' (though sometimes accepted if linked to the graph axis, 'solubility' is the precise term required here).
Things to Be Careful About
- Ensure the answer is 'solubility' or 'solubility of potassium nitrate'. Do not just say 'mass' or 'amount'.
Design a laboratory experiment to test your prediction in (a).
In addition to the standard apparatus present in a laboratory you are provided with the following materials,
- a boiling tube,
- a looped wire stirrer,
- a thermometer covering the temperature range 0 °C to 100 °C.
Describe how you would carry out the experiment. You should
- ensure a wide range of results suitable for analysis by graph,
- decide on the amounts of water and potassium nitrate to use,
- measure the amounts of the two reagents,
- heat the apparatus,
- decide at what point the temperature of the solution is to be taken.
Answer
- Carry out at least 5 experiments using a range of temperatures spanning at least 40 °C.
- Conduct a pilot run to determine appropriate relative amounts of potassium nitrate and water.
- Measure the mass of potassium nitrate using a balance. Measure the volume of water using a measuring cylinder (or pipette/burette), or measure the mass of water using a balance.
- Add the solid to the water in the boiling tube and stir using the looped wire stirrer.
- Heat the mixture (e.g., using a water bath or Bunsen burner) to dissolve all the potassium nitrate.
- Allow the solution to cool slowly while stirring, and record the temperature at which the first crystals of potassium nitrate appear.
See working for experimental design.
Background Concept
Determining the solubility of a solid at various temperatures can be done using a crystallisation method or a saturation method. The crystallisation method is simpler and more common in school laboratories: a saturated solution is prepared at a high temperature, allowed to cool, and the temperature at which the first crystals appear is recorded as the solubility temperature for that concentration. Alternatively, a saturation method involves heating to a specific temperature, filtering the hot solution, and evaporating the filtrate to find the mass of dissolved solute.
Understanding the Question
Design a laboratory experiment to test the prediction that solubility increases with temperature. The experiment must include at least 5 data points, a range of at least 40 °C, a pilot run, proper measurement techniques, and a clear procedure for heating and determining the temperature.
Approach
Outline a step-by-step method that covers all marking points: number of experiments, temperature range, pilot run, measurement of reagents, stirring, heating, and the temperature measurement technique. Choose the crystallisation method (Alternate 1) as it is the most straightforward.
Step-by-Step Reasoning
- Number of experiments and range: To construct a reliable graph, at least 5 experiments are needed. The temperature range must be at least 40 °C (e.g., from 30 °C to 70 °C) to show a clear trend.
- Pilot run: Before the main experiment, do a quick test to find the right ratio of solute to solvent. If there is too much solid, it won't all dissolve at 100 °C; if too little, the crystals will appear at too low a temperature.
- Measurement of reagents: Use a balance to measure the mass of potassium nitrate. Use a measuring cylinder, pipette, or burette to measure the volume of water, or use a balance to measure the mass of water directly. Record these values.
- Mixing and stirring: Add the solid to the water in the boiling tube. Stir continuously with the looped wire stirrer to ensure even heating and dissolution.
- Heating: Heat the mixture (using a Bunsen burner or a hot water bath) until all the solid has dissolved, forming a saturated solution.
- Temperature measurement: Remove the tube from the heat and allow it to cool slowly while continuing to stir. Record the temperature at which the first permanent crystals appear. This temperature corresponds to the solubility for the given mass of solute and mass/volume of water.
Key Takeaways
A good experimental design must specify the number of data points, the range of the independent variable, how reagents are measured, and the precise moment the dependent variable is recorded.
Common Mistakes
- Forgetting to mention a pilot run.
- Not specifying how the temperature is measured (e.g., 'cool and measure temperature' is too vague; 'measure temperature at which first crystals appear' is required).
- Not stirring during heating or cooling.
- Using too few experiments or a temperature range less than 40 °C.
Things to Be Careful About
- The mark scheme accepts multiple valid methods (Alternate 1 to 4). Ensure your chosen method is logically consistent and clearly described.
- For Alternate 1, emphasize 'first crystals appear' during cooling.
- For Alternates 2 and 3, emphasize 'filter while hot' and 'weigh residue' or 'evaporate filtrate'.
State a hazard that must be considered when planning the experiment and describe precautions that should be taken to keep risks to a minimum.
Answer
- Hazard: Hot boiling tube / hot apparatus.
- Precaution: Use tongs or heat-resistant gloves to handle the hot boiling tube, or allow it to cool before handling.
Hazard: hot apparatus. Precaution: use tongs or heat-resistant gloves.
Background Concept
When heating apparatus in a laboratory, the primary hazard is thermal burns from hot surfaces. Safety precautions involve using appropriate handling equipment or allowing the apparatus to cool before touching it.
Understanding the Question
State a hazard related to the experiment and describe a precaution to minimize the risk.
Approach
Identify that the boiling tube will be heated to dissolve the solute, making it a hazard. Propose a standard precaution for handling hot glassware.
Step-by-Step Reasoning
- Hazard: The boiling tube containing the solution will become very hot during the heating step. Handling it directly could cause burns.
- Precaution: Use a pair of tongs or heat-resistant gloves to hold the boiling tube when it is hot. Alternatively, allow the boiling tube to cool down before handling it. (Note: mentioning 'Bunsen burner' as the hazard is not accepted; the hazard must be the hot apparatus itself.)
Key Takeaways
Always link the hazard to a specific part of the experimental procedure and provide a practical, specific precaution.
Common Mistakes
- Stating 'Bunsen burner' or 'fire' as the hazard. The mark scheme specifically looks for 'hot' apparatus.
- Giving a vague precaution like 'be careful'.
Things to Be Careful About
- The precaution must directly address the hazard. If the hazard is 'hot boiling tube', the precaution must be 'use tongs/gloves' or 'cool before handling'.
Draw a table with appropriate headings to show the data you would record when carrying out your experiments and the values you would calculate in order to construct a graph to support or reject your prediction in (a). The headings must include the appropriate units.
Answer
| Experiment | Mass of dissolved (g) | Volume of water (cm) or Mass of water (g) | Solubility (g/100 g water) | Temperature at which first crystals appear (°C) |
|---|---|---|---|---|
| 1 | ||||
| 2 | ||||
| 3 | ||||
| 4 | ||||
| 5 |
Table with columns for mass of solid, volume/mass of water, solubility, and temperature, all with correct units.
Background Concept
A results table must clearly show the raw data collected during the experiment and any calculated values needed to construct a graph. Headings must include the physical quantity and its unit. For a solubility graph, the x-axis is temperature and the y-axis is solubility (g/100 g water).
Understanding the Question
Draw a table with appropriate headings to show the data to be recorded and the values to be calculated. The headings must include units.
Approach
Identify the raw data: mass of solute, volume or mass of solvent, and the temperature at which crystallization occurs. Identify the calculated value: solubility (g/100 g water). Create a table with these headings.
Step-by-Step Reasoning
- Raw data columns:
- Mass of solid () dissolved: unit is grams (g).
- Amount of water: volume in cm (using a measuring cylinder) or mass in grams (g) (using a balance). Both are acceptable.
- Temperature: the temperature of the solution at which the first crystals appear, in degrees Celsius (°C).
- Calculated column:
- Solubility: calculated as . Unit is g/100 g water.
- Table structure: Include an 'Experiment' or 'Trial' column for numbering. Ensure all headings have units in brackets or as part of the heading.
Key Takeaways
Results tables must have clear headings with units. Calculated columns must be derived from the raw data and used for the final graph.
Common Mistakes
- Forgetting to include units in the table headings.
- Including 'mass of solute' as the dependent variable instead of 'solubility'.
- Recording 'final temperature' instead of 'temperature at which first crystals appear' (unless using the saturation method, in which case 'temperature of solution' is acceptable).
- Having fewer than three or four correct headings, which results in zero or one mark.
Things to Be Careful About
- The mark scheme awards 2 marks for all five correct headings (mass of solid, volume/mass of water, solubility, temperature, and units). Three or four correct headings earn 1 mark. Two or fewer earn 0 marks.
- Ensure the temperature heading specifically relates to the temperature of the solution (e.g., 'temperature at which crystals appear'), not just 'temperature' or 'room temperature'.
The rest of this paper
1 more questions- Q2Analysis, Conclusions and Evaluation15M