Chemistry 9701/53 — October/November 2010
Cambridge A-Level · Planning, Analysis and Evaluation · worked solutions for every part, with the mark scheme
Topics Analysis, Conclusions and Evaluation · Planning
Aqueous hydrogen peroxide decomposes into oxygen gas and water. The reaction is normally very slow but is catalysed by solid manganese(IV) oxide.
You are to plan an experiment to investigate how the rate of the catalysed decomposition of aqueous hydrogen peroxide depends on its concentration.
The rate of decomposition depends on the number of hydrogen peroxide molecules present in a given volume of solution.
Use this information to predict and explain how the rate of decomposition of the hydrogen peroxide depends on the concentration.
Prediction
Explanation
Display your prediction in the form of a sketch graph below.
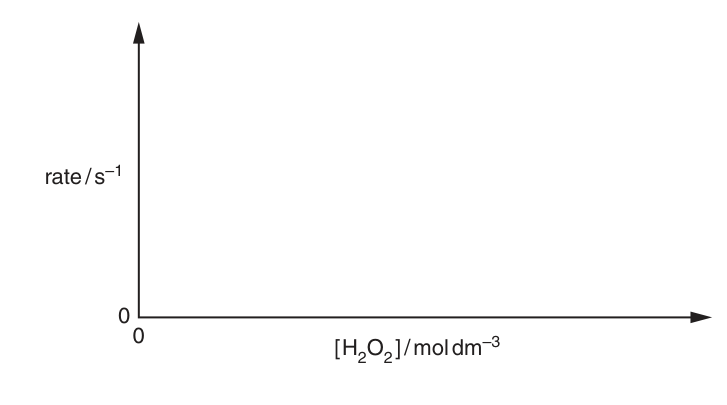
An approximate method for the determination of the rate of decomposition of the hydrogen peroxide is to measure the time taken to collect a fixed volume of oxygen. The volume is kept the same throughout a series of experiments. The rate of the reaction can be represented by the reciprocal of the time taken.
In the experiment you are about to plan identify the following.
the independent variable
the dependent variable
Draw a diagram of the apparatus you would use in the experiment. Your apparatus should use only standard items found in a school or college laboratory and show clearly the following.
How the volume of the oxygen will be collected and measured.
How you will make sure that none of the oxygen is lost.
Label each piece of apparatus used, indicating its size or capacity.
Using the apparatus shown in (c) design a laboratory experiment to test your prediction in (a).
In addition to the standard apparatus present in a laboratory you are provided with the following materials.
- aqueous hydrogen peroxide
- a supply of manganese(IV) oxide
Complete the table below to show how you would prepare five solutions of aqueous hydrogen peroxide. Make sure that the correct units are recorded.
| expt. No. | volume of | volume of | concentration of |
|---|---|---|---|
| 1 | |||
| 2 | |||
| 3 | |||
| 4 | |||
| 5 |
Give a step-by-step description of how you would use your apparatus shown in (c) to carry out one complete experiment.
State a problem which might be experienced by someone having to carry out these experiments alone.
Draw a table with appropriate headings to show the data you would record when carrying out your experiments and the values you would calculate in order to construct a graph to support or reject your prediction in (a). The headings should include appropriate units.
The rest of this paper
1 more questions- Q2Analysis, Conclusions and Evaluation15M