Chemistry 9701/52 — October/November 2010
Cambridge A-Level · Planning, Analysis and Evaluation · worked solutions for every part, with the mark scheme
Topics Analysis, Conclusions and Evaluation · Planning
When aqueous sodium chloride, , is added to aqueous lead nitrate, , a white precipitate of lead chloride, , is produced. A suggested stoichiometric equation is
In separate experiments, different volumes of aqueous sodium chloride are added to a fixed volume of aqueous lead nitrate. In each case, the precipitate is filtered, washed with distilled water and thoroughly dried. The mass of the precipitate is recorded.
You are to plan an experiment to investigate this reaction in order to confirm or reject the stoichiometry of the equation.
By considering the suggested stoichiometric equation, predict and explain how the number of moles of the precipitate, , will change as the number of moles of added increases.
Prediction
Explanation
Answer
Prediction: The number of moles of PbCl₂ will increase in direct proportion to the number of moles of NaCl added (until the lead nitrate is in excess).
Explanation: The balanced stoichiometric equation shows a 1 : 2 molar ratio between PbCl₂ and NaCl. Therefore, for every 2 moles of NaCl added, 1 mole of PbCl₂ is produced, leading to a direct proportional increase in precipitate moles.
Prediction: moles of PbCl₂ increase directly with moles of NaCl. Explanation: equation shows a 1:2 molar ratio between PbCl₂ and NaCl.
Background Concept
In a precipitation reaction, the amount of solid product formed is governed by the limiting reagent. As long as one reactant is in excess, adding more of the other reactant will linearly increase the amount of product, dictated by the stoichiometric coefficients in the balanced chemical equation. Once the limiting reactant is completely consumed, adding more of the excess reactant will not produce any additional product, resulting in a plateau (horizontal line) on a graph of product vs. reactant added.
Understanding the Question
The question asks for a prediction and explanation of how the moles of lead(II) chloride precipitate will change as more sodium chloride is added to a fixed amount of lead(II) nitrate. We must base this purely on the provided stoichiometric equation: .
Approach
- Look at the coefficients of and in the balanced equation to determine their molar ratio.
- State that as increases, increases proportionally.
- Explain that this is because the reaction consumes them in a fixed 1:2 ratio.
Step-by-Step Reasoning
- Prediction: Since is fixed and is being added, initially is the limiting reagent. As more is added, more will form. The mark scheme accepts a statement that the moles of precipitate will increase (directly) as moles of NaCl increase.
- Explanation: The balanced equation shows that 2 moles of produce 1 mole of . This 1:2 molar ratio is the fundamental reason for the proportional increase. The mark scheme specifically looks for the recognition of this 1 to 2 molar ratio.
Key Takeaways
When predicting the outcome of mixing varying amounts of one reactant with a fixed amount of another, always refer to the stoichiometric coefficients to establish the molar ratio. The initial phase will always show direct proportionality until the limiting reagent is exhausted.
Common Mistakes
- Stating that the mass will increase indefinitely without mentioning that it will eventually plateau once the lead nitrate is used up (though for this specific part, focusing on the initial proportional increase is sufficient, the explanation of the ratio is key).
- Failing to explicitly state the molar ratio from the equation in the explanation.
Things to Be Careful About
- The prediction should focus on the moles of precipitate, not just the mass, as the question specifically asks for moles.
- Ensure the explanation directly references the 1:2 ratio between and as derived from the equation.
State a limiting factor that must be taken into account when increasing the volume of the aqueous sodium chloride added.
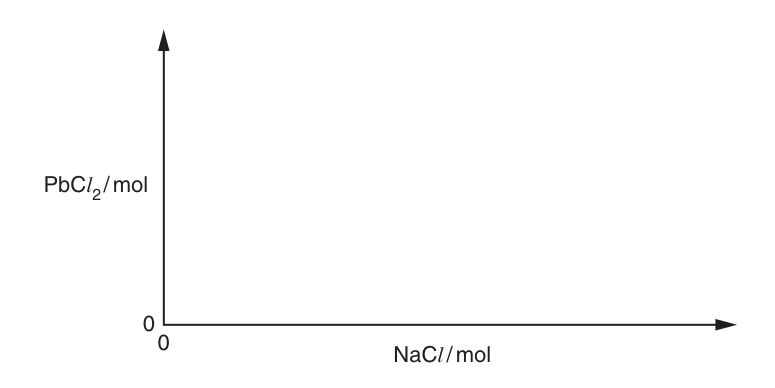
Sketch the graph which would result if, after some of the experiments, the is in excess. Start your graph with no added.
Answer
Limiting factor: The fixed amount (moles, concentration, or total volume) of lead(II) nitrate solution will eventually be completely used up, meaning no more precipitate can form regardless of how much more NaCl is added.
Graph Sketch:
A straight diagonal line starting from the origin (0,0) with a positive gradient, which then abruptly changes to a horizontal line at the maximum moles of PbCl₂.
Limiting factor: fixed moles/volume/concentration of Pb(NO3)2. Graph: diagonal line from origin turning abruptly horizontal.
Background Concept
When investigating a reaction by varying one reactant while keeping another fixed, the graph of product formed versus reactant added will typically show an initial linear increase followed by a plateau. The plateau occurs because the fixed reactant becomes the limiting reagent; once it is fully consumed, the reaction stops, and no additional product can be formed.
Understanding the Question
Part (b) asks for two things:
- A limiting factor to consider when increasing the volume of NaCl. Since the lead nitrate is fixed, there is a maximum amount of precipitate that can form.
- A sketch of the graph of moles of PbCl₂ vs. moles of NaCl, starting from no NaCl added, specifically showing the region where NaCl is in excess (the plateau).
Approach
- Identify that the fixed lead nitrate solution is the limiting factor. Once its moles are exhausted, the reaction halts.
- Sketch the graph: start at (0,0), draw a straight line with a positive slope (direct proportionality), and then draw a horizontal line to represent the excess NaCl region where product amount is constant.
Step-by-Step Reasoning
- Limiting factor: The question states a fixed volume of 0.10 mol dm⁻³ lead nitrate is used. Therefore, the total moles of Pb²⁺ ions is constant. Once all Pb²⁺ ions have reacted with Cl⁻ ions to form PbCl₂, adding more NaCl will not produce more precipitate. The mark scheme accepts 'all the lead nitrate was used up', 'moles or concentration of lead nitrate', or 'total volume of lead nitrate'. It explicitly rejects 'amount' as it is vague.
- Graph sketch:
- Axis: y-axis is 'PbCl₂ / mol', x-axis is 'NaCl / mol'.
- Initial phase: From 0 moles of NaCl, as NaCl is added, PbCl₂ forms. This is a direct proportion, so a straight diagonal line through the origin.
- Excess phase: Once the lead nitrate is used up, the moles of PbCl₂ remain constant even as NaCl moles increase. This is a horizontal line.
- The transition is an abrupt change (a 'kink') from the diagonal to the horizontal line. The mark scheme gives marks for a diagonal line from origin, or a curve with decreasing gradient, but specifically requires the horizontal line for the excess region.
Key Takeaways
Graphs of this type (product vs. reactant added) are fundamental in stoichiometry. The initial slope depends on the molar ratio, and the plateau height depends on the moles of the limiting reagent.
Common Mistakes
- Drawing a curve that continues to rise slowly instead of becoming horizontal.
- Starting the diagonal line not from the origin (e.g., having an initial lag).
- Using the word 'amount' for the limiting factor without specifying moles, concentration, or volume.
Things to Be Careful About
- Ensure the graph clearly shows the abrupt change to a horizontal line. A smooth curve that asymptotes is often penalized unless it's a specific kinetic graph, but here the reaction is instantaneous precipitation, so the change is sharp.
- The x-axis must be 'NaCl / mol' (or volume, but the diagram specifies mol), and y-axis 'PbCl₂ / mol'.
In the experiment you are about to plan, identify the following.
the independent variable
Answer
Volume (or moles) of aqueous sodium chloride added.
Volume (or moles) of aqueous sodium chloride
Background Concept
In an experiment, the independent variable is the factor that the experimenter deliberately changes or controls to test its effects on the dependent variable. The dependent variable is what is measured or observed in response.
Understanding the Question
Part (c)(i) asks to identify the independent variable in the planned experiment. The text states: 'different volumes of 0.20 mol dm⁻³ aqueous sodium chloride are added to a fixed volume of 0.10 mol dm⁻³ aqueous lead nitrate.'
Approach
Look at what is being varied systematically. The volume (and thus moles) of NaCl is changed; the volume and concentration of Pb(NO₃)₂ are fixed.
Step-by-Step Reasoning
- The experiment varies the amount of NaCl added. Therefore, the independent variable is the volume (or moles) of aqueous sodium chloride. The mark scheme accepts volume, mass, or moles of NaCl.
Key Takeaways
The independent variable is what you change; the dependent variable is what you measure.
Common Mistakes
- Confusing the independent and dependent variables.
- Stating 'concentration of NaCl' as the independent variable, but the concentration is fixed at 0.20 mol dm⁻³; only the volume changes.
Things to Be Careful About
- Ensure you specify 'volume' or 'moles' of NaCl, not just 'NaCl'.
the dependent variable
Answer
Mass (or moles) of lead(II) chloride precipitate formed.
Mass (or moles) of lead(II) chloride precipitate
Background Concept
The dependent variable is the outcome being measured. It 'depends' on the changes made to the independent variable.
Understanding the Question
Part (c)(ii) asks for the dependent variable. The text states: 'The mass of the precipitate is recorded.'
Approach
Identify what is being measured as a result of changing the NaCl volume.
Step-by-Step Reasoning
- The experiment records the mass of the precipitate (PbCl₂) after filtering, washing, and drying. Therefore, the dependent variable is the mass (or calculated moles) of PbCl₂ precipitate.
Key Takeaways
The dependent variable is the data collected to analyze the relationship with the independent variable.
Common Mistakes
- Stating 'mass of the beaker' or 'volume of solution' as the dependent variable. Only the mass of the dried precipitate is the final measured quantity of interest.
Things to Be Careful About
- The mark scheme accepts 'moles' or 'mass' of PbCl₂. Since the raw data is mass, 'mass of precipitate' is the most direct answer.
another variable to be controlled
Answer
Temperature.
Temperature
Background Concept
Controlled variables (or constants) are factors that are kept the same throughout the experiment to ensure that any change in the dependent variable is solely due to the independent variable. This makes the test fair and the results reliable.
Understanding the Question
Part (c)(iii) asks for another variable to be controlled. The independent variable is volume of NaCl, and the dependent variable is mass of PbCl₂. The concentration and volume of Pb(NO₃)₂ are already fixed by the method.
Approach
Think about what else could affect the rate or extent of precipitation, or the solubility of the product, if not kept constant. Temperature is a classic factor affecting solubility and reaction rates.
Step-by-Step Reasoning
- Temperature affects the solubility of PbCl₂ (which is slightly soluble and its solubility increases with temperature) and the rate of reaction. Therefore, the experiment should be conducted at a constant temperature (e.g., room temperature).
- The mark scheme explicitly rejects 'amount' or 'concentration of NaCl' as these are the variables being manipulated or are fixed by design.
Key Takeaways
Always consider physical conditions like temperature, pressure, or surface area that could influence the outcome.
Common Mistakes
- Suggesting 'concentration of NaCl' as a controlled variable. While its concentration is fixed, the volume is the independent variable. Suggesting 'amount of Pb(NO₃)₂' is also wrong as it's the fixed baseline.
Things to Be Careful About
- 'Temperature' is the standard, accepted answer for this type of precipitation experiment. Avoid vague answers like 'time' unless specifically relevant to the drying process.
Design a laboratory experiment to test your prediction in (a).
You are provided with of aqueous sodium chloride.
Outline how you would prepare of aqueous lead nitrate.
[: N, 14; O, 16; Pb, 207]
Working
Calculation:
Answer
- Weigh out 8.275 g (or 8.3 g) of solid Pb(NO₃)₂.
- Dissolve the solid in a beaker using a small volume of distilled water (less than 250 cm³) and stir until fully dissolved.
- Transfer the solution to a 250 cm³ volumetric flask, add distilled water to the 250 cm³ mark, and mix thoroughly to make up to the mark.
8.275 g dissolved in <250 cm3 water, made up to 250 cm3 in a volumetric flask.
Background Concept
Preparing a standard solution of a specific concentration and volume requires precise calculations and the use of a volumetric flask. The key steps are: calculating the required mass, dissolving the solute in less than the final volume, transferring quantitatively to the volumetric flask, and making up to the mark with solvent.
Understanding the Question
Part (d)(i) asks how to prepare 250 cm³ of 0.10 mol dm⁻³ aqueous lead nitrate, given the values. This is a standard solution preparation question.
Approach
- Calculate the molar mass of Pb(NO₃)₂.
- Calculate the moles needed for 250 cm³ (0.250 dm³) of 0.10 mol dm⁻³ solution.
- Calculate the mass required.
- Describe the standard laboratory procedure for making up a solution in a volumetric flask.
Step-by-Step Reasoning
- Calculation:
The mark scheme accepts 8.275 g or 8.3 g. - Procedure:
- Dissolving: You cannot add 250 cm³ of water directly to the solid in a volumetric flask because the solid occupies volume, and you need to ensure it dissolves. Dissolve in a beaker with a small amount of water (<250 cm³).
- Transferring: Pour into a 250 cm³ volumetric flask. (Technically, you should rinse the beaker and add the rinsings to the flask to ensure quantitative transfer, but the mark scheme focuses on the main steps).
- Making up to the mark: Add distilled water until the bottom of the meniscus is exactly on the 250 cm³ mark on the neck of the flask. Mix by inverting.
- The mark scheme explicitly gives 0 marks for 'diluting a given solution' or 'synthesizing from lead and nitric acid'. You must start from the solid.
Key Takeaways
Always calculate the mass first. The procedure for a volumetric flask is highly standardized: dissolve in beaker with < final volume, transfer, make up to mark.
Common Mistakes
- Adding 250 cm³ of water directly to the solid in the volumetric flask. The final solution volume is 250 cm³, not the volume of water added.
- Forgetting to convert cm³ to dm³ when calculating moles ().
- Using a measuring cylinder instead of a volumetric flask for the final make-up.
Things to Be Careful About
- The mark scheme states: 'if 250 cm³ of water are added directly... allow 1 mark'. This means you must explicitly mention dissolving in a beaker with less than 250 cm³ first.
- Ensure state symbols or physical states are implied correctly (solid to aqueous).
Give a step by step description of how you would carry out one experiment.
You should state
- the volumes of each solution to be used,
- how the volumes will be measured,
- how you would dry the precipitate.
Answer
Measurement: Use a burette or pipette to measure 50.0 cm³ of the 0.10 mol dm⁻³ Pb(NO₃)₂ solution into a beaker. Use a burette or measuring cylinder to measure 100.0 cm³ (or another suitable volume ≤ 100 cm³) of the 0.20 mol dm⁻³ NaCl solution and add it to the beaker. Stir to precipitate.
Drying: Filter the mixture using filter paper. Wash the precipitate with distilled water. Dry the precipitate by pressing it between sheets of filter paper, or placing it in a warm oven, or adding propanone (acetone) and allowing it to evaporate. Do not use a Bunsen burner or microwave.
Measure with burette/pipette/cylinder; dry by pressing with filter paper, warm oven, or propanone (not Bunsen).
Background Concept
In quantitative precipitation experiments, accurate volume measurement is crucial. Pipettes and burettes are more precise than measuring cylinders. Drying a precipitate must be done carefully; many metal salts (especially nitrates and chlorides) can decompose or lose water of crystallization if heated strongly with a Bunsen burner. Gentle drying methods are required.
Understanding the Question
Part (d)(ii) asks for a step-by-step description of one experiment, including volumes, measurement apparatus, and drying method.
Approach
- Choose volumes that fit within the provided 250 cm³ of NaCl and keep total volume reasonable. E.g., 50 cm³ Pb(NO₃)₂ and 100 cm³ NaCl.
- Specify appropriate apparatus for these volumes (burette/pipette for high precision, measuring cylinder for lower precision but acceptable if stated).
- Describe the filtration and a safe drying method.
Step-by-Step Reasoning
- Volumes and Measurement:
- The plan in (d)(i) makes 250 cm³ of Pb(NO₃)₂. A typical experiment might use 50 cm³ of this. Measure this using a pipette (50.0 cm³) or burette for high accuracy. Alternatively, a measuring cylinder is accepted by the mark scheme if used for ≤ 50 cm³.
- For NaCl, we have 250 cm³ available. To test excess, we might use 100 cm³. Measure this using a burette or measuring cylinder (≤ 100 cm³).
- The mark scheme accepts 'mention of only one measuring vessel' for the mark, but specifying burette/pipette is best practice.
- Drying the precipitate:
- PbCl₂ is an ionic solid. Heating it strongly with a Bunsen burner might cause decomposition or splattering.
- Correct methods: Pressing with filter paper (absorbs surface water), placing in a warm oven (low temperature), or washing with a volatile solvent like propanone (acetone) which evaporates quickly at room temperature.
- Incorrect methods: Mark scheme explicitly rejects 'heat', 'Bunsen burner', or 'microwave'.
Key Takeaways
Always justify apparatus choice based on precision. For drying precipitates, avoid high heat unless the salt is known to be thermally stable; use physical absorption or gentle evaporation.
Common Mistakes
- Suggesting 'heating in a crucible over a Bunsen flame' to dry. This is dangerous for many precipitates and can decompose them.
- Using a syringe for volume measurement (not accepted in this syllabus context).
- Not specifying the volumes used or how they are measured.
Things to Be Careful About
- The mark scheme says 'not a syringe'. Use burette, pipette, or measuring cylinder.
- Ensure the drying method is explicitly stated and is not a Bunsen burner.
In the table below
- enter appropriate headings to show additional data you would record when carrying out your experiments and the values you would calculate in order to construct a graph to support or reject your prediction in (a). The headings should include the appropriate units,
- enter the volumes from your plan in (d),
- enter suitable volumes for four further experiments.

Answer
Table Headings and Data:
| Volume of Pb(NO₃)₂ / cm³ | Volume of NaCl / cm³ | Mass of PbCl₂ / g | Moles of NaCl / mol | Moles of PbCl₂ / mol |
|---|---|---|---|---|
| 50.0 | 0.0 | 0.00 | 0.000 | 0.000 |
| 50.0 | 25.0 | (record) | 0.005 | (calculate) |
| 50.0 | 50.0 | (record) | 0.010 | (calculate) |
| 50.0 | 75.0 | (record) | 0.015 | (calculate) |
| 50.0 | 100.0 | (record) | 0.020 | (calculate) |
(Note: Volumes of Pb(NO₃)₂ and NaCl must total ≤ 250 cm³. Moles of NaCl = Volume / 1000 × 0.20. Moles of PbCl₂ = Moles of NaCl / 2.)
Table with columns: Vol Pb(NO3)2/cm3, Vol NaCl/cm3, Mass PbCl2/g, Moles NaCl/mol, Moles PbCl2/mol. Constant Pb(NO3)2 volume, varying NaCl volume.
Background Concept
A well-designed data table in a practical investigation must include the raw data (independent and dependent variables with units), any processed data required for analysis (like converting mass to moles), and sufficient rows to plot a meaningful graph (usually at least 5-6 points).
Understanding the Question
Part (e) asks to fill a table (6 columns, 5 rows) with:
- Appropriate headings with units for additional data and calculated values.
- The volumes from the plan in (d).
- Suitable volumes for four further experiments.
Approach
- Identify the columns needed: Independent variable (Vol NaCl), Fixed variable (Vol Pb(NO₃)₂), Dependent variable (Mass PbCl₂), and calculated columns for the graph (Moles NaCl, Moles PbCl₂).
- Fill in the first row with the volumes from part (d) (e.g., 50 cm³ Pb(NO₃)₂ and 100 cm³ NaCl).
- Fill the next four rows with varying volumes of NaCl (e.g., 0, 25, 50, 75 cm³) while keeping Pb(NO₃)₂ constant at 50 cm³.
- Calculate the moles for the headers.
Step-by-Step Reasoning
- Headings and Units:
- Column 1: Volume of Pb(NO₃)₂ / cm³ (or mol dm⁻³, but volume is the controlled variable here). Unit: cm³.
- Column 2: Volume of NaCl / cm³. Unit: cm³.
- Column 3: Mass of PbCl₂ / g (or weight of precipitate / g). Unit: g.
- Column 4: Moles of NaCl / mol. Unit: mol.
- Column 5: Moles of PbCl₂ / mol. Unit: mol.
- The mark scheme requires units like /cm³, /g, /mol. Accepts ( ) instead of /.
- Data Entry:
- Row 1 (Plan from d): 50.0 cm³ Pb(NO₃)₂, 100.0 cm³ NaCl. Mass is left blank as it's experimental data to be recorded.
- Rows 2-5: Keep Pb(NO₃)₂ at 50.0 cm³. Vary NaCl: e.g., 0.0, 25.0, 50.0, 75.0 cm³. Total volume must be ≤ 250 cm³ (50+100=150, 50+75=125, etc.).
- Calculations:
- Moles NaCl = . E.g., for 100 cm³: mol.
- Moles PbCl₂ = Moles NaCl / 2 (from 1:2 ratio). E.g., 0.010 mol.
- The mark scheme says 'ignore numbers in the mole columns' if they are wrong, but 'enter suitable volumes'. The calculated moles are for the graph support, so they must be correct if calculated.
Key Takeaways
Tables must have clear headings with units. Calculated columns should be used to linearize data or match the graph axes (moles vs moles, or mass vs moles).
Common Mistakes
- Forgetting units in the table headings.
- Including 'volume of water' as a column (not required and adds confusion).
- Using 'n' instead of 'moles' in headings.
- Having the volume of Pb(NO₃)₂ vary instead of keeping it constant.
- Total volume exceeding 250 cm³.
Things to Be Careful About
- The mark scheme says 'no figures are required for the mass of the ppt'. Leave it blank or put 'record'.
- Do not put '0' for the volume of Pb(NO₃)₂ or NaCl in the data rows if it implies no reaction; 0 volume of NaCl is fine (control), but 0 volume of Pb(NO₃)₂ is invalid.
- Ensure the table has enough columns to fit the 6-column template provided (5 data columns + 1 header or similar layout).
How would you ensure that at the end of each experiment the precipitate was thoroughly dried?
Answer
Repeat the drying process (e.g., reheat or re-dry) and weigh the precipitate until a constant mass is achieved.
Dry to constant mass.
Background Concept
In gravimetric analysis, it is crucial to ensure that all water (and volatile solvents) have been removed from the precipitate before weighing. A single drying period might not remove all moisture, especially if the precipitate is hygroscopic or trapped water is present in the crystal lattice or filter paper.
Understanding the Question
Part (f) asks how to ensure the precipitate is thoroughly dried at the end of each experiment.
Approach
The standard analytical technique to confirm complete drying is to dry, cool, weigh, and repeat until the mass does not change.
Step-by-Step Reasoning
- Technique: After the initial drying (e.g., in a warm oven or with filter paper), the precipitate and filter paper (or crucible) are weighed. They are then dried again for a further period, cooled in a desiccator (to prevent re-absorption of moisture), and weighed again.
- Criterion: If the mass is the same as the previous weighing, the precipitate is thoroughly dried. This is called reaching 'constant mass'.
- The mark scheme accepts 'drying process should be repeated to constant mass' or 'heat/reheat to constant mass/weight'.
Key Takeaways
'Constant mass' is the keyword for confirming complete drying or decomposition in gravimetric analysis.
Common Mistakes
- Stating 'leave it in the sun to dry' or 'leave overnight' without mentioning repeating until constant mass. Time is not a reliable indicator of complete dryness.
- Forgetting to cool the precipitate before weighing (hot objects create convection currents that affect the balance reading, and may absorb moisture).
Things to Be Careful About
- The mark scheme specifically looks for 'constant mass'. Use this exact phrase.
The rest of this paper
1 more questions- Q2Analysis, Conclusions and Evaluation14M