Biology 9700/38 — October/November 2025
Cambridge AS Level · Advanced Practical Skills · worked solutions for every part, with the mark scheme
Topics Presentation of Data and Observations · Analysis, Conclusions and Evaluation · Manipulation, Measurement and Observation · Use of the Light Microscope
Yeast cells contain enzymes that hydrolyse sucrose into reducing sugars, as shown in Fig. 1.1.
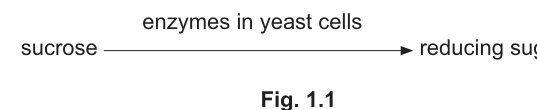
You will investigate the activity of the enzymes in yeast cells that are immobilised in sodium alginate beads and yeast cells that are in a suspension (‘free’ yeast cells).
You are provided with the materials shown in Table 1.1.
Table 1.1
| labelled | contents | hazard | volume / |
|---|---|---|---|
| Y | yeast cell suspension | low | 20 |
| A | sodium alginate solution | low | 20 |
| C | calcium chloride solution | low | 20 |
| S | sucrose solution | low | 50 |
| Benedict’s | Benedict’s solution | harmful irritant | 20 |
| W | distilled water | low | 50 |
If any solution comes into contact with your skin, wash off immediately with cold water.
It is recommended that you wear suitable eye protection.
You will need to:
- immobilise some of the yeast cells in sodium alginate
- put the immobilised yeast cells and some ‘free’ yeast cells into sucrose solution
- test both solutions for reducing sugars
- compare the activity of immobilised yeast cells and ‘free’ yeast cells.
Investigating the activity of the enzymes in immobilised yeast cells
Carry out step 1 to step 20.
step 1 Put of sodium alginate, A, into a beaker.
step 2 Stir the yeast cell suspension, Y, and put of Y into the beaker containing A. Mix well.
step 3 Use a syringe to collect of the mixture of A and Y. Wipe the outside of the syringe.
step 4 Hold this syringe over the beaker containing calcium chloride solution, C, as shown in Fig. 1.2.
step 5 Slowly press down on the plunger so that a drop of the mixture is released into C. The drop will form a bead.
step 6 Repeat step 5 until all of the mixture in the syringe has been formed into beads.
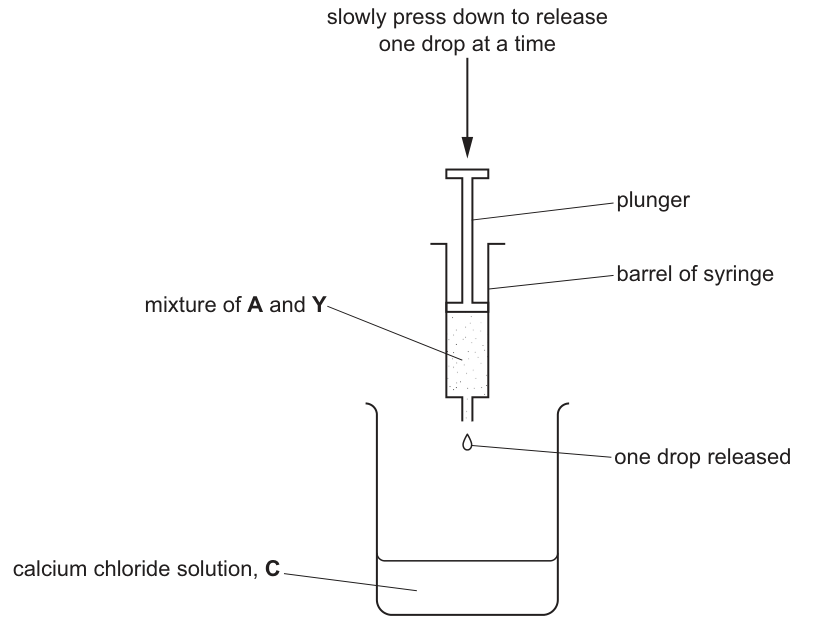
step 7 Leave the beads in the beaker for at least 5 minutes.
step 8 Set up a boiling water-bath ready for step 18.
step 9 Label a beaker B.
step 10 Put of sucrose solution, S, into the beaker labelled B.
step 11 Label 5 test-tubes 1, 2, 3, 4 and 5.
step 12 Put of Benedict’s into each of the test-tubes.
step 13 After at least 5 minutes (step 7), separate the beads from solution C using the apparatus shown in Fig. 1.3.
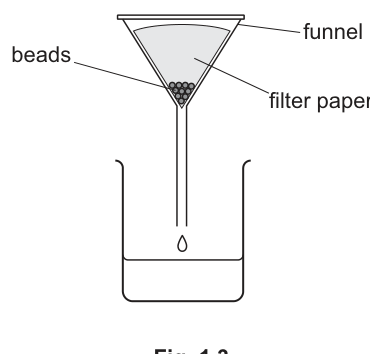
After step 14 you will remove a sample from B every minute for 5 minutes.
step 14 Put all of the beads into the beaker labelled B. Stir and then start timing.
step 15 At 1 minute, stir the contents of beaker B and use a syringe to transfer of the solution surrounding the beads into the test-tube labelled 1.
step 16 At 2 minutes, stir the contents of beaker B and use a syringe to transfer of the solution surrounding the beads into the test-tube labelled 2.
step 17 Continue taking samples at 3, 4 and 5 minutes using the test-tubes labelled 3, 4 and 5.
step 18 Put test-tube 1 into the boiling water-bath and measure the time to the first colour change. Record your result in (a)(i).
If there is no colour change after 60 seconds, stop timing and record the time as ‘more than 60’.
step 19 Remove the test-tube from the boiling water-bath.
step 20 Repeat step 18 and step 19 for the test-tubes labelled 2, 3, 4 and 5.
Investigating the activity of the enzymes in ‘free’ yeast cells
To investigate the activity of the enzymes in ‘free’ yeast cells, you will need to test the samples with Benedict’s solution immediately after the sample is taken.
The water-bath should be boiling throughout this part of the investigation.
Carry out step 21 to step 32.
step 21 Label a beaker F.
step 22 Put of sucrose solution, S, into the beaker labelled F.
step 23 Label 5 clean test-tubes 1, 2, 3, 4 and 5.
step 24 Put of Benedict’s into each of the test-tubes.
step 25 Stir the yeast cell suspension, Y, and put of Y into the beaker labelled F. Mix well and start timing.
The timer should not be stopped until you have completed step 32 – keep the timer running continuously.
step 26 At 1 minute, use a syringe to transfer of the solution in F into the test-tube labelled 1. Do not stop the timer.
step 27 Immediately put test-tube 1 into the boiling water-bath and measure the time to the first colour change. Record your result in (a)(i).
If there is no colour change after 60 seconds, record the time as ‘more than 60’.
step 28 Remove the test-tube from the boiling water-bath.
step 29 At 2 minutes, use a syringe to transfer of the solution in F into the test-tube labelled 2. Do not stop the timer.
step 30 Immediately put test-tube 2 into the boiling water-bath and measure the time to the first colour change. Record your result in (a)(i).
If there is no colour change after 60 seconds, record the time as ‘more than 60’.
step 31 Remove the test-tube from the boiling water-bath.
step 32 Repeat step 30 and step 31 at 3, 4 and 5 minutes using the test-tubes labelled 3, 4 and 5.
Answer
Representative results table (the actual recorded times will be student-dependent):
| (yeast) beads / B and free yeast | time / min | time to first appearance of colour change / s |
|---|---|---|
| beads (B) | 1 | 35 |
| 2 | 30 | |
| 3 | 25 | |
| 4 | 20 | |
| 5 | 15 | |
| free yeast (F) | 1 | 20 |
| 2 | 15 | |
| 3 | 12 | |
| 4 | 10 | |
| 5 | 8 |
Key conventions used:
- Independent variable (type of yeast preparation) is placed to the left of the dependent variable.
- Dependent-variable heading includes the quantity and the unit (/s); no units are written in the body of the table.
- Five results are recorded for each yeast preparation.
- All times are recorded to the nearest whole second.
- Correct trend: as the sampling time increases, the time to first colour change decreases for both preparations (more reducing sugar has accumulated, so Benedict's reduces faster).
See working — student-dependent values, example shown above.
Background Concept
Yeast cells contain the enzyme invertase (also called sucrase), which hydrolyses the disaccharide sucrose into its two component monosaccharides — glucose and fructose. Both products are reducing sugars and will therefore give a positive result with Benedict's reagent: when heated with Benedict's solution, Cu(II) ions in the complex are reduced to Cu(I) and the colour of the solution changes from blue → green → yellow → orange → brick-red, depending on the concentration of reducing sugar present.
In this investigation, the candidate compares the activity of the same enzyme in two physical states: immobilised in sodium alginate beads and free in suspension. Immobilisation traps the cells inside a porous calcium alginate gel; substrate and product can still diffuse in and out, but the cells are held in place and can be recovered by filtration.
The Benedict's test is being used in a semi-quantitative way: instead of recording how much precipitate forms, the candidate records the time taken for the first appearance of any colour change after adding Benedict's reagent and placing the tube in a boiling water-bath. A shorter time to the first colour change implies a higher concentration of reducing sugar in the sample, which in turn implies a higher rate of sucrose hydrolysis up to that sampling point.
Understanding the Question
Part (a)(i) asks the candidate to record all ten timings — five from beaker B (immobilised beads) and five from beaker F (free yeast) — in an appropriately constructed table. The command word is record, so the mark scheme rewards the conventions of table construction rather than any particular numerical result.
The candidate has just carried out steps 14–32: every minute, for five minutes, 1 cm³ of solution is taken and mixed with Benedict's reagent, heated, and timed to the first colour change. The result is a paired set of timings for each yeast preparation.
Approach
A clean Paper 3 table needs:
- A clear heading for the independent variable (the thing the experimenter deliberately varies or contrasts). Here the contrast is between the two yeast preparations, so the heading identifies beads/B and free yeast/F.
- A clear heading for the dependent variable (the thing measured) — time to first appearance of colour change — with its unit, s, written in the heading and not repeated in the cells.
- All ten results, each to the nearest whole second (stop-clock readings should be rounded, not given to decimals of a second).
- The independent variable should sit to the left of the dependent variable, with the controlled time of sampling either in its own column or as a sub-row.
- The trend should be visible: time-to-colour-change falls as the sampling time increases, because the concentration of reducing sugar in the beaker is rising.
Step-by-Step Reasoning
- Identify the independent variable. The two preparations of yeast are the independent variable — beads in B vs free cells in F.
- Identify the dependent variable. Time to first appearance of colour change, measured in seconds, after adding Benedict's reagent and heating.
- Place headings correctly. The independent variable heading is written to the left; the dependent variable heading carries the unit /s.
- Enter ten results. Five for beads and five for free yeast, one for each minute of sampling. Because the candidate's actual stop-clock readings will differ, the values above are representative — they follow the expected trend but the examiner accepts any reasonable whole-second value.
- Check the trend. As the sampling time increases from 1 to 5 min, the time to first colour change should decrease for both preparations because more reducing sugar has accumulated. The mark scheme also allows the candidate to comment that free yeast generally produces a faster colour change than immobilised beads, because immobilisation limits the rate of substrate access to the enzyme.
- Check units and precision. The unit s is in the heading only; the body of the table contains bare numbers; all values are whole numbers.
Key Takeaways
- The Benedict's test can be used semi-quantitatively by timing the first appearance of colour change.
- Table conventions in CIE Paper 3: heading + unit in the column header; no units in the body; correct identification of independent and dependent variables; consistent precision (here, whole seconds).
- A falling time-to-colour-change implies a rising concentration of reducing sugar, which implies a higher rate of hydrolysis in the beaker.
Common Mistakes
- Writing the unit (s) in every cell of the table — this loses the convention mark.
- Recording times to one decimal place (e.g. 12.3 s) — stop-clock readings should be rounded to the nearest whole second.
- Putting the dependent variable to the left of the independent variable — the convention is the other way round.
- Omitting one of the ten results, or accidentally swapping which beaker a sample came from.
- Swapping the trend: writing that time to colour change increases with sampling time. This would be biologically wrong — more time = more sucrose hydrolysed = more reducing sugar = faster Benedict's reaction.
Things to Be Careful About
- The table must clearly separate beads from free yeast — use the labels B and F as given in the method.
- The whole-second rule applies to all results, including any that are recorded as 'more than 60' (write >60 in the cell, not 60.5 or 61).
- If two of the candidate's own results are anomalous, they should still be recorded — the data table is for raw data, not edited data.
Describe and compare the trends in your results, with reference to the data in (a)(i).
Answer
-
For the immobilised yeast beads (B), as the sampling time increased from 1 to 5 min, the time to first colour change decreased (e.g. from 35 s at 1 min to 15 s at 5 min).
-
For the free yeast cells (F), as the sampling time increased from 1 to 5 min, the time to first colour change also decreased (e.g. from 20 s at 1 min to 8 s at 5 min).
-
Comparing the two preparations: the time to first colour change was shorter for free yeast than for immobilised beads at every sampling time, so free yeast produced a higher concentration of reducing sugar and therefore appeared to hydrolyse sucrose faster than the immobilised beads.
As sampling time increased, the time to first colour change decreased for both preparations; the decrease was greater / the time was shorter for free yeast than for immobilised beads.
Background Concept
A shorter time to the first colour change in the Benedict's test indicates a higher concentration of reducing sugar in the sample being tested, because the Cu(II) → Cu(I) reduction reaches the visible threshold sooner. Therefore, if the time falls as the sampling time in the beaker increases, the beaker must contain progressively more reducing sugar — i.e. the hydrolysis of sucrose is proceeding over the five-minute period.
Understanding the Question
This is a describe and compare question worth 3 marks. The candidate must:
- describe the trend in the beads (B) data;
- describe the trend in the free yeast (F) data;
- compare the two data sets.
A data quote (a number from the table with its units) is also expected to support one of the descriptions, and earns an additional mark.
Approach
- Look at the beads (B) column. The time to colour change falls from minute 1 to minute 5 — state this clearly with a supporting number.
- Look at the free yeast (F) column. The same falling pattern is present — state it with a supporting number.
- Compare the two: which preparation produced a shorter time to colour change at each minute? Free yeast, because the enzyme has unrestricted access to the substrate, whereas in immobilised beads the substrate must first diffuse through the alginate gel.
Step-by-Step Reasoning
- For the beads, the representative values fall from 35 s → 15 s. A valid data quote is 'at 1 min the time was 35 s, falling to 15 s at 5 min'.
- For the free yeast, the values fall from 20 s → 8 s. A valid data quote is 'at 1 min the time was 20 s, falling to 8 s at 5 min'.
- Comparing: at every sampling time, the free yeast value is lower than the bead value, so free yeast is producing reducing sugar faster than the immobilised beads.
- The biological reason: immobilisation in alginate restricts the diffusion of substrate to the enzyme and/or product away from the enzyme, slowing the overall rate compared with free cells in suspension.
Key Takeaways
- 'Describe and compare' demands two separate descriptions (one per data set) plus an explicit comparison between them.
- A data quote is almost always required to reach full marks on a describe question.
- A shorter time to colour change = higher concentration of reducing sugar = higher rate of hydrolysis in the beaker up to that point.
Common Mistakes
- Describing the trend for only one preparation and not the other.
- Comparing the preparations without first describing each trend separately.
- Giving a data quote without its unit (e.g. 'it went from 35 to 15' without 's').
- Stating the comparison the wrong way round (e.g. 'beads were faster than free yeast' — immobilisation usually slows the apparent rate, so the time for beads should be longer, not shorter).
Things to Be Careful About
- Use the candidate's own values when writing the data quote, not the example values in this mark scheme — the examiner will read the candidate's table.
- The unit 's' must appear with every quoted number.
- 'Describe' only requires what the data show; 'explain' would require the biological mechanism (diffusion limitation in the alginate). Here the question only asks for describe and compare.
Answer
Repeat the experiment using boiled yeast cells (or boiled immobilised beads) in place of the live yeast, or replace the yeast suspension with an equal volume of distilled water.
This control shows that any colour change observed in the test samples is due to the active enzyme hydrolysing sucrose and not to some other factor (e.g. sucrose itself being a reducing sugar, or a reaction between Benedict's and the alginate).
Boiled yeast / boiled beads, or replace yeast with distilled water.
Background Concept
A control in a biological experiment is a sample that is treated identically to the test sample in every respect except the variable whose effect is being investigated. It establishes what would happen in the absence of the active treatment, so the experimenter can be confident that any observed effect is caused by that treatment.
In enzyme investigations, the standard negative control is to denature the enzyme (by boiling) so that its active site is destroyed and it can no longer catalyse the reaction. An alternative is to omit the enzyme entirely and replace it with an equal volume of water.
Understanding the Question
The question asks the candidate to suggest an appropriate control for the experiment. The mark scheme accepts either boiled enzyme / yeast or use water instead of yeast.
Approach
Ask: what am I trying to show? The experiment aims to show that the yeast enzymes hydrolyse sucrose. The control must therefore lack the active enzyme but be otherwise identical. Boiling the yeast (or its immobilised equivalent) destroys the enzyme by denaturing it; using water removes the enzyme altogether. Either is acceptable.
Step-by-Step Reasoning
- Take a fresh sample of the yeast suspension (or a fresh batch of immobilised beads).
- Boil it for several minutes to denature the enzymes.
- Otherwise treat it identically to the test sample — add it to sucrose, take samples at 1, 2, 3, 4 and 5 min, and test with Benedict's.
- Expected result: no colour change (or a very slow one) because the enzyme is denatured and cannot hydrolyse sucrose. This confirms that any colour change in the live-yeast samples is due to the active enzyme.
Key Takeaways
- A control in an enzyme experiment is usually the denatured enzyme (boiled) or the enzyme replaced by water.
- A control must differ from the test sample in only one variable — the presence of active enzyme.
Common Mistakes
- Suggesting a control that differs in more than one variable (e.g. different sucrose concentration and boiled yeast) — this confounds the result.
- Saying 'repeat without Benedict's' — this is not a control, it just confirms Benedict's is needed.
- Saying 'repeat at a different temperature' — that is a different investigation, not a control.
Things to Be Careful About
- The mark scheme accepts either phrasing — boiled yeast or use water instead of yeast. Do not write both; one clear answer is enough.
The samples taken from B were tested for the presence of reducing sugars after all 5 samples had been taken.
Suggest why each sample from F had to be tested for the presence of reducing sugars immediately.
Answer
The free yeast cells remain in the sample after it is removed from beaker F, and they continue to hydrolyse sucrose into reducing sugars while the sample is waiting to be tested. This would increase the concentration of reducing sugar in the sample before Benedict's is added, and the time to first colour change would no longer represent the concentration present in the beaker at the moment of sampling. Each sample must therefore be tested immediately so that the timing reflects the true concentration at that minute.
In contrast, the immobilised beads were physically separated from the solution by filtration before samples were taken from B, so the enzyme was no longer in contact with the substrate in the sample and the reaction stopped. The samples from B could therefore safely be tested together at the end.
Free yeast cells remain in the sample and continue to catalyse the reaction, so each sample must be tested immediately to give a true reading.
Background Concept
Enzymes do not stop working the moment a sample is removed from the reaction vessel — they continue to catalyse their reaction as long as they are in contact with their substrate and the conditions (pH, temperature) are suitable. In a free-cell preparation, the yeast cells are suspended in the sucrose solution, so every sample contains both the enzyme (inside the cells) and the substrate.
In the immobilised preparation, the cells are trapped inside alginate beads, and the beads have been filtered out of the solution before the samples are taken. The samples from B therefore contain only sucrose and any reducing sugar that has already diffused out of the beads; they do not contain active enzyme, so the reaction is effectively paused in each sample until Benedict's is added.
Understanding the Question
The question is a single-mark suggest why question. The mark scheme answer is: 'free yeast cells remain in the sample and continue to catalyse the reaction'. The candidate must identify that the cells stay in the sample and that the reaction therefore continues, distorting the result.
Approach
Identify the difference between the two preparations that affects the sample: in B the enzyme has been removed (with the beads); in F the enzyme is still in the sample. Therefore the reaction in the F samples keeps going until Benedict's reagent denatures the enzyme.
Step-by-Step Reasoning
- After 1 minute, of the suspension is taken from F into test-tube 1.
- The free yeast cells in that continue to hydrolyse sucrose during the seconds (or minutes) before the tube is placed in the boiling water-bath.
- By the time Benedict's is added and heated, the concentration of reducing sugar in the sample is higher than it was in the beaker at the 1-minute mark.
- The recorded time to first colour change will be shorter than it should be, giving a false impression of how much hydrolysis had occurred by 1 minute.
- By testing each sample immediately (as the method requires for F), the reaction is stopped as soon as possible and the timing reflects the true concentration at the moment of sampling.
Key Takeaways
- Free enzymes / cells continue to work in a removed sample; immobilised enzymes / cells that have been physically separated from the sample do not.
- Immediate testing (or denaturation) is required whenever the enzyme is still present in the sample, otherwise the reaction timing is biased.
- This is a key experimental-design principle in any kinetic study using a continuous catalyst.
Common Mistakes
- Saying 'so the Benedict's doesn't expire' or 'so the sample doesn't evaporate' — these are not the reason; the reason is the continued enzyme activity.
- Saying 'because free yeast is more active' — true, but it does not answer why each sample must be tested immediately.
- Failing to mention that the cells remain in the sample — this is the specific point the mark scheme requires.
Things to Be Careful About
- The mark-scheme answer is a single sentence; the candidate should keep the answer focused on the continued catalysis in the removed sample.
Suspensions and solutions were stirred throughout the investigation. Explain two ways in which stirring increased the accuracy of the results.
1 ______
2 ______
Answer
-
Stirring maintains an even concentration of yeast cells (or beads) throughout the suspension, so each sample removed from the beaker contains a representative number of cells / beads. Without stirring, cells or beads could settle at the bottom, making some samples more concentrated than others and biasing the result.
-
Stirring ensures the substrate (sucrose) and the product (reducing sugars) are evenly mixed in the solution, so the concentration of reducing sugar in each sample is the same as the average concentration in the beaker at that moment. Without stirring, locally higher or lower concentrations could be sampled, again biasing the result.
- Maintains an even concentration of yeast cells / beads so each sample is representative. 2. Ensures the substrate and product are evenly mixed so each sample reflects the true mean concentration.
Background Concept
In any reaction where the reactant and product are in different physical states or are unevenly distributed, the concentration at the point of sampling may not match the average concentration in the bulk. This is especially true when one component is denser than the solution and tends to settle under gravity (immobilised beads), or when an enzyme reaction creates localised pockets of product around each cell.
Stirring is the standard laboratory technique for keeping a heterogeneous mixture homogeneous so that any small sample removed is genuinely representative of the whole.
Understanding the Question
This is a two-mark explain question asking for two ways in which stirring increased the accuracy of the results. The mark scheme lists three acceptable points (even concentration of cells, even mixing of substrate, even distribution of reducing sugars); the candidate needs any two.
Approach
Think about what could be uneven in each beaker:
- The yeast cells (or beads) could settle on the bottom, so a sample from the top would contain fewer cells than a sample from the bottom.
- Sucrose could be locally depleted around each cell, and reducing sugar could be locally enriched around each cell.
- Stirring counteracts both effects by constantly redistributing the components.
Step-by-Step Reasoning
- Point 1 (cells / beads): without stirring, immobilised beads in B and free yeast cells in F would settle to the bottom. A sample taken from the top would then contain fewer cells / beads than the average, so the measured rate of hydrolysis would be artificially low. Stirring keeps the cells/beads evenly suspended so each sample is representative.
- Point 2 (substrate): yeast cells consume sucrose locally. Without stirring, the sucrose concentration immediately around each cell would fall, slowing the reaction. Stirring replenishes sucrose at the cell surface by mixing.
- Point 3 (product): reducing sugars are produced by the cells and could accumulate locally. Without stirring, the concentration measured in a sample might depend on whether the sample was taken near a cell or far from one. Stirring evens out the product distribution.
Key Takeaways
- Stirring is a standardising technique that keeps a reaction mixture homogeneous.
- It increases accuracy (closeness to the true mean) by ensuring each sample is representative of the whole beaker.
- It is not the same as increasing rate; in many reactions stirring has little effect on the overall rate, but it does reduce sampling error.
Common Mistakes
- Saying 'stirring speeds up the reaction' — this is a different effect and not what the question asks.
- Repeating the same point twice (e.g. 'even concentration of cells' and 'even concentration of yeast') — the mark scheme wants two distinct points.
- Failing to link stirring to the accuracy of the result — the candidate must say why the measurement is more accurate, not just that stirring is 'good practice'.
Things to Be Careful About
- The mark scheme wording is 'even concentration', 'even mixing', 'even distribution' — the candidate should use one of these phrases to be sure of the credit.
State one possible source of error when determining the dependent variable for the ‘free’ yeast cells. Suggest one improvement to the procedure that would increase the accuracy of measuring the dependent variable.
error ______
improvement ______
Answer
Error: The time to first colour change for the free yeast cells is difficult to judge accurately because the candidate has to take the sample, add Benedict's and place the tube in the boiling water-bath while simultaneously watching for the first appearance of a colour change. The reaction starts as soon as the yeast is added to the sucrose, and the time available to start the stop-clock and judge the colour change is very short, so the reading is subjective and inconsistent.
Improvement: Run each time point in a separate small beaker (or test-tube) of sucrose + yeast, all started at the same moment but stopped at staggered intervals (e.g. by adding Benedict's and heating immediately to denature the enzyme). The colour change for each time point can then be timed in isolation, without having to take a sample while already timing.
Error: judging the first colour change is difficult because the sample is being taken and timed simultaneously. Improvement: run each time point in a separate beaker and denature the enzyme (with Benedict's / heat) immediately after sampling, so each colour change is timed in isolation.
Background Concept
In any kinetic experiment the dependent variable must be measured in a way that reflects only the quantity of interest. If the measurement is confounded by another simultaneous action (e.g. removing a sample, starting a stop-clock, watching for a colour change all at once), the result is biased and its repeatability is poor. The standard remedy is to separate the steps in time so that each one can be done carefully and unambiguously.
Understanding the Question
This is a two-mark state one source of error and suggest one improvement question. The mark scheme answer is:
- Error: judging the time to first colour change while taking the sample in the sucrose / S.
- Improvement: do each time in separate beakers one after each other, or stop the enzyme after taking each sample.
The candidate needs both an error and its paired improvement.
Approach
Identify the most awkward step in the free-yeast protocol: at each minute, the candidate must (a) draw up from beaker F, (b) deliver it to a test-tube of Benedict's, (c) put the tube in the boiling water-bath, and (d) start timing to the first colour change — all within a few seconds. It is very hard to perform (a)–(c) and watch (d) carefully. The error is the difficulty of judging the first colour change because these actions are happening at the same time.
The improvement is to decouple the sampling and the timing by using a separate vessel for each time point and immediately stopping the enzyme in each (by adding Benedict's, which contains a strong alkali and denatures the enzyme on heating).
Step-by-Step Reasoning
- Error explained: in the free-yeast protocol, the reaction in beaker F is still proceeding while the candidate is preparing the test-tube. The 'time to first colour change' is therefore a compound measurement that includes the time taken to draw and deliver the sample. It is also subjective — the candidate has to decide what counts as the 'first' colour change while their hands are busy.
- Improvement explained: if each time point has its own beaker (or large test-tube) of sucrose + yeast, all started at the same moment, then at each minute the candidate can take the sample for that beaker and immediately add Benedict's and heat. The enzyme is denatured the moment Benedict's is added, so the reaction is paused; the time to first colour change can then be measured cleanly in a separate step with no other actions competing for attention.
- Why this is an improvement: it removes the simultaneity between sampling and timing, so the recorded time is more precise and more reproducible between repeats.
Key Takeaways
- Sources of error in Paper 3 are best identified by asking: what am I doing at the same time as the measurement?
- Improvements usually separate or automate the conflicting actions, or stop the reaction at a defined point so the measurement is taken under controlled conditions.
- The error and the improvement must be paired — a vague 'be more careful' is not credited.
Common Mistakes
- Naming an error that is not specific to the free-yeast protocol (e.g. 'parallax error' or 'the stop-clock might be inaccurate' — too generic to score).
- Suggesting an improvement that does not address the error (e.g. 'use a colorimeter' would be a different change of method, not an improvement of the same protocol).
- Suggesting the improvement without pairing it to a specific error.
- Writing 'human error' — this is never credited as a source of error in CIE marking.
Things to Be Careful About
- The error and improvement are worth one mark each, so the candidate must give both to score both.
- The improvement should be practically possible in the time and equipment available; an answer like 'use a spectrophotometer' is theoretically valid but is not the standard Paper 3 answer.
A scientist carried out an investigation to determine the effect of pH on the activity of immobilised catalase enzyme and ‘free’ catalase enzyme.
All other variables were kept constant.
The results are shown in Table 1.2.
Table 1.2
| pH | activity of catalase / arbitrary units (au) | |
|---|---|---|
| immobilised | free | |
| 5 | 68 | 50 |
| 6 | 88 | 62 |
| 7 | 99 | 96 |
| 8 | 98 | 65 |
| 9 | 94 | 48 |
Plot a line graph of the data in Table 1.2 on the grid in Fig. 1.4.
Use a sharp pencil.
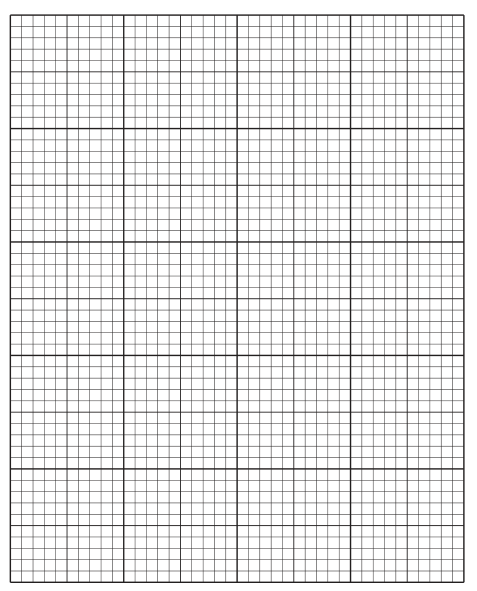
Answer
The completed line graph on the grid in Fig. 1.4 should show:
- x-axis labelled pH, with a linear scale running from 5 to 9, marked at every whole pH unit (each on the grid).
- y-axis labelled activity of catalase / arbitrary units (au), with a linear scale running from 0 to 100, marked at every 20 au (each on the grid).
- Ten plotted points (five for each line) marked with small dots inside circles or with neat crosses, each within of its true position.
- Two thin lines, each passing through all five of its points (a line of best fit is not appropriate here because each data point is a measured mean). The lines must be identified with a key showing which is immobilised and which is free.
Data to plot:
| pH | immobilised / au | free / au |
|---|---|---|
| 5 | 68 | 50 |
| 6 | 88 | 62 |
| 7 | 99 | 96 |
| 8 | 98 | 65 |
| 9 | 94 | 48 |
A line graph of pH (x-axis) against activity of catalase / au (y-axis) with two labelled lines, one for immobilised catalase and one for free catalase, plotted from the data in Table 1.2.
Background Concept
A line graph is the correct choice when both variables are continuous (numerical) and the experimenter wants to show how the dependent variable changes as the independent variable is varied. Here the independent variable (pH) is continuous, and the dependent variable (enzyme activity in arbitrary units) is also continuous, so a line graph is appropriate. (A bar chart would be used for a categorical independent variable, which is not the case here.)
When two data sets are plotted on the same axes, each line must be clearly identifiable — usually by a key in the corner of the graph, sometimes combined with different point markers or line styles.
Understanding the Question
Part (b)(i) is a four-mark plot a line graph task. The marks are awarded for:
- Correct axes and labels, with lines correctly identified in a key.
- Suitable scales (at least 1.0 to 2 cm per division on each axis) and at least every 2 cm labelled.
- Correct plotting of all ten points using small dots in circles or neat crosses.
- Plots joined with a thin line passing through all points of each data set.
The candidate is given the blank grid in Fig. 1.4 and the data in Table 1.2.
Approach
- Decide which variable goes on which axis. pH is the independent variable → x-axis. Activity of catalase is the dependent variable → y-axis.
- Look at the range of pH values: 5, 6, 7, 8, 9 — a range of 4 units. A scale of unit (or unit) fills the grid comfortably.
- Look at the range of activity values: minimum 48, maximum 99, so a scale of to , with , fills the grid comfortably.
- Plot each pair of points (immobilised and free) for each pH value, using a small dot inside a circle or a neat cross.
- Join the immobilised points with a thin straight line; join the free points with a thin straight line.
- Add a key identifying the two lines.
Step-by-Step Reasoning
- x-axis: pH from 5 to 9. Use the major gridlines (every 2 cm) at 5, 6, 7, 8, 9, with minor gridlines (every 1 cm or 0.5 cm) for accurate plotting.
- y-axis: activity from 0 to 100 au. Use the major gridlines at 0, 20, 40, 60, 80, 100, with minor gridlines for accurate plotting.
- Plotting the immobilised line: (5, 68), (6, 88), (7, 99), (8, 98), (9, 94). This line rises steeply from pH 5 to pH 7, peaks at pH 7, and falls only slightly at pH 8 and 9 — a fairly flat-topped curve.
- Plotting the free line: (5, 50), (6, 62), (7, 96), (8, 65), (9, 48). This line rises to a sharp peak at pH 7 and falls steeply on either side — a clearly bell-shaped curve.
- Key: place in a clear corner of the graph, e.g. top right, identifying the two lines by name (immobilised and free).
- Lines: draw each line as a series of thin straight segments connecting the plotted points; do not use a 'best-fit' curve because each point is a measured mean.
Key Takeaways
- Line graphs are for two continuous variables; bar charts are for a categorical independent variable.
- Axes must always be labelled with both the quantity and the unit.
- Scales should use at least half the grid and should not be awkward (e.g. not ).
- Two data sets on the same axes need a key.
- Lines should be thin and pass through all the plotted points (no extrapolation, no best-fit unless asked).
Common Mistakes
- Plotting pH on the y-axis and activity on the x-axis — the independent variable always goes on the x-axis.
- Omitting the unit on the y-axis label, or writing 'au' without saying what it stands for.
- Using awkward scales (e.g. 0 to 90 instead of 0 to 100) or scales that are too small (e.g. 0 to 200, leaving all the data squashed in the bottom third).
- Plotting points as large blobs or as fuzzy crosses — the mark scheme requires small dots in circles or neat crosses.
- Drawing a single 'best-fit' curve through the immobilised data without joining the points — the mark scheme requires the line to pass through (or very close to) every point.
- Forgetting the key, or writing the key but not linking it to the lines.
Things to Be Careful About
- Use a sharp pencil (as the question states) so the lines and points can be erased cleanly if a mistake is made.
- Check the position of each plotted point by reading both coordinates from the axes before drawing the line.
- The two lines should not be drawn so close together that they cannot be distinguished; the free line dips much more sharply on either side of pH 7, so the two are visually distinct in shape even where they cross.
State two conclusions about how pH affects the activity of immobilised catalase compared to ‘free’ catalase.
1 ______
2 ______
Answer
-
Both immobilised and free catalase have the same optimum pH of 7 (both lines reach their highest activity at pH 7: 99 au for immobilised and 96 au for free).
-
The immobilised catalase has a higher activity than the free catalase over a wider range of pH (e.g. at pH 5 the immobilised activity is 68 au compared with 50 au for free, and at pH 9 the immobilised activity is 94 au compared with 48 au for free). Immobilisation therefore makes the enzyme more tolerant of pH changes away from the optimum.
- Both have the same optimum pH of 7. 2. Immobilised catalase has a higher activity than free catalase over a wider range of pH.
Background Concept
Every enzyme has an optimum pH at which its active site has the correct shape to bind substrate most effectively. Away from this optimum, the ionisation of amino-acid side chains in the active site changes, the active-site geometry is distorted, and the rate of reaction falls. Immobilisation of an enzyme — trapping it in a gel or on a surface — can stabilise the active site and make the enzyme less sensitive to changes in pH, so its activity-versus-pH curve is often broader than that of the free enzyme, even though the optimum pH is usually unchanged.
Understanding the Question
This is a two-mark state two conclusions question. The mark scheme accepts:
- Both have the same optimum of pH 7.
- Immobilised catalase has a higher activity over a wider range of pH.
The candidate must give two distinct conclusions that compare the two lines on the graph.
Approach
Read the two lines and identify:
- the position of the peak (optimum pH) for each line;
- the shape of each line (broad vs narrow);
- the relative heights of the two lines away from the optimum.
The peak of both lines is at pH 7 (immobilised 99 au, free 96 au). Away from pH 7, the free line falls much more steeply than the immobilised line.
Step-by-Step Reasoning
- Conclusion 1: both lines reach their highest point at pH 7, so both forms of catalase have the same optimum pH of 7. The actual peak activities are similar (99 au vs 96 au), so the optimum is essentially the same in both cases.
- Conclusion 2: at pH 5 the immobilised catalase has 68 au of activity compared with 50 au for the free catalase, and at pH 9 the immobilised catalase has 94 au compared with only 48 au for the free. The immobilised line is therefore higher than the free line at every pH away from 7, and the immobilised line is flatter in shape. This means the immobilised enzyme is active over a wider range of pH than the free enzyme.
- Biological interpretation: immobilisation in alginate stabilises the tertiary structure of the enzyme, making its active site less sensitive to pH-induced denaturation. The free enzyme, by contrast, is more vulnerable to pH changes and loses activity rapidly away from the optimum.
Key Takeaways
- The optimum pH of an enzyme is read from the peak of its activity-versus-pH curve.
- Immobilisation often preserves activity over a wider pH range without shifting the optimum.
- Comparing two curves on the same axes: identify (a) the position of the peak, (b) the height of the peak, (c) the width of the peak, and (d) any systematic offset between the curves.
Common Mistakes
- Saying the two enzymes have different optima (e.g. 'immobilised catalase has an optimum of pH 7 and free catalase has an optimum of pH 8') — both peaks are at pH 7.
- Saying the immobilised catalase is more active overall without specifying over what range — the peak activities are similar; the difference is in the width of the active pH range.
- Quoting a single data point as evidence for the width comparison without referring to the shape of the curve as a whole.
Things to Be Careful About
- The candidate should quote at least one pair of values to support the second conclusion (e.g. pH 5: 68 vs 50 au, or pH 9: 94 vs 48 au).
- Both conclusions must be distinct; the candidate must not give two versions of the same point.
N1 is a slide of a stained transverse section through a plant organ.
Draw a large plan diagram of the whole section on N1. Use a sharp pencil.
Use one ruled label line and label to identify the phloem.
Answer
Draw a plan diagram of the entire transverse section on N1.
Conventions to apply:
- Use most of the available space (the section fills the drawing).
- Draw the whole section only — no individual cells anywhere.
- Draw the epidermis as two lines close together all the way around the outside.
- Draw the correct number of vascular bundles arranged in a ring near the epidermis (N1 is a dicot-style stem).
- Leave the centre of the section as the pith (no cells drawn).
- Add one ruled label line that ends on the phloem within a vascular bundle; write the label phloem.
See working
Background Concept
A plan diagram is a low-power, simplified outline of a specimen that records the positions and relative sizes of tissues but not the individual cells within them. It is drawn using a sharp pencil, with continuous, thin lines and no shading. The convention is to use a single ruled label line that ends exactly on the structure being labelled, and to keep the number of labels small so the drawing is not cluttered.
For a transverse section of a plant organ such as a stem, a plan diagram typically shows the epidermis on the outside, the cortex beneath it, a ring of vascular bundles (in a dicot stem) or scattered vascular bundles (in a monocot stem), and a central pith. The N1 slide is a dicot stem: the mark scheme confirms the vascular bundles are in a ring, close to the epidermis. Fig. 2.1, by contrast, is a monocot stem with vascular bundles scattered throughout the ground tissue.
The key conventions the mark scheme tests on a plan diagram are: use of space, drawing the whole section, no cells drawn, the epidermis as two close lines, the correct number and arrangement of vascular bundles, and a correctly placed label.
Understanding the Question
You are asked to produce a plan diagram of the whole transverse section on slide N1. The drawing must occupy most of the available space on the page, capture the outline of the section and the position of every tissue layer (epidermis, cortex, ring of vascular bundles, pith), and be labelled with a single ruled line to identify the phloem.
Approach
- First scan the section on N1 at low power to count the vascular bundles and to see how they are arranged.
- Sketch a large circle that fills the page, with two close lines for the epidermis on the outside.
- Plot the position of each vascular bundle in a ring just inside the epidermis; shade or hatch these gently (or leave as a small closed outline) — never draw individual cells inside them.
- Reserve the central area for the pith.
- Draw one neat ruled line from the phloem region of one vascular bundle out to the margin and write "phloem".
Step-by-Step Reasoning
- Use most of the available space — the mark scheme explicitly tests this. A small central drawing loses the first marking point before anything else is considered.
- Draw the whole section, not part of it — a partial section is a common error and costs the "whole section" mark.
- No individual cells — the defining feature of a plan diagram. The drawing must not contain any cell walls inside the cortex, pith, or vascular bundles. This is what distinguishes a plan diagram from a high-power cell drawing.
- Epidermis as two lines close together — represents the cuticle and the epidermal cell layer as a single boundary drawn with two parallel lines, not as a thick line.
- Correct number of vascular bundles — count them on the slide. For N1 (a dicot stem) this will be a specific, countable number. Drawing too few or too many loses the mark even if the rest of the diagram is correct.
- One ruled label line to the phloem with the label "phloem" — the line must be straight, end exactly on the phloem (the outer part of a vascular bundle), and bear only the word "phloem".
Key Takeaways
- A plan diagram is about tissue distribution, not cells.
- Conventions (no cells, double-line epidermis, single ruled label, sharp pencil) are themselves part of the marks.
- Always count structures (vascular bundles, layers) before you start drawing.
Common Mistakes
- Drawing individual cortex or pith cells inside the plan diagram — this is a high-power drawing mistake made on a plan diagram and is rejected.
- Labelling several structures when only one label is asked for.
- Drawing a small diagram in the centre of the page instead of using most of the space.
- Drawing the epidermis as a single thick line instead of two close lines.
- Drawing a ring of vascular bundles that does not match the actual number on the slide.
Things to Be Careful About
- The label line must end on the phloem, not on the xylem or the whole bundle.
- Use a sharp HB pencil so lines are crisp; no sketching in pen and no shading.
- The vascular bundles in a dicot stem are arranged in a single ring, not two rings, and not scattered.
Observe the cortex on the section of the plant organ on N1. The cortex is the layer beneath the epidermis.
Select a group of four adjacent cortex cells.
Each cortex cell must touch at least two of the other cortex cells.
- Make a large drawing of this group of four cortex cells.
- Use one ruled label line and label to identify the cell wall of one cortex cell.
Answer
Draw a high-power drawing of four adjacent cortex cells.
Conventions to apply:
- Lines must be continuous, thin and sharp; no shading anywhere.
- Draw only four cortex cells, each one touching at least two of the others (so they form a cluster, not a row).
- Draw the cell wall as two lines close together wherever a wall occurs.
- Use the correct shapes for cortex cells (rounded / polygonal, with the proportions seen on the slide).
- Add one ruled label line that ends on the cell wall of one cell; write the label cell wall.
See working
Background Concept
A high-power cell drawing (sometimes called a detail drawing) is the opposite of a plan diagram: it shows individual cells, drawn as accurately as possible from what is visible under the microscope. Conventions are strict because the marks reward skill in observation and in applying the rules consistently.
For plant cells the cell wall is a defining structure and must always be drawn as two lines close together — a single thick line is rejected because a cell wall in section is a real, finite-thickness structure. The drawing must show only what is observable (no invented contents), use a sharp pencil, draw with continuous thin lines (no sketchy or broken lines), and have no shading.
The cortex in a dicot stem is the layer of parenchyma cells between the epidermis and the ring of vascular bundles. Cortex cells are typically rounded to polygonal and fairly large, with thin primary cell walls.
Understanding the Question
You are asked to draw a group of exactly four cortex cells, each one touching at least two of the others. You then have to label the cell wall of one of them with a single ruled label line. This is testing your ability to follow cell-drawing conventions and to extract the right cells from the slide.
Approach
- Switch to a higher-power objective on N1 and find an area of cortex where the cells are large, clear and have visible walls.
- Identify a cluster of at least four cells in which each cell shares a wall with at least two of the others (a tight cluster, not a line of four).
- Sketch a large drawing of these four cells; do not draw any other cells.
- Double-line every cell wall, draw with a sharp pencil, do not shade.
- Add one straight ruled label line ending on a cell wall; label it "cell wall".
Step-by-Step Reasoning
- Lines continuous, thin and sharp; no shading — the basic mark of a competent biological drawing. Broken or sketchy lines, heavy lines, or any shading lose the first marking point.
- Only four cells drawn, each touching at least two others — drawing five or more cells loses this point; drawing four in a row where only end cells touch one neighbour loses it because each cell must touch at least two others.
- Cell wall as two lines close together — applies to every shared wall in the drawing. A common error is to draw the wall as a single line, or as two lines that are spaced too far apart to read as a wall.
- Correct shapes of the cells — cortex cells are roughly isodiametric, rounded to polygonal, and of similar size. They should not be drawn as rectangles, as long thin cells, or in wildly different sizes.
- One ruled label line and label "cell wall" — line straight, ending exactly on the wall, with the word "cell wall". Only one label is asked for, so additional labels are not required and a cluttered drawing is harder to credit.
Key Takeaways
- A cell drawing and a plan diagram are different skills — the cell drawing must show cells and must show walls as double lines.
- "Each cell touches at least two others" is a specific geometric requirement; check it before finishing the drawing.
- Never shade plant cells in a line drawing.
Common Mistakes
- Drawing the cell wall as a single line (a thick line does not represent the wall — it represents no wall at all).
- Drawing five or more cells instead of exactly four.
- Putting the four cells in a line so only the middle two cells touch two others.
- Shading the cells to indicate contents — the convention is unshaded line drawings.
- Adding several labels when only one is asked for.
Things to Be Careful About
- The cell wall in section is genuinely a thin structure, but the convention is to draw it as two close lines (i.e. close enough to read as a wall, not so close that they merge into one).
- Make sure the four cells are cortex cells — they should be in the parenchyma layer just inside the epidermis, not the more elongated pith cells or the cells of a vascular bundle.
- Use a sharp HB pencil; the lines should be fine enough to make the four-cell cluster look clean at the size required.
Fig. 2.1 is a photomicrograph of a stained transverse section of the same organ from a different plant to N1.
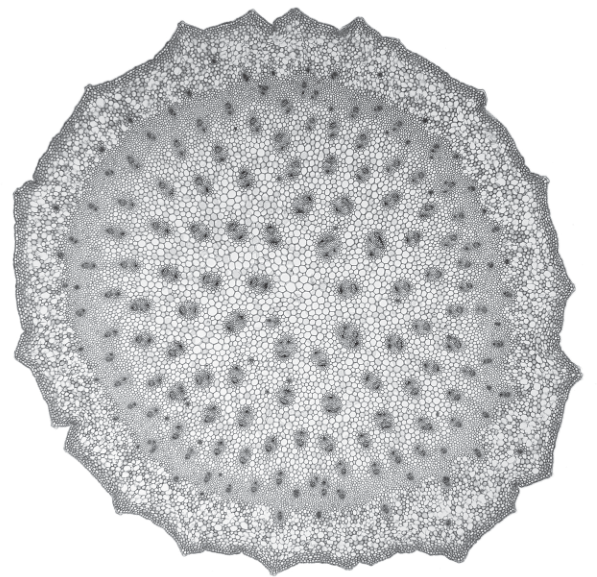
Identify three observable differences, other than colour, between the section on N1 and the section in Fig. 2.1.
Record these three observable differences in Table 2.1.
Table 2.1
| feature | N1 | Fig. 2.1 |
|---|---|---|
| 1 | ||
| 2 | ||
| 3 |
Answer
Table 2.1 completed with three observable differences (other than colour):
| feature | N1 | Fig. 2.1 |
|---|---|---|
| 1 | vascular bundles arranged in a ring, near the epidermis | vascular bundles scattered |
| 2 | fewer vascular bundles | more vascular bundles |
| 3 | vascular bundles all the same size | vascular bundles of different sizes |
(Any three observable, non-colour differences from the mark-scheme list — arrangement, number, size of vascular bundles, or width of epidermis — are accepted. Alternative wording is fine as long as the comparison is observable in the two images.)
Three observable differences: (1) arrangement of vascular bundles (ring near epidermis in N1 vs scattered in Fig. 2.1); (2) number of vascular bundles (fewer in N1 vs more in Fig. 2.1); (3) size of vascular bundles (same size in N1 vs different sizes in Fig. 2.1).
Background Concept
Two plant organs from different species — or even different individuals of the same species — can look very different under the microscope. The mark scheme for this kind of question restricts you to observable differences, i.e. features you can actually see in the two images, and explicitly excludes colour. The aim is to test observational skill, not biological inference ("monocot vs dicot" is a label, not a difference you can see directly).
N1 is a dicot stem (vascular bundles in a ring near the epidermis, all roughly the same size). Fig. 2.1 is a monocot stem (vascular bundles scattered throughout the ground tissue, of varying sizes, with a thicker epidermis and a more lobed/scalloped outline).
Understanding the Question
You are given Table 2.1 with three rows. You must fill the N1 column and the Fig. 2.1 column for each row with one observable, non-colour difference. The mark scheme accepts differences drawn from a specific short list (arrangement, number, size of vascular bundles, or width of epidermis), but the wording can be your own as long as the comparison is direct and observable.
Approach
- Look at N1 and at Fig. 2.1 side by side.
- For each, record what you actually see for: arrangement of vascular tissue, number of vascular bundles, sizes of the vascular bundles, and width of the epidermis.
- Pick three of these that genuinely differ between the two images and that you can defend as observable.
- Write each comparison as a pair — one observation for N1 and one for Fig. 2.1 — never as a single statement about one image.
Step-by-Step Reasoning
- Only observable differences — the mark scheme rejects any inference that is not directly visible. Saying "N1 is a dicot" is a conclusion, not an observation; saying "vascular bundles are in a ring in N1" is observable and is credited.
- Three differences, one per row — there is no partial credit for a difference that is only half correct (e.g. only stating what is seen in one image).
- Mark-scheme list of differences — any three of:
- arrangement of vascular tissue: in a ring, near the epidermis (N1) vs scattered (Fig. 2.1);
- number of vascular bundles: fewer (N1) vs more (Fig. 2.1);
- size of vascular bundles: same size (N1) vs different sizes (Fig. 2.1);
- width of epidermis: thinner (N1) vs wider (Fig. 2.1).
- Exclude colour — the question explicitly rules out staining or colour differences. Don't waste a row on staining.
Key Takeaways
- "Observable" means you can see it directly — not a name, not a cause, not a function.
- Each difference must be a paired comparison (N1 vs Fig. 2.1), not a single description.
- Three correct, independent observations are worth more than one beautifully explained but unsupported claim.
Common Mistakes
- Writing only what is seen in one image ("vascular bundles scattered" with nothing for N1).
- Listing biological conclusions ("monocot", "dicot", "no secondary growth") instead of visible features — these are rejected because they are not observable.
- Describing colour or staining differences when the question explicitly excludes colour.
- Repeating the same feature in two rows (e.g. "bundles in a ring" and "bundles arranged in a circle") — this only scores once.
Things to Be Careful About
- Make sure the description is something you can verify by eye on the images. "Vascular bundles of different sizes" is observable; "monocotyledonous stem" is not.
- Use neutral language for measurements ("thinner / wider") rather than absolute thicknesses you cannot read off the images.
- The Table 2.1 format expects a feature in the left column and a comparison in the two right columns; do not rewrite the question in your own table layout.
Fig. 2.2 is the same photomicrograph as that shown in Fig. 2.1.
A black dot has been placed at the centre of the section.
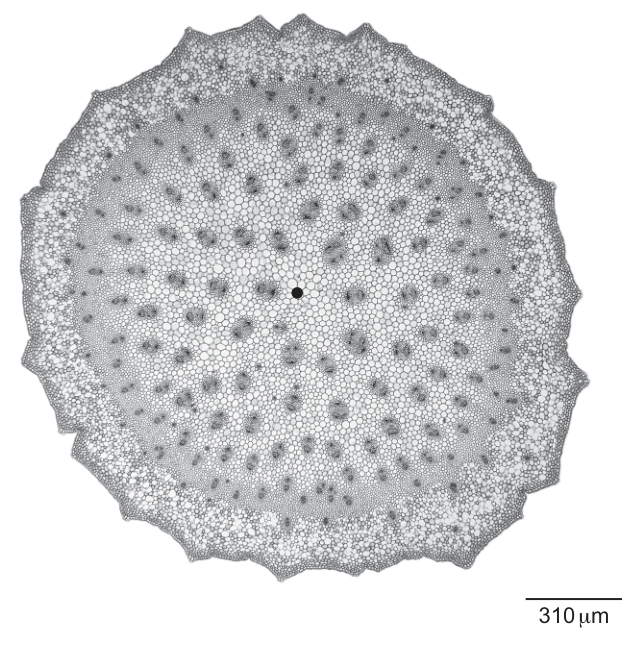
Determine the mean diameter of the section in Fig. 2.2.
Show your working and include units.
mean diameter = ______
Working
Draw at least three diameter lines through the section, each one passing through the central black dot.
Measure each diameter on the printed image (in mm):
- diameter 1 =
- diameter 2 =
- diameter 3 =
Calculate the mean:
Answer
mean diameter = (representative example; the actual value depends on the student's measurements of the printed image)
mean diameter = 540 mm (representative example; the value depends on the printed image and the student's measurements)
Background Concept
When you measure the size of a roughly circular specimen in a printed photomicrograph, a single diameter reading is unreliable because the printed image may not be a perfect circle and your line may miss the true maximum extent. The standard practical-skill technique is to take several diameter measurements through a fixed reference point (here, the central black dot) and average them. The mean is then used in any subsequent calculation.
A diameter in this context is any straight line through the central black dot that meets the outer boundary of the section. A single ruler placement will only give one such line; you need at least three (ideally at different angles) to characterise a possibly irregular section.
Understanding the Question
Fig. 2.2 is Fig. 2.1 with a black dot added at the centre and a scale bar marked . The black dot is the reference point through which all diameter lines must be drawn. You must measure the mean diameter of the section in the printed image, give it with a unit, and (in the next part) convert it to an actual size using the scale bar.
Approach
- Use a sharp pencil to draw three (or more) straight lines through the central black dot, each one ending on the outer edge of the section.
- Measure each line on the printed image with a ruler, in millimetres, to a sensible precision (typically the nearest mm).
- Calculate the arithmetic mean of the measurements.
- Write the mean with the unit .
Step-by-Step Reasoning
- At least three diameter lines — the mark scheme makes this a marking point. A single measurement, however accurate, scores only the units mark.
- Each line through the central dot — the dot is the reference; any line not through it will be a chord, not a diameter, and will systematically underestimate the size.
- Measurements in with units — the unit is part of the mark. A bare number, or a number in cm, loses the units mark even if the arithmetic is right.
- Mean calculation — sum the diameters and divide by the number of lines. Round sensibly (to the nearest mm if the measurements are to the nearest mm).
Key Takeaways
- A mean diameter is more reliable than a single reading for an irregular section.
- Always measure through the marked centre to get a true diameter.
- Units must be written; they are an explicit marking point in Paper 3.
Common Mistakes
- Measuring only one or two diameters — the mark scheme explicitly requires at least three.
- Drawing chord lines that do not pass through the central dot.
- Omitting the unit.
- Reporting a mean to unrealistic precision (e.g. to the nearest when the ruler is read to the nearest mm).
Things to Be Careful About
- The three (or more) diameters should be drawn at clearly different angles so they sample different parts of the outline.
- Use the same unit consistently across all three measurements before averaging.
Use the scale bar to calculate the mean actual diameter of the section in Fig. 2.2.
Show your working and include units.
mean actual diameter = ______
Working
Measure the scale bar on the printed image:
- scale bar length on image =
- scale bar actual value =
Convert the mean image diameter to an actual size using the scale bar:
Answer
mean actual diameter = (≈ or ) — representative example; the actual value depends on the student's measurements
mean actual diameter ≈ 2090 µm (≈ 2.09 mm) — representative example; the actual value depends on the student's measurements
Background Concept
A scale bar is a small line printed on a micrograph whose real-world length is given (here, ). It lets you convert any other length measured on the same image into an actual size. The conversion uses simple proportion:
Rearranged, the actual size of any feature is
This is the same logic as a unit-conversion factor, with the scale bar defining the conversion between printed millimetres and real micrometres.
Understanding the Question
You have already calculated the mean image diameter of the section in (c)(i). The scale bar of is printed on Fig. 2.2. You must measure the scale bar on the printed image, then use it to convert the mean image diameter into a real-world (actual) diameter of the section, showing the working and quoting the unit.
Approach
- Measure the scale bar (the short horizontal line at the bottom right of Fig. 2.2) with a ruler, in , to the nearest mm.
- Apply the proportion: actual size = (image measurement / scale bar measurement) × scale bar value.
- Give the answer in (or convert to if you prefer).
Step-by-Step Reasoning
-
Measure the scale bar on the image, with units — the mark scheme explicitly tests that the unit is written. Typical readings fall in the range for a scale bar of this size, depending on the print scale; mark schemes always accept a range.
-
Substitute into the proportion — write the working as
The units in image measurement and scale bar measurement cancel, leaving .
-
Calculate and quote units — keep the answer to a sensible number of significant figures. With the scale bar measured to the nearest mm and the mean diameter to the nearest mm, two or three significant figures is appropriate.
-
Convert if you wish — is the same length as . Either is acceptable; pick one and be consistent.
Key Takeaways
- The scale bar gives a direct conversion between image length and actual length — no microscope calibration is needed.
- Always show the substitution; the proportion itself is a marking point.
- The answer must carry its unit; a number on its own is incomplete.
Common Mistakes
- Dividing the scale bar value by the image measurement instead of the other way around (inverts the answer).
- Forgetting the unit on the scale bar measurement, or on the final answer.
- Quoting an absurd number of significant figures (e.g. ) when the inputs are only to the nearest mm.
- Using the magnification from (c)(iii) before it has been calculated — the order in this question is deliberately (i) → (ii) → (iii).
Things to Be Careful About
- The scale bar measurement is on the printed image, in ; do not confuse it with the actual scale bar value of .
- If you measure in , convert to before dividing so the units cancel correctly.
- Keep the calculation to one or two lines; the mark scheme gives the marks for the substitution, not the layout.
Use the mean actual diameter calculated in (c)(ii) to calculate the magnification of Fig. 2.2.
Show your working and give your answer to the nearest whole number.
magnification = ______
Working
Use the magnification formula:
Take the mean diameter measured on the image from (c)(i) and the mean actual diameter from (c)(ii). Convert to the same unit before dividing (e.g. both in ):
Round to the nearest whole number:
Answer
magnification = (representative example; the exact value depends on the student's measurements)
magnification = × 258 (representative example; the exact value depends on the student's measurements)
Background Concept
Magnification is defined as the ratio of the size of an image to the size of the real object:
The image size and the actual size must be in the same unit before you divide — the unit cancels and the magnification is a dimensionless number, conventionally written with a leading "" (e.g. ).
When you already know the image size of a feature (here, the mean diameter on the printed photomicrograph) and have used a scale bar to find its actual size in (c)(ii), the magnification of the printed image is the ratio of those two numbers.
Understanding the Question
You have the mean diameter measured on the image (from c(i)) and the mean actual diameter (from c(ii)). You must divide the image size by the actual size and round to the nearest whole number. The answer is the magnification at which Fig. 2.2 has been printed.
Approach
- Make sure the image size and the actual size are in the same unit. Either convert the image size from to by multiplying by , or convert the actual size from to by dividing by .
- Divide image size by actual size.
- Round to the nearest whole number and write the answer as .
Step-by-Step Reasoning
-
State the formula explicitly — the mark scheme gives a marking point for showing image size divided by actual size. Writing the formula, then substituting, then evaluating, is the safest way to earn the mark.
-
Match the units — image size and actual size (or and — convert to a common unit first).
-
Evaluate —
-
Round to the nearest whole number — rounds to .
-
Write with the correct format — , with the multiplication sign (or the word "times") before the number; a bare is a length, not a magnification.
Key Takeaways
- Magnification is image size ÷ actual size; the inverse ratio is the "actual size" calculation in (c)(ii).
- The two quantities must share a unit before you divide.
- The answer is a dimensionless number; the conventional way to write it is .
Common Mistakes
- Dividing actual size by image size (gives a fraction less than 1 — wrong by definition).
- Mixing units (e.g. image size in divided by actual size in ), which gives an answer off by a factor of .
- Forgetting to round to the nearest whole number, or rounding in the wrong direction.
- Writing without the — a magnification is incomplete without its unit symbol.
Things to Be Careful About
- This question uses the magnification of the printed image (the photomicrograph as it appears on the page), not the magnification at which the original microscope image was taken. The two are different, but the calculation is the same: image size on the page ÷ actual size of the object.
- The number depends on the printed scale of the paper you are working from; the mark scheme accepts a range.