Biology 9700/36 — October/November 2025
Cambridge AS Level · Advanced Practical Skills · worked solutions for every part, with the mark scheme
Topics Analysis, Conclusions and Evaluation · Presentation of Data and Observations · Manipulation, Measurement and Observation · Use of the Light Microscope
Yeast cells contain enzymes that hydrolyse sucrose into reducing sugars, as shown in Fig. 1.1.
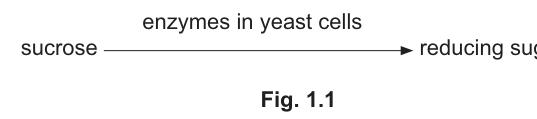
Fig. 1.1
You will investigate the activity of the enzymes in yeast cells that are immobilised in sodium alginate beads and yeast cells that are in a suspension (‘free’ yeast cells).
You are provided with the materials shown in Table 1.1.
Table 1.1
| labelled | contents | hazard | volume / |
|---|---|---|---|
| Y | yeast cell suspension | low | 20 |
| A | sodium alginate solution | low | 20 |
| C | calcium chloride solution | low | 20 |
| S | sucrose solution | low | 50 |
| Benedict’s | Benedict’s solution | harmful irritant | 20 |
| W | distilled water | low | 50 |
If any solution comes into contact with your skin, wash off immediately with cold water.
It is recommended that you wear suitable eye protection.
You will need to:
- immobilise some of the yeast cells in sodium alginate
- put the immobilised yeast cells and some ‘free’ yeast cells into sucrose solution
- test both solutions for reducing sugars
- compare the activity of immobilised yeast cells and ‘free’ yeast cells.
Investigating the activity of the enzymes in immobilised yeast cells
Carry out step 1 to step 20.
step 1 Put of sodium alginate, A, into a beaker.
step 2 Stir the yeast cell suspension, Y, and put of Y into the beaker containing A. Mix well.
step 3 Use a syringe to collect of the mixture of A and Y. Wipe the outside of the syringe.
step 4 Hold this syringe over the beaker containing calcium chloride solution, C, as shown in Fig. 1.2.
step 5 Slowly press down on the plunger so that a drop of the mixture is released into C. The drop will form a bead.
step 6 Repeat step 5 until all of the mixture in the syringe has been formed into beads.
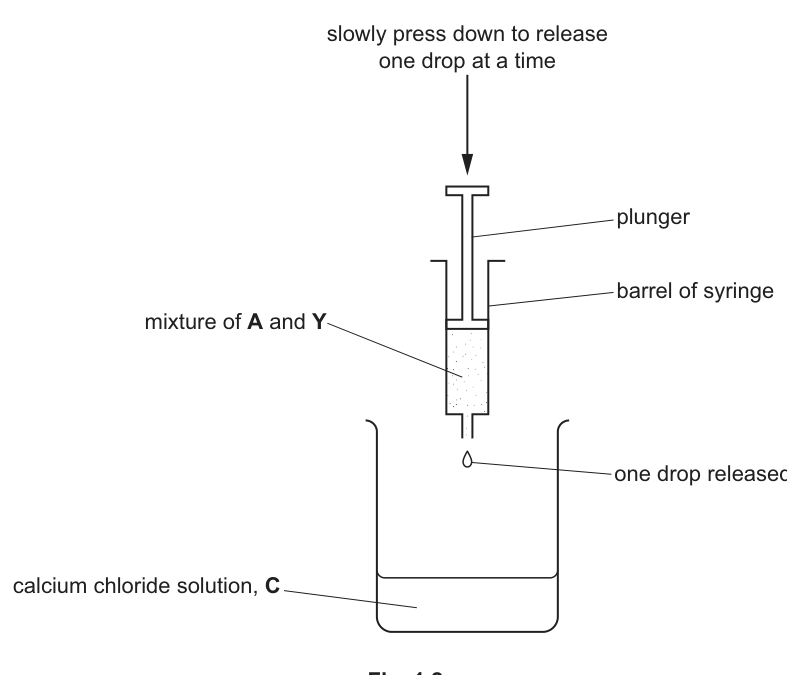
Fig. 1.2
step 7 Leave the beads in the beaker for at least 5 minutes.
step 8 Set up a boiling water-bath ready for step 18.
step 9 Label a beaker B.
step 10 Put of sucrose solution, S, into the beaker labelled B.
step 11 Label 5 test-tubes 1, 2, 3, 4 and 5.
step 12 Put of Benedict’s into each of the test-tubes.
step 13 After at least 5 minutes (step 7), separate the beads from solution C using the apparatus shown in Fig. 1.3.
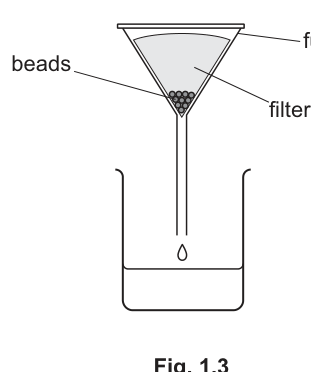
Fig. 1.3
After step 14 you will remove a sample from B every minute for 5 minutes.
step 14 Put all of the beads into the beaker labelled B. Stir and then start timing.
step 15 At 1 minute, stir the contents of beaker B and use a syringe to transfer of the solution surrounding the beads into the test-tube labelled 1.
step 16 At 2 minutes, stir the contents of beaker B and use a syringe to transfer of the solution surrounding the beads into the test-tube labelled 2.
step 17 Continue taking samples at 3, 4 and 5 minutes using the test-tubes labelled 3, 4 and 5.
step 18 Put test-tube 1 into the boiling water-bath and measure the time to the first colour change. Record your result in (a)(i).
If there is no colour change after 60 seconds, stop timing and record the time as ‘more than 60’.
step 19 Remove the test-tube from the boiling water-bath.
step 20 Repeat step 18 and step 19 for the test-tubes labelled 2, 3, 4 and 5.
Investigating the activity of the enzymes in ‘free’ yeast cells
To investigate the activity of the enzymes in ‘free’ yeast cells, you will need to test the samples with Benedict’s solution immediately after the sample is taken.
The water-bath should be boiling throughout this part of the investigation.
Carry out step 21 to step 32.
step 21 Label a beaker F.
step 22 Put of sucrose solution, S, into the beaker labelled F.
step 23 Label 5 clean test-tubes 1, 2, 3, 4 and 5.
step 24 Put of Benedict’s into each of the test-tubes.
step 25 Stir the yeast cell suspension, Y, and put of Y into the beaker labelled F. Mix well and start timing.
The timer should not be stopped until you have completed step 32 – keep the timer running continuously.
step 26 At 1 minute, use a syringe to transfer of the solution in F into the test-tube labelled 1. Do not stop the timer.
step 27 Immediately put test-tube 1 into the boiling water-bath and measure the time to the first colour change. Record your result in (a)(i).
If there is no colour change after 60 seconds, record the time as ‘more than 60’.
step 28 Remove the test-tube from the boiling water-bath.
step 29 At 2 minutes, use a syringe to transfer of the solution in F into the test-tube labelled 2. Do not stop the timer.
step 30 Immediately put test-tube 2 into the boiling water-bath and measure the time to the first colour change. Record your result in (a)(i).
If there is no colour change after 60 seconds, record the time as ‘more than 60’.
step 31 Remove the test-tube from the boiling water-bath.
step 32 Repeat step 30 and step 31 at 3, 4 and 5 minutes using the test-tubes labelled 3, 4 and 5.
Answer
| time / min | time to first colour change with yeast in beads (B) / s | time to first colour change with free yeast cells (F) / s |
|---|---|---|
| 1 | more than 60 | 50 |
| 2 | 55 | 28 |
| 3 | 40 | 18 |
| 4 | 28 | 12 |
| 5 | 20 | 8 |
Representative values are shown — the candidate's own readings will depend on the actual yeast and reagent concentrations, but must show a decreasing trend for both conditions and shorter times for free yeast than for beads at every sampling time.
See working (representative values shown)
Background Concept
The Benedict's test detects reducing sugars. A positive result is shown by a colour change from blue through green, yellow and orange to a brick-red precipitate of copper(I) oxide. The reaction requires reducing sugar in excess of the copper(II) sulfate present, so the time to the first appearance of any colour change is inversely related to the concentration of reducing sugar in the sample: more reducing sugar → faster colour change → shorter time.
In this investigation, sucrose is hydrolysed by yeast enzymes into glucose and fructose, both of which are reducing sugars. As the reaction proceeds, the concentration of reducing sugars in the surrounding solution rises, and the Benedict's test becomes positive in a shorter time.
Two preparations of yeast are compared:
- Immobilised yeast in alginate beads — yeast cells trapped inside calcium-alginate gel beads formed when drops of a yeast-alginate mixture fall into calcium chloride solution.
- Free yeast cells — the same yeast suspension used directly, without immobilisation.
Immobilisation may slow the apparent reaction because substrate (sucrose) has to diffuse into the bead and product (reducing sugars) has to diffuse out, whereas free yeast enzymes are in direct contact with the sucrose.
Understanding the Question
You have carried out the practical and now need to record what you observed. From each of two beakers (B with beads, F with free yeast) you took a 1 cm³ sample every minute for 5 minutes and tested it with Benedict's solution. For each sample you timed, in seconds, how long it took to see the first colour change; if no change appeared within 60 s, you recorded 'more than 60'.
Approach
The table must compare two conditions at five sampling times. The independent variable (sampling time) goes down the left. The two conditions are the column headings placed to the left of the dependent variable (time to first colour change), which appears with the unit '/ s' in each column heading. Units must not appear in the body of the table. Times are recorded to the nearest whole second.
Step-by-Step Reasoning
- Independent variable first: the time of sampling (1, 2, 3, 4, 5 min) is the independent variable and forms the leftmost column.
- Two conditions as columns: yeast in beads (B) and free yeast cells (F) are the two conditions. The mark scheme requires them to be placed to the left of the dependent variable — achieved by making them the two right-most column headings while the dependent variable (time to colour change / s) is included in each heading.
- Heading conventions: each column heading has both the quantity and the unit ('/ s'); units are not repeated in the body.
- Five results per condition: one result per sampling time per condition, so ten cells in total.
- Trend check: as sampling time increases, time to colour change must decrease in both columns because reducing sugars accumulate.
- Comparison check: at every sampling time, free yeast must give a shorter time than beads, because direct enzyme–substrate contact is faster than diffusion through a bead.
- Whole seconds: the instructions and the mark scheme require times to the nearest whole second, with 'more than 60' written if no colour change occurred within the 60-second window.
Key Takeaways
- Two conditions × five sampling times = ten data points in a 5 × 2 table.
- Heading format: quantity + unit; no unit in the body.
- Independent variable on the left; conditions placed to the left of the dependent variable.
- Whole-second recordings; use 'more than 60' for non-reactors within the timing window.
- The expected trend is decreasing times for both conditions, with free yeast always faster than beads.
Common Mistakes
- Forgetting to record 'more than 60' for the bead sample at 1 min — losing a mark because a value is missing where the instructions tell you how to record it.
- Repeating the unit 's' in every cell of the body — only the column heading should carry it.
- Putting the two conditions in rows and the time in columns — the mark scheme requires conditions to the left of the dependent variable.
- Recording times to one decimal place — the instructions and mark scheme require whole seconds.
- Missing out a time point so the table only has four results per condition.
Things to Be Careful About
- Judge the first colour change (often a faint green) rather than waiting for the brick-red end-point.
- Stir immediately before sampling so the value represents the bulk solution, not a local pocket of substrate or product.
- Match each test-tube (1–5) to its correct sampling time when recording — easy to muddle under exam pressure.
Describe and compare the trends in your results, with reference to the data in (a)(i).
Answer
- For yeast in beads (B): as the sampling time increases from 1 to 5 minutes, the time to first colour change decreases (e.g. from more than 60 s at 1 min to 20 s at 5 min).
- For free yeast cells (F): as the sampling time increases from 1 to 5 minutes, the time to first colour change decreases (e.g. from 50 s at 1 min to 8 s at 5 min).
- Comparison: at every sampling time the time to first colour change is shorter for free yeast cells than for yeast in beads (e.g. at 5 min, free yeast = 8 s but beads = 20 s), so the free yeast hydrolyses sucrose faster than the immobilised yeast.
See working
Background Concept
A trend is a general pattern of change in the dependent variable as the independent variable changes. Comparing trends between two conditions means describing both individually and then stating how they differ.
The dependent variable here is the time to first colour change, which is inversely related to reducing-sugar concentration. A shorter time therefore means more reducing sugar is present in the sample at the moment it was taken.
Understanding the Question
You need to do three things:
- Describe how the time to colour change changed over the 5-minute sampling period for the beads.
- Describe how it changed over the 5-minute sampling period for the free yeast.
- Compare the two — say which condition gave shorter times and quote data to back it up.
The command word 'compare' requires a direct comparison, not just two separate descriptions.
Approach
Look down each column of your own results table. In both columns the times fall as the sampling time rises — that is the trend. Compare the two columns cell-by-cell: free yeast is always faster (shorter time) than beads. Pick one time point and quote both values as evidence.
Step-by-Step Reasoning
- Beads trend: read down the B column. Times fall from 1 min to 5 min. State that as time increases, time to colour change decreases.
- Free-yeast trend: read down the F column. Times also fall from 1 min to 5 min. State the same decreasing pattern.
- Comparison: read across each row. Free yeast is always shorter than beads. State that comparison explicitly.
- Data quote: choose one row (typically the clearest — here 5 min) and quote both numbers to give numerical support.
Key Takeaways
- 'Describe and compare' demands a direct comparison statement, not just two parallel descriptions.
- A data quote (one pair of numbers with units) earns the supporting-evidence mark.
- Decreasing time = increasing reducing-sugar concentration = faster enzyme activity.
Common Mistakes
- Writing 'the time decreases' without saying with what it decreases (i.e. with sampling time).
- Describing the two conditions separately without ever comparing them — only the description mark is earned, not the comparison mark.
- Vague comparison ('free is faster') without numbers — the data-quote mark is lost.
- Mixing up which condition is faster.
Things to Be Careful About
- Use the candidate's own numbers from (a)(i); do not invent values.
- Quote the numbers exactly as recorded, with the unit 's'.
- The comparison should reference the trend, not just state which is faster.
Answer
Repeat the experiment using boiled yeast cells (or boiled beads) instead of active yeast, OR use distilled water instead of yeast — this confirms that any colour change is due to the active yeast enzymes and not to the sucrose or other reagents on their own.
Use boiled yeast cells / boiled beads / distilled water in place of the yeast
Background Concept
A control is a parallel experiment in which the variable being tested is removed or held constant, so that any observed effect can be attributed to that variable alone and not to something else in the procedure.
In this investigation the variable being tested is the activity of yeast enzymes on sucrose. A negative control therefore uses a preparation in which those enzymes are absent or inactive.
Understanding the Question
You need a control that proves the Benedict's colour change is caused by the yeast enzymes (and not, for example, by sucrose spontaneously reducing copper ions, or by impurities in the alginate beads).
Approach
The cleanest negative control is to remove the active enzyme. There are two ways:
- Boil the yeast (or boiled beads) — heat denatures the enzymes irreversibly, so any colour change observed cannot be due to enzyme activity.
- Replace the yeast with distilled water — there is no enzyme at all, so no reaction should occur.
Step-by-Step Reasoning
- The Benedict's test is positive because enzymes in the yeast hydrolyse sucrose → reducing sugars → reduce Cu²⁺ to Cu⁺.
- To show that the colour change depends on the enzymes, repeat the experiment with the enzymes removed.
- Boiling denatures proteins, so boiled yeast contains no active enzyme. Boiled beads therefore give no hydrolysis and Benedict's remains blue (or 'more than 60').
- Alternatively, use distilled water in place of the yeast suspension — same outcome.
Key Takeaways
- A control isolates the variable being tested.
- For an enzyme experiment, the standard control is boiled enzyme (denatured) or no enzyme (water).
- The control must be run through exactly the same procedure as the test, with only the enzyme variable changed.
Common Mistakes
- 'Use Benedict's on its own' — this does not control for the sucrose; it only checks that Benedict's does not change on its own.
- 'Use a different sugar' — that is an additional experimental variable, not a control.
- 'Repeat the experiment' — that is replication, not a control.
Things to Be Careful About
- The control should test the absence of the active variable, not a different concentration of it.
- Be explicit about what is being controlled and why.
The samples taken from B were tested for the presence of reducing sugars after all 5 samples had been taken.
Suggest why each sample from F had to be tested for the presence of reducing sugars immediately.
Answer
The free yeast cells remain in the sample taken from F and continue to hydrolyse sucrose into reducing sugars, so the concentration of reducing sugar keeps rising after the sample is removed. If testing were delayed, the Benedict's result would no longer reflect the reducing-sugar concentration at the time the sample was taken.
Free yeast cells remain in the sample and continue to catalyse the reaction
Background Concept
An enzyme-catalysed reaction proceeds as long as substrate, enzyme and suitable conditions are present. Removing a sample from the reaction mixture does not stop the reaction unless the enzyme is also removed or inactivated.
The Benedict's test measures the concentration of reducing sugar at the moment the sample is heated with copper(II) sulfate. The time to first colour change is inversely related to that concentration.
Understanding the Question
In the F beaker the yeast cells are in suspension. When you take 1 cm³ into Benedict's, those yeast cells are still alive and still catalysing the hydrolysis of any sucrose that came with them. In the B beaker the beads are removed (the beads are bigger than the cells and stay in the funnel), so the sample does not contain active yeast.
The procedure specifies that F samples must be tested immediately, but B samples can be batched and tested together at the end. Why?
Approach
Compare what is in the F sample vs the B sample at the moment it is taken:
- B sample: sucrose solution surrounding the beads. The beads (and therefore the yeast enzymes) are left behind in the funnel, so the sample contains no active enzyme. The reducing-sugar concentration is now 'frozen' and the samples can be tested in batch.
- F sample: sucrose solution containing free yeast cells. The yeast enzymes are still present and will keep hydrolysing any remaining sucrose. The reducing-sugar concentration therefore rises during any delay.
Step-by-Step Reasoning
- The reaction in F is sucrose → reducing sugars, catalysed by yeast enzymes.
- As long as yeast cells, sucrose and water are all in the same tube, the reaction continues.
- Removing 1 cm³ from beaker F does not stop the reaction — the cells and sucrose come with the sample.
- While waiting, more sucrose is hydrolysed, so the reducing-sugar concentration rises.
- A delayed Benedict's test therefore gives a shorter time to colour change than the true value at the sampling instant — the data point is biased high.
- To avoid this bias, the F sample must be put into the boiling Benedict's immediately, which both stops the enzyme and starts the test.
Key Takeaways
- The Benedict's test must capture the reducing-sugar concentration at a defined moment.
- Free enzyme in a sample keeps working; immobilised enzyme is removed with the apparatus.
- The asymmetry in the procedure (batch test for B, immediate test for F) reflects this difference.
Common Mistakes
- Saying 'because Benedict's cools down' or 'to save time' — neither captures the enzymatic reason.
- Saying 'to avoid contamination' — irrelevant here.
- Saying 'because the samples would evaporate' — irrelevant.
Things to Be Careful About
- The free yeast cells are small enough to come through the syringe and remain in the sample; that is why the timing matters.
- The beads in B are large and stay in the beaker, so the sample is enzyme-free.
Suspensions and solutions were stirred throughout the investigation. Explain two ways in which stirring increased the accuracy of the results.
1 ______
2 ______
Answer
-
Even concentration of yeast cells throughout the solution, so the cell density (and therefore enzyme activity) is the same in every 1 cm³ sample taken — preventing some samples being more 'enzyme-rich' than others.
-
Even mixing of the substrate (sucrose) with the yeast enzymes, so that local pockets of high or low substrate concentration do not bias the sample — every 1 cm³ taken has the same composition as the bulk.
- Even concentration of yeast cells in the solution; 2. Even mixing of substrate (sucrose) with the yeast enzymes
Background Concept
A suspension of cells in solution is not, at the microscopic scale, homogeneous. Cells settle, droplets form local regions of higher concentration, and any small sample taken without mixing may over- or under-represent the bulk composition. Stirring (or shaking) before each sample is taken equalises the composition so the sample reflects the bulk.
Accuracy, in this context, means that the value recorded is close to the true value for the bulk at that moment. Stirring improves accuracy by removing sampling bias.
Understanding the Question
You stirred the yeast-alginate mixture, the beads in beaker B, and the free yeast in beaker F. The question asks you to explain two distinct ways that stirring increased the accuracy of the readings.
Approach
Think of the contents of the beaker at the moment of sampling:
- Yeast cells (the enzyme source).
- Sucrose (the substrate).
- Reducing sugars (the accumulating product).
Stirring helps each of these be uniformly distributed. Pick two distinct benefits that translate into a more accurate reading.
Step-by-Step Reasoning
- Yeast-cell uniformity — without stirring, yeast cells settle or form clumps. Some 1 cm³ samples would contain more cells (and therefore more enzyme activity) than others. Stirring suspends the cells evenly so every sample has the same number of cells in it; the time recorded then reflects a true rate rather than a sampling artefact.
- Substrate uniformity — sucrose can form local concentration gradients as it is consumed near the cells. Stirring equalises the sucrose concentration so every sample sees the same bulk substrate level.
- Product uniformity — reducing sugars produced by the reaction also need to be evenly distributed before a sample is taken, otherwise some samples reflect local accumulation rather than the bulk value.
- Even temperature distribution (less relevant here, but a valid general point) — stirring avoids hot or cold spots, particularly relevant if the beaker sits over a heat source.
Any two of these accuracy benefits earns the marks.
Key Takeaways
- Stirring in a heterogeneous mixture is essential to make every small sample representative of the bulk.
- Accuracy = closeness to the true value; stirring removes sampling bias introduced by local heterogeneity.
- For this experiment, the three components that must be evenly distributed are yeast cells, sucrose and reducing sugars.
Common Mistakes
- Vague answers such as 'it mixes things up' or 'so the reaction happens properly' — too imprecise to earn credit.
- 'Stops the reaction' — stirring does not stop the reaction; it merely mixes the contents.
- 'Increases the rate' — stirring may give a small kinetic benefit, but the question asks about accuracy, not rate.
Things to Be Careful About
- The question asks specifically about accuracy, not rate or yield.
- Each answer must name a specific component (cells, substrate, product) that becomes evenly distributed.
State one possible source of error when determining the dependent variable for the ‘free’ yeast cells. Suggest one improvement to the procedure that would increase the accuracy of measuring the dependent variable.
error ______
improvement ______
Answer
-
Error: judging the time to first colour change is difficult because the candidate has to take the sample and start timing the Benedict's test at the same moment — both tasks are happening in parallel and the moment of colour change can easily be missed.
-
Improvement: carry out each one-minute interval in a separate beaker (or stop the enzyme reaction immediately after each sample is taken, e.g. by heating the sample) so that the timing of the Benedict's test can be done without having to take the sample at the same time.
Error: difficulty judging the first colour change while also taking the sample; Improvement: use a separate beaker for each time interval (or stop the enzyme immediately after each sample is taken)
Background Concept
In the free-yeast part of the investigation, step 26 (taking a sample) and step 27 (timing the Benedict's test) are supposed to be done back-to-back, but in practice the candidate has to:
- Pick up the syringe.
- Draw up 1 cm³ from F.
- Transfer it to test-tube 1.
- Start the Benedict's timer immediately.
This is hard to do smoothly, and the moment the colour change appears is easily missed because the candidate's attention is split between the sample transfer and the colour judgement.
A source of error in this context is anything that makes the recorded value different from the true value.
Understanding the Question
You must identify one source of error specific to the free yeast part of the procedure (where the sample has to be tested immediately) and propose one improvement that would make the timing more accurate.
Approach
The error must be something the procedure forces the candidate to do, not a vague comment about 'human error'. The improvement must directly address that error.
Look at steps 25–32: at each one-minute mark the candidate both takes the sample and begins the Benedict's timing. That is the moment of difficulty.
Step-by-Step Reasoning
- Source of error: the candidate has to simultaneously take a sample and start timing the Benedict's colour change. This is a difficult multitasking task and the first appearance of colour is easily overlooked.
- Improvement 1: set up five separate beakers, each started one minute after the previous one, so the Benedict's timer for beaker 1 is started at the same time as the addition of yeast to beaker 1, and so on — only one task at a time.
- Improvement 2: take the sample, then immediately add it to Benedict's that is already at boiling, so the candidate can focus purely on judging the colour change without taking a sample at the same time.
- Improvement 3: stop the enzyme reaction as soon as the sample is taken, e.g. by adding the sample to Benedict's that contains a denaturant, or by adding the sample to a hot tube — this removes the timing pressure from the Benedict's step.
Any of these earns the improvement mark, provided the error and improvement are clearly linked.
Key Takeaways
- An 'error' must be specific to the procedure, not generic ('human error').
- The improvement must directly solve the error identified.
- In multitasking procedures, separating the tasks into separate steps almost always improves accuracy.
Common Mistakes
- 'Human error' — too vague, never credited.
- 'Not accurate measurements' — not a specific source of error.
- Improvement that does not match the error (e.g. error about temperature, improvement about stirring).
- Improvement that simply repeats the procedure ('do it again', 'be more careful') — these are not changes to the procedure.
Things to Be Careful About
- The error and improvement are specific to the free yeast part, where multitasking is forced.
- A valid improvement must be a real change to the procedure, not just a vague intention.
A scientist carried out an investigation to determine the effect of pH on the activity of immobilised catalase enzyme and ‘free’ catalase enzyme.
All other variables were kept constant.
The results are shown in Table 1.2.
Table 1.2
| pH | activity of catalase / arbitrary units (au) | |
|---|---|---|
| immobilised | free | |
| 5 | 68 | 50 |
| 6 | 88 | 62 |
| 7 | 99 | 96 |
| 8 | 98 | 65 |
| 9 | 94 | 48 |
Plot a line graph of the data in Table 1.2 on the grid in Fig. 1.4.
Use a sharp pencil.
Answer
Plot on the supplied grid (Fig. 1.4):
- x-axis: pH, scale 1 cm per unit from 5 to 9, labelled at 5, 7 and 9 (every 2 cm).
- y-axis: activity of catalase / arbitrary units (au), scale 20 au per 2 cm from 0 to 100, labelled at 0, 20, 40, 60, 80 and 100 (every 2 cm).
- Two lines with distinguishable labelled symbols:
- Immobilised catalase: (5, 68), (6, 88), (7, 99), (8, 98), (9, 94).
- Free catalase: (5, 50), (6, 62), (7, 96), (8, 65), (9, 48).
- All points plotted as small dots inside circles (immobilised) or crosses (free) using a sharp pencil.
- Lines drawn thin and straight, passing through every plotted point.
- Each line clearly labelled ('immobilised' and 'free') near the right-hand end of the line.
See diagram (line graph with axes labelled, two lines with the values from Table 1.2)
Background Concept
A line graph is the correct choice when both variables are continuous (numerical) and the aim is to show how one changes with the other. Two conditions on the same axes allow the reader to compare them directly.
Standard conventions:
- The independent variable goes on the x-axis (horizontal).
- The dependent variable goes on the y-axis (vertical).
- Each axis is labelled with the quantity and the unit.
- The scale uses at least half the grid in both directions and is not awkward (e.g. avoid 30 or 70 per 2 cm).
- Each axis is labelled at least every 2 cm.
- Points are plotted precisely with a small symbol (dot in circle or cross).
- Points are joined with a thin line — straight between successive points, no 'dot-to-dot' embellishment.
- Each line is clearly labelled so the reader can tell which is which.
Understanding the Question
Table 1.2 gives the activity of immobilised and free catalase at five pH values (5, 6, 7, 8, 9). You need to plot both sets of data on Fig. 1.4 so the reader can see how activity varies with pH for each preparation.
Approach
- Choose axes: pH is the independent variable (set by the scientist); catalase activity is the dependent variable (measured).
- Choose scales: pH from 5 to 9 fits easily on the grid at 1 cm per unit. Activity from 0 to 100 fits at 20 per 2 cm (5 × 2 cm = 10 cm on the y-axis).
- Plot the two sets of points using distinguishable symbols.
- Join each set with a thin straight line through all its points.
- Label each line.
Step-by-Step Reasoning
- Axes:
- x-axis label: 'pH'.
- y-axis label: 'activity of catalase / arbitrary units (au)'.
- Scale on x-axis: 1 cm per unit. Labels at 5, 7, 9 (every 2 cm). All five pH values fit within the grid.
- Scale on y-axis: 20 au per 2 cm. Labels at 0, 20, 40, 60, 80, 100 (every 2 cm). 100 au fits comfortably on the y-axis.
- Plotting:
- Immobilised: (5, 68), (6, 88), (7, 99), (8, 98), (9, 94). Use small dot in circle (or cross) symbols.
- Free: (5, 50), (6, 62), (7, 96), (8, 65), (9, 48). Use a different symbol (e.g. plain cross) so the two are distinguishable.
- Lines: thin, straight, passing through every plotted point in each series.
- Labels: write 'immobilised' near the right-hand end of the immobilised line and 'free' near the right-hand end of the free line (or use a key/legend).
Key Takeaways
- Line graph for two continuous variables.
- x-axis = independent, y-axis = dependent; both labelled with quantity and unit.
- Scales that use at least half the grid, labelled every 2 cm.
- Small precise point symbols; thin straight lines through all points; clear labels.
- Two conditions can be shown on one graph using distinguishable symbols.
Common Mistakes
- Reversing axes (activity on x, pH on y).
- Plotting pH as a categorical axis (only the five values, with no scale).
- Using awkward scales (e.g. 30 or 70 au per 2 cm).
- Drawing smooth curves rather than straight lines between the points.
- Thick, fuzzy lines or large blobs as point symbols.
- Joining the two series with a single line by mistake.
- Failing to label the two lines.
Things to Be Careful About
- Use a sharp pencil so the points and lines are precise.
- Read each y-value from Table 1.2 carefully — easy to misread 68 as 86.
- The two lines cross each other between pH 6 and pH 7; make sure the symbols and lines are clearly distinguishable at the crossing point.
State two conclusions about how pH affects the activity of immobilised catalase compared to ‘free’ catalase.
1 ______
2 ______
Answer
-
Both immobilised and free catalase have the same optimum pH of 7.
-
The immobilised catalase has a higher activity over a wider range of pH than the free catalase (e.g. at pH 9 the immobilised enzyme still has 94 au of activity, whereas the free enzyme has dropped to 48 au).
- Both have optimum pH 7; 2. Immobilised catalase has higher activity over a wider pH range
Background Concept
The optimum pH of an enzyme is the pH at which its activity is highest. Many enzymes work over only a narrow pH range and lose activity quickly on either side of the optimum.
Immobilisation can change the apparent properties of an enzyme in two ways:
- It may physically protect the enzyme from extremes of pH, denaturation, or temperature.
- It may constrain the enzyme's conformation, sometimes broadening the range of conditions over which it remains active.
A wider activity range is a useful practical property because it means the immobilised enzyme is more tolerant of varying conditions in a real reactor.
Understanding the Question
You have a graph with two lines: immobilised catalase activity and free catalase activity, both plotted against pH. From this graph, state two conclusions about how pH affects the activity of the immobilised catalase compared to the free catalase.
Approach
Look at the shape of each curve:
- Where is the peak (highest point) of each? Both peaks are at pH 7, so the optimum pH is the same.
- How steeply does each curve fall away from the peak on either side? The immobilised curve falls much more gently than the free curve, so the immobilised enzyme retains more activity across the range tested.
Step-by-Step Reasoning
- Optimum pH: read the highest point of each line. The immobilised line peaks at (7, 99) and the free line peaks at (7, 96). Both optima are at pH 7.
- Range of activity: compare the slopes away from the optimum. The free line falls steeply on either side of pH 7 (from 96 at pH 7 down to 50 at pH 5 and 48 at pH 9). The immobilised line falls only gently (from 99 at pH 7 down to 68 at pH 5 and 94 at pH 9).
- Therefore, the immobilised catalase has a higher activity over a wider range of pH than the free catalase.
- Quote values to support the second conclusion: e.g. at pH 9, immobilised = 94 au but free = 48 au; at pH 5, immobilised = 68 au but free = 50 au.
Key Takeaways
- The optimum pH is the pH at which activity is highest; it can be read directly from the peak of a graph.
- The range of activity over which an enzyme remains effective is often as important as the optimum in real applications.
- Immobilisation can broaden the effective pH range of an enzyme.
Common Mistakes
- Saying the optimum pH is different for the two preparations — both peak at pH 7.
- Saying immobilised catalase is always more active than free catalase — at pH 7 they are very similar (99 vs 96), but elsewhere the immobilised line is consistently higher.
- Stating the conclusion without reference to data (no pH or activity values quoted).
- Confusing the optimum with the range — these are two distinct features of the graph.
Things to Be Careful About
- A 'conclusion' must be a complete sentence stating a relationship, not a single value.
- The two conclusions should be distinct; 'same optimum' and 'wider range' are the two the data clearly support.
N1 is a slide of a stained transverse section through a plant organ.
Draw a large plan diagram of the whole section on N1. Use a sharp pencil.
Use one ruled label line and label to identify the phloem.
Answer
Draw a plan diagram that:
- Fills most of the available space provided.
- Shows the whole outline of the section, including the shape of the outline and the position and correct number of vascular bundles in the cortex/stele region.
- Contains no individual cells — only the outlines of tissue regions.
- Shows the epidermis as two lines drawn close together around the whole outside of the section.
- Shows the correct number of vascular bundles in their correct positions.
- Has one ruler line drawn from the phloem region of one vascular bundle to the outside of the drawing, labelled phloem.
A plan diagram is therefore a simplified outline of the section that records the shape, the relative positions of the tissues, and the distribution of the vascular bundles — it is NOT a drawing of the cells themselves.
See working — plan diagram drawn on N1.
Background Concept
A plan diagram (sometimes called a low-power plan) is a simplified outline drawing of a specimen as seen down the microscope. The conventions exist so that information about the distribution of tissues, and the shape and proportion of the whole organ, is recorded clearly and consistently.
Key conventions for a plan diagram:
- No cells are drawn — only the boundaries of tissues.
- Continuous, thin, sharp lines (drawn with a sharp pencil).
- No shading anywhere.
- The epidermis (where present) is drawn as two lines drawn close together to show it is a distinct, narrow tissue layer.
- The drawing should fill most of the available space and should be in correct proportion to the specimen.
- Labels are written in pencil on the page outside the drawing, joined to the structure by a straight, horizontal ruler line ending precisely on the structure (the line must touch the structure and the label).
The transverse section of a young dicotyledonous stem (such as a sunflower, Helianthus, or buttercup, Ranunculus, stem — typical Cambridge A-Level specimens) shows, from outside in:
- Epidermis (single layer of cells, often with a thin cuticle).
- Cortex (parenchyma below the epidermis).
- A ring of vascular bundles, each containing xylem (towards the inside of the section) and phloem (towards the outside of the section), separated by a cambium in young stems.
- Pith (parenchyma in the centre).
Within each bundle the phloem is the tissue on the outer side, the xylem is the tissue on the inner side, and the small-celled cambium lies between them.
Understanding the Question
The candidate has been given slide N1, a stained transverse section (TS) through a plant organ. They must produce a large plan diagram of the WHOLE section. They must also use one ruled label line to identify the phloem. Five marks are available, all for plan-diagram conventions and the phloem label.
Approach
First, look at the section under the lowest power of the microscope to see the whole section. Identify the outline shape and the position of every vascular bundle. Choose a clear region of the section to draw (avoid torn or folded areas) and draw the outline of the epidermis, then sketch in the cortex, vascular bundle ring, and pith as smooth continuous outlines. Add the epidermis as a second line just inside the outer line. Finally, draw a ruler line from the phloem in one bundle out to one side and write phloem.
Step-by-Step Reasoning
- Mark 1 — size and correct number of tissues: The plan must be large (use most of the available space) and must show the correct number of tissue layers visible in the section. For a young dicot stem these are: epidermis, cortex, vascular bundles, pith.
- Mark 2 — whole section, no cells: The whole outline of the section must be included. No individual cells should be drawn — this is what makes the diagram a "plan" rather than a cell drawing.
- Mark 3 — epidermis as 2 lines close together: A second line is drawn just inside the outer outline to represent the inner edge of the epidermis.
- Mark 4 — correct number of vascular bundles: The candidate must count and draw the correct number of bundles in their correct positions (a ring near the outside of the section, inside the cortex).
- Mark 5 — phloem label: A single straight ruler line is drawn from the phloem (the small-celled outer part of a bundle) out to the side of the drawing, with the label phloem written at the end. The line must touch the phloem and the line must be horizontal.
Key Takeaways
- A plan diagram is a tissue-level drawing, never a cell-level drawing.
- The epidermis, when present, is always drawn as a double line.
- The phloem is the outer component of each vascular bundle, the xylem is the inner component, and the cambium is the small-celled band between them.
- Labels must be on a horizontal ruler line that ends precisely on the structure.
Common Mistakes
- Drawing individual cells inside the section (this makes it a low-power drawing, not a plan) — loses the "no cells" mark.
- Drawing the epidermis as a single line.
- Drawing too few or too many vascular bundles.
- Labelling xylem where phloem should be (xylem is the inner, larger-celled part of a bundle; phloem is the outer, smaller-celled part).
- Using a label line that does not touch the structure, or that has an arrow, or that is not horizontal.
Things to Be Careful About
- The phloem in a TS through a dicot stem is the part of the bundle nearer the outside of the section.
- The line must be drawn with a ruler, and the line must end on the phloem, not in empty space.
- The drawing must be in the correct proportion to the section — a very small drawing cannot earn the "uses most of the available space" mark.
Observe the cortex on the section of the plant organ on N1. The cortex is the layer beneath the epidermis.
Select a group of four adjacent cortex cells.
Each cortex cell must touch at least two of the other cortex cells.
- Make a large drawing of this group of four cortex cells.
- Use one ruled label line and label to identify the cell wall of one cortex cell.
Answer
Move to a part of the section just below the epidermis where the cortex cells are clearly visible. Select four cortex cells that form a small group in which each cell touches at least two of the others (e.g. a 2 × 2 block, or a central cell surrounded by three others). Then make a large drawing of just those four cells, following these conventions:
- Use a sharp pencil to draw continuous, thin, sharp lines — no broken or sketchy lines, no shading.
- Draw only four cells — not three, not five.
- Each cell must touch at least two of the others (a 2 × 2 arrangement satisfies this automatically).
- Draw the cell walls as two lines close together (this represents the cellulose cell wall and middle lamella of the adjacent cells).
- The cells should have the correct shapes — for cortex parenchyma they are roughly isodiametric / polygonal with rounded corners.
- Draw one ruled horizontal label line from the cell wall of one of the cells to the side, and write the label cell wall at the end. The line must end precisely on the cell wall (between the two lines).
See working — high-power drawing of four cortex cells.
Background Concept
The cortex in a young dicot stem is the parenchymatous tissue that lies immediately inside the epidermis and outside the ring of vascular bundles. Its cells are:
- Roughly isodiametric (similar length and width) or polygonal.
- Have thin cellulose cell walls (drawn as two lines close together because the cell wall plus middle lamella sits between the two adjacent protoplasts).
- Often have small intercellular air spaces at the corners where three or more cells meet.
A drawing of cells under high power is a biological drawing, not a plan diagram. Conventions for cell drawings:
- Continuous, thin, sharp, single lines drawn with a sharp HB pencil.
- No shading anywhere.
- Each cell wall is drawn as two lines close together.
- The relative sizes, shapes, and positions of the cells must be as observed under the microscope — not an idealised textbook version.
- No labels inside the cells (other than, for example, a nucleus if visible and required).
- One horizontal ruler line from the structure to be labelled, ending precisely on the structure, with the label written in pencil at the outer end.
Understanding the Question
The candidate has to look at slide N1, find the cortex (the tissue immediately below the epidermis), and choose four adjacent cortex cells in which each cell touches at least two of the others. They then make a large drawing of those four cells, using one ruled label line to identify the cell wall. Five marks are available.
Approach
First locate the cortex (just under the epidermis). Switch to a higher power objective so the cell walls are clearly visible. Look for a small group of four cortex cells in a tight cluster where each cell shares a wall with at least two of the others — a 2 × 2 block is the simplest. Draw the outlines carefully with a sharp pencil, then add the second line of each cell wall. Finally, draw one horizontal ruler line from the cell wall of one of the cells out to the side, and label it cell wall.
Step-by-Step Reasoning
- Mark 1 — quality of lines and no shading: The drawing must be done with a sharp pencil in continuous thin lines. No broken, fuzzy, or shaded lines anywhere.
- Mark 2 — exactly four cells, each touching at least two others: A 2 × 2 arrangement satisfies this. If a cell only touches one other, the mark is lost.
- Mark 3 — cell walls as two lines close together: Each shared wall is drawn as a pair of lines (the wall of one cell plus the wall of its neighbour).
- Mark 4 — correct shapes: The cells must look like cortex parenchyma — polygonal / isodiametric with rounded corners — and the relative sizes must match what is seen.
- Mark 5 — cell wall label: A single horizontal ruler line ending on the cell wall (between the two lines) with the words cell wall written at the outer end.
Key Takeaways
- Cell drawings show cells, plan diagrams show tissue outlines.
- Cell walls are always drawn as two lines close together.
- The "four adjacent cells" rule forces the candidate to think about which cells share a wall — this is good practice for interpreting the tissue.
- Labels must use a horizontal ruler line that ends on the structure.
Common Mistakes
- Drawing the cell wall as a single line.
- Drawing five or three cells, or a single cell.
- Drawing cells that touch at only one point (corner contact) rather than sharing a wall.
- Using shading or coloured pencil.
- Label line that does not end on the cell wall, or that is drawn with a freehand line instead of a ruler.
Things to Be Careful About
- "Touches" in the Cambridge mark scheme means shares a wall, not merely corner-to-corner contact.
- The drawing must be large (use most of the available space).
- Cortex cells in young dicot stems are typically parenchyma; if the section is from a different organ (e.g. a root), the shapes will be different — use what is actually seen.
Fig. 2.1 is a photomicrograph of a stained transverse section of the same organ from a different plant to N1.
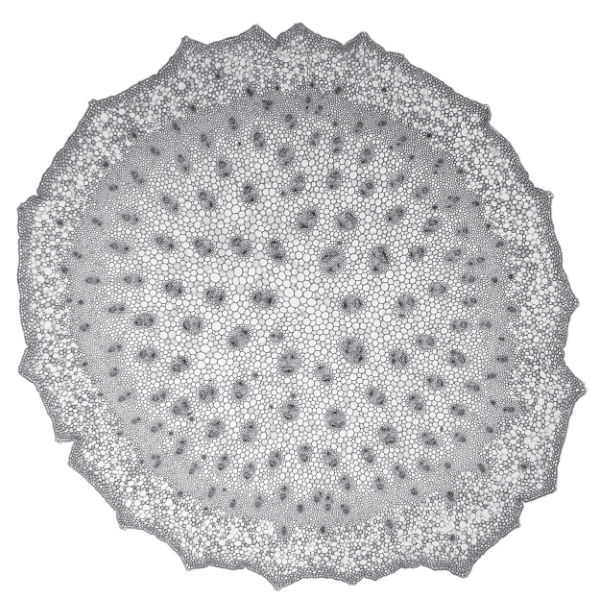
Fig. 2.1
Identify three observable differences, other than colour, between the section on N1 and the section in Fig. 2.1.
Record these three observable differences in Table 2.1.
Table 2.1
| feature | N1 | Fig. 2.1 |
|---|---|---|
| 1 | ||
| 2 | ||
| 3 |
Answer
Compare slide N1 (a young dicotyledonous stem — vascular bundles arranged in a ring) with Fig. 2.1 (a monocotyledonous stem — vascular bundles scattered throughout the ground tissue). Record three observable differences, other than colour, in Table 2.1.
A correct completed table is:
| feature | N1 | Fig. 2.1 |
|---|---|---|
| arrangement of vascular bundles | in a ring, near the outside | scattered throughout the ground tissue |
| number of vascular bundles | fewer | more |
| size of vascular bundles | similar / all about the same size | of different sizes (smaller towards the centre) |
| width of the epidermis | thinner | wider |
Any three of the differences above are credited. The differences must be observable in the two sections, must not be colour, and must be recorded with a feature in column 1, the N1 observation in column 2 and the Fig. 2.1 observation in column 3.
Three observable differences, e.g.: (1) arrangement of vascular bundles — N1: ring / Fig. 2.1: scattered; (2) number of vascular bundles — N1: fewer / Fig. 2.1: more; (3) size of vascular bundles — N1: similar / Fig. 2.1: different sizes.
Background Concept
The two great groups of flowering plants — monocotyledons (monocots) and dicotyledons (dicots) — can usually be told apart by looking at a transverse section of the stem:
- Dicotyledonous stem — vascular bundles are arranged in a single ring near the outside of the section (just inside the cortex). The bundles are of similar size, each contains xylem on the inside, phloem on the outside, and a strip of cambium between them. The pith is large and central.
- Monocotyledonous stem — vascular bundles are scattered throughout the ground tissue. There are many more bundles, and they are of different sizes (often larger towards the outside, smaller towards the centre). Each bundle is typically enclosed in a bundle sheath of sclerenchyma, and there is no cambium (so no secondary growth).
Other observable features that may differ include the width of the epidermis, the presence of a distinct cortex and pith (clear in dicot, often not clear in monocot because the bundles fill the section), the shape of the outline (often wavy / ridged in monocots with a strong sclerenchymatous hypodermis), and the presence of an endodermis or bundle-sheath sclerenchyma.
Understanding the Question
The candidate is given Fig. 2.1, a photomicrograph of a stained TS of a different plant's stem. They have already seen slide N1, which has vascular bundles in a ring. The task is to record three observable differences — other than colour — in Table 2.1. The marks are awarded for: a mark for recording only observable differences, and three marks for the three correct differences.
Approach
Look carefully at both sections and list every structural feature that you can see clearly differs. Do not describe features that require special staining or that you cannot see. Choose the three most obvious ones, and for each one, state what is seen in N1 and what is seen in Fig. 2.1.
Step-by-Step Reasoning
The most reliable, observable differences between a dicot stem and a monocot stem (as shown in Fig. 2.1) are:
- Arrangement of vascular bundles: N1 has them in a ring (just inside the cortex); Fig. 2.1 has them scattered throughout the ground tissue.
- Number of vascular bundles: N1 has fewer bundles (a single ring); Fig. 2.1 has many more bundles.
- Size of vascular bundles: N1 bundles are all about the same size; Fig. 2.1 bundles are of different sizes (often larger near the outside, smaller near the centre).
- Width of the epidermis: N1 has a thinner epidermis; Fig. 2.1 has a wider (thicker) outer wall and a more pronounced epidermis / hypodermis region.
The candidate picks any three of these and writes them in the table. The first mark is for the convention of recording only observable differences (no theoretical statements, no colour comparisons).
Key Takeaways
- A dicot stem has vascular bundles in a ring; a monocot stem has them scattered.
- Observable differences are those that can be seen directly in the section — colour is excluded by the question, and so are inferences about growth habit or habitat.
- Recording comparisons in a table forces the candidate to state both sides of the difference clearly.
Common Mistakes
- Stating that N1 is a "stem" and Fig. 2.1 is a "root" (or vice versa) — this is not what the question asks; the question asks for observable differences, and both are stems.
- Writing differences that depend on colour (e.g. "N1 is stained more darkly") — colour is excluded.
- Writing vague statements such as "different" with no description of how they differ.
- Describing features that are not actually visible in the section.
- Forgetting to fill in the N1 column or the Fig. 2.1 column.
Things to Be Careful About
- The first mark is for only observable differences — so avoid writing about cambium, secondary growth, or other features that cannot be directly seen in the section.
- Each row of the table must have the feature in column 1, and the two observations in columns 2 and 3.
- The differences must be between the two sections, not a description of only one of them.
Fig. 2.2 is the same photomicrograph as that shown in Fig. 2.1.
A black dot has been placed at the centre of the section.
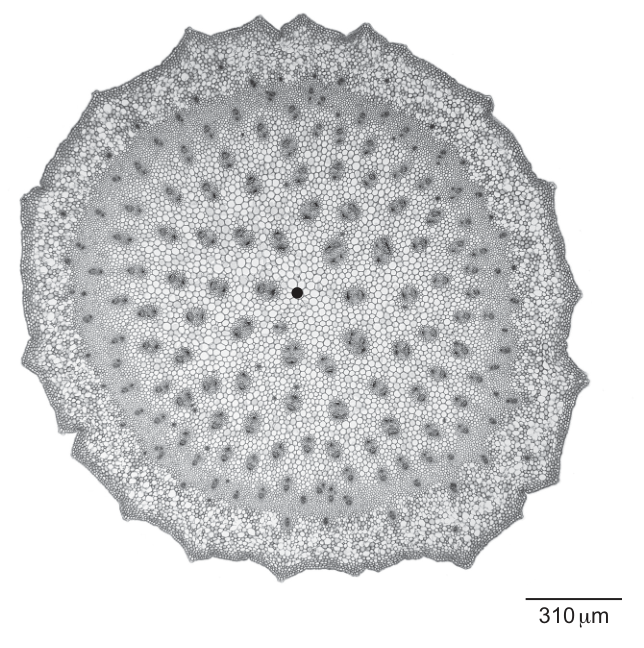
Fig. 2.2
Determine the mean diameter of the section in Fig. 2.2.
Show your working and include units.
mean diameter = ______
Working
Take at least three measurements of the diameter of the section in Fig. 2.2, each one passing through (or close to) the black dot at the centre. Record each measurement with units. Then calculate the mean.
Representative measurements (these will vary with the printed size of the figure):
| measurement | diameter / mm |
|---|---|
| 1 | 96 |
| 2 | 94 |
| 3 | 95 |
| 4 (optional) | 96 |
Answer
mean diameter = 95 mm (95.25 mm) — to the nearest mm
mean diameter ≈ 95 mm (representative value, depends on printed size of figure)
Background Concept
To find a representative size of an irregularly shaped specimen (such as a roughly circular TS of a stem), it is good practice to take several measurements through the centre and then calculate a mean. This averages out the effect of any irregularity in the outline and reduces the effect of a single inaccurate measurement.
For a roughly circular section, the diameters should be measured across the section passing through the centre (or as close to the centre as possible). The black dot in Fig. 2.2 has been placed at the centre specifically so that the candidate can align each diameter line through it.
Understanding the Question
Fig. 2.2 is the same photomicrograph as Fig. 2.1 with a black dot at the centre of the section. The candidate is asked to determine the mean diameter of the section as it appears on the page. The marks are for: taking at least three diameter measurements, and recording a mean value with appropriate units.
Approach
Use a ruler. Measure the distance from one side of the section to the other, passing through the black dot. Take at least three such measurements, ideally at different angles (e.g. horizontal, and two diagonals). Record each one with the correct unit, then calculate the mean.
Step-by-Step Reasoning
- Mark 1 — at least three measurements: The mark scheme requires at least three diameter measurements through (or near) the centre.
- Mark 2 — values within range and units: The measurements must be sensible (not 5 mm, not 500 mm) and must include the unit (mm on a printed figure, µm if measuring on the microscope).
For Fig. 2.2 as printed, the candidate's actual numbers will depend on the size of the figure in their exam paper. The example above (95 mm) is a representative value consistent with a printed figure of around 8–10 cm in diameter with a scale bar of around 4 mm.
Key Takeaways
- Multiple measurements through the centre, then a mean, give a more reliable value than a single measurement.
- Always include the unit with a measurement.
- The black dot in Fig. 2.2 is provided specifically as a reference for the centre of the section.
Common Mistakes
- Taking only one measurement.
- Recording a measurement without a unit.
- Measuring the radius (from centre to edge) and forgetting to double it.
- Measuring diagonally across the page rather than through the centre of the section.
Things to Be Careful About
- The diameter must pass through the centre — otherwise the measurement is a chord, not a diameter.
- Record the unit with every measurement and with the mean.
Use the scale bar to calculate the mean actual diameter of the section in Fig. 2.2.
Show your working and include units.
mean actual diameter = ______
Working
- Measure the length of the scale bar (labelled ) on Fig. 2.2 with a ruler. (Representative value: .)
- Use the proportion
Substitute the representative values:
Answer
mean actual diameter ≈ 7400 µm (or 7.4 mm)
mean actual diameter ≈ 7400 µm (representative value, depends on measurements)
Background Concept
A scale bar on a photomicrograph is a printed line of known actual length. By measuring how long the scale bar is on the page (its image length) and how long the structure of interest is on the page, the actual size of the structure can be calculated by proportion:
This is a direct application of similar triangles: the printed image is a scaled version of the actual specimen, so the ratio of image to actual is the same for any feature on the image.
Understanding the Question
The scale bar on Fig. 2.2 represents . The candidate is asked to use this scale bar to convert the mean image diameter measured in (c)(i) into a mean actual diameter of the section.
Approach
Measure the scale bar with a ruler. Substitute the mean image diameter (from (c)(i)) and the scale-bar image length into the proportion above. Multiply by .
Step-by-Step Reasoning
-
Mark 1 — measure the scale bar with units: Measure the printed length of the scale bar to the nearest mm and record the unit.
-
Mark 2 — correct substitution:
must be shown explicitly in the working.
Using the representative values of (mean image diameter) and (scale bar image length):
This rounds to (or ). The candidate's answer will vary with their own measurements; the mark scheme credits any answer obtained by this method.
Key Takeaways
- A scale bar allows you to convert any measured image length to actual size by simple proportion.
- The actual size of the structure is larger than its image if the magnification is greater than 1, and smaller if the magnification is less than 1.
- Always include the unit of the scale bar in your working.
Common Mistakes
- Dividing the wrong way round (dividing the scale bar by the diameter instead of the diameter by the scale bar).
- Forgetting to multiply by the scale-bar value ().
- Quoting the answer in mm instead of µm, or vice versa, without converting.
- Using the wrong measurement from (c)(i) (for example, the radius instead of the diameter).
Things to Be Careful About
- The scale bar unit is µm; the mean image diameter is in mm. The proportion is dimensionless, so the units cancel cleanly and the answer is in µm.
- Keep at least 2 significant figures in the final answer.
Use the mean actual diameter calculated in (c)(ii) to calculate the magnification of Fig. 2.2.
Show your working and give your answer to the nearest whole number.
magnification = ______
Working
The magnification formula is
Substitute the values from (c)(i) and (c)(ii). Both must be in the same units — convert the image size to µm first.
Image size: .
Actual size: (from (c)(ii)).
Answer
magnification =
magnification = × 13 (representative value, depends on measurements)
Background Concept
Magnification is defined as
Both sizes must be expressed in the same unit before the ratio is taken, or the answer will be wrong by a factor of 1000 (typical mm to µm conversion error). The answer is dimensionless — it is just a number — and is conventionally written with a multiplication sign in front, e.g. .
The magnification of a photomicrograph is the factor by which the printed image is larger than the actual specimen. A young dicotyledonous stem of a few mm diameter, when photographed and printed to a few cm, will have a magnification of around to , depending on the print size.
Understanding the Question
The candidate is asked to use the mean actual diameter calculated in (c)(ii) and the mean image diameter from (c)(i) to calculate the magnification of Fig. 2.2, giving the answer to the nearest whole number.
Approach
Convert the image size into the same unit as the actual size (µm in this case: ). Divide the image size by the actual size. Round to the nearest whole number.
Step-by-Step Reasoning
- Mark 1 — correct substitution: The mean image diameter is divided by the answer from (c)(ii).
- Mark 2 — correct answer to the nearest whole number.
Using the representative values:
- Mean image diameter .
- Mean actual diameter .
So the magnification is to the nearest whole number.
The candidate's own answer will depend on their measurements in (c)(i) and (c)(ii); the method is the same.
Key Takeaways
- .
- Always convert to the same unit before dividing.
- A photomicrograph typically has a magnification of to depending on the objective and the print size.
Common Mistakes
- Dividing the actual size by the image size (giving a number less than 1, which cannot be a magnification greater than 1).
- Forgetting to convert mm to µm (off by a factor of 1000).
- Not rounding to the nearest whole number.
- Quoting the answer without the multiplication sign, e.g. "13" rather than "".
Things to Be Careful About
- Use the mean actual diameter from (c)(ii), not the actual diameter of the scale bar ().
- Magnification has no units — it is just a number.
- Write the answer as (or if you cannot use a multiplication sign).