Biology 9700/34 — October/November 2025
Cambridge AS Level · Advanced Practical Skills · worked solutions for every part, with the mark scheme
Topics Manipulation, Measurement and Observation · Presentation of Data and Observations · Analysis, Conclusions and Evaluation · Use of the Light Microscope
(a) A plant produces sugars in its leaves. The sugars produced are needed by other parts of the plant and are transported through the phloem as sucrose.
Sucrose is transported to the roots where it is stored as starch. Some of the sucrose is transported to the fruit of the plant where it is stored as fructose and glucose. Sucrose is also transported to the seeds of the plant.
Water and mineral ions are taken up through the roots where they are transported through the xylem to the rest of the plant.
Solutions were made to represent extracts of different tissues and fluids found in a plant:
- fluid in the phloem
- root tissue
- seed tissue
- fruit tissue
- fluid in the xylem
You are provided with 4 solutions, S1, S2, S3 and S4.
You will:
- identify the biological molecules present in each of the 4 solutions
- suggest which solution, S1, S2, S3 or S4, could represent each of the plant extracts.
You are provided with the materials shown in Table 1.1.
Table 1.1
| labelled | contents | hazard | volume / |
|---|---|---|---|
| A | dilute hydrochloric acid | irritant | 20 |
| H | sodium hydrogencarbonate powder | low | - |
| Benedict's | Benedict's solution | harmful irritant | 40 |
| Iodine | iodine solution | irritant | 20 |
| S1 | solution 1 | low | 60 |
| S2 | solution 2 | low | 60 |
| S3 | solution 3 | low | 60 |
| S4 | solution 4 | low | 60 |
If any solution comes into contact with your skin, wash off immediately with cold water.
It is recommended that you wear suitable eye protection.
You will need to:
- carry out the test for reducing sugars
- carry out the test for non-reducing sugars
- carry out the test for starch
- identify the biological molecules in S1, S2, S3 and S4.
State the reagent or reagents that are used to test for reducing sugars and the colour or colours produced if reducing sugars are present.
reagent or reagents ______
colour or colours ______
Describe how you will carry out the test for reducing sugars.
Answer
reagent or reagents: Benedict's solution
colour or colours: blue green yellow orange brick red (if reducing sugar is present)
Description of the test:
- Add of the solution to a clean test-tube.
- Add an equal volume of Benedict's solution and mix.
- Place the test-tube in a boiling water bath at a temperature of at least for at least 2 minutes.
- Record the final colour of the solution: a change from blue to green, yellow, orange or brick red indicates that a reducing sugar is present.
Benedict's solution; heat in a boiling water bath (); colour change blue green yellow orange brick red.
Background Concept
A reducing sugar is a sugar that carries a free aldehyde () or ketone group capable of donating electrons to another species. When Benedict's reagent (an alkaline solution of copper(II) sulfate, , in sodium citrate / sodium hydroxide) is heated with a reducing sugar, the ions are reduced to , precipitating as red copper(I) oxide (). The colour change is graded and can be used semi-quantitatively:
- blue — no reducing sugar
- green — very small amount
- yellow — small amount
- orange — moderate amount
- brick red (red precipitate) — large amount
Common reducing sugars are glucose, fructose, maltose, lactose and ribose. Sucrose is a non-reducing sugar because both of its anomeric carbons are involved in the glycosidic bond, so it cannot open to expose a free aldehyde or ketone.
The reduction is slow at room temperature, so the test is heated. CIE specifies a temperature of at least so that the reaction is fast enough to be visible within a few minutes. A boiling water bath (water heated in a beaker on a tripod and gauze) is the safe, standard method — direct heating of a test-tube in a flame risks 'bumping' and ejection of the contents.
Understanding the Question
This part asks for three things: the reagent for the reducing-sugar test, the colour change that signals a positive result, and a description of how to perform the test. The mark is awarded for the description, which must mention both Benedict's solution and a temperature of at least (mark scheme: 'Benedict's AND at least ').
Approach
State the reagent (Benedict's solution), state the colour sequence (blue green yellow orange brick red), then describe the procedure in numbered steps: add reagent, mix, heat in a boiling water bath at , record the final colour.
Step-by-Step Reasoning
- Reagent — Benedict's solution is the standard CIE reagent for the reducing-sugar test (Fehling's solution is rarely used at A-level and would not normally be credited).
- Colour change — when reducing sugar is present, the blue is reduced to red ; the observed colour passes through the sequence green, yellow and orange as the concentration increases.
- Procedure — a workable method is:
- add of the test solution to a test-tube;
- add an equal volume of Benedict's solution;
- place in a boiling water bath at for at least 2 min;
- record the final colour.
Key Takeaways
- The reducing-sugar test uses Benedict's solution heated to .
- A positive result is the sequence blue green / yellow / orange / brick red.
- The intensity of the final colour correlates with the concentration of reducing sugar present.
Common Mistakes
- Writing 'Benedict's reagent' — the conventional A-level name is 'Benedict's solution'.
- Omitting the temperature ('heat gently', 'boil'). The mark scheme specifically requires 'at least '.
- Stating only 'red' for the colour, omitting the intermediate colours.
- Heating the test-tube directly in a Bunsen flame — unsafe and risks loss of marks for 'safe working'.
Things to Be Careful About
- Always state the temperature of the water bath, not just 'heat'.
- The colour sequence should be written in full so the candidate is not penalised for missing an intermediate.
- The description must be a procedure, not a list of what the reagent is.
step 1 Label 4 test-tubes S1, S2, S3 and S4.
step 2 Put of each solution into the appropriately labelled test-tube.
step 3 Carry out the test for reducing sugars on S1, S2, S3 and S4 described in (a)(i).
step 4 Record the colours observed in (a)(iii).
State the reagent or reagents that are used to test for non-reducing sugars and the colour or colours produced if non-reducing sugars are present.
reagent or reagents ______
colour or colours ______
Describe how you will carry out the test for non-reducing sugars.
Answer
reagent or reagents: Benedict's solution (used after acid hydrolysis and neutralisation)
colour or colours: blue green yellow orange brick red (if non-reducing sugar is present)
Description of the test for non-reducing sugars:
- Add of the solution to a clean test-tube.
- Add of dilute hydrochloric acid and heat in a boiling water bath at for about 1 minute. The acid hydrolyses any disaccharide (e.g. sucrose) into its reducing-sugar monosaccharides.
- Slowly add sodium hydrogencarbonate powder, a little at a time, until the mixture stops fizzing (the acid has been neutralised). Then add of Benedict's solution and heat in a boiling water bath for a further 2 minutes.
- A change from blue to green, yellow, orange or brick red indicates that a non-reducing sugar was originally present.
Add dilute HCl and heat; add sodium hydrogencarbonate to neutralise; then carry out Benedict's test as in (a)(i); blue green yellow orange brick red indicates a non-reducing sugar.
Background Concept
A non-reducing sugar is a sugar that has no free aldehyde or ketone group to react with Benedict's solution directly. The most biologically important non-reducing sugar is sucrose, the transport sugar of plants, which is a disaccharide of glucose and fructose joined by an -1,2-glycosidic bond that locks both anomeric carbons.
In dilute acid at high temperature the glycosidic bond is hydrolysed:
The two monosaccharides produced are both reducing sugars and will give a positive Benedict's test.
Benedict's reagent is alkaline (sodium hydroxide / sodium citrate). If acid is left in the solution the ions are not properly complexed and the test does not work. The acid must therefore be neutralised with an alkali (sodium hydrogencarbonate) before adding Benedict's solution.
Understanding the Question
This is a two-step procedure: first hydrolyse any non-reducing sugar to its reducing-sugar components, then do the standard Benedict's test. The mark scheme awards one mark for 'add acid AND heat' and a second for 'add sodium hydrogencarbonate / alkali'. Both halves of each mark point are required.
Approach
Outline the procedure in three stages: (1) acid hydrolysis with HCl and heat, (2) neutralisation with sodium hydrogencarbonate, (3) Benedict's test exactly as in (a)(i). State the colour change expected for a positive result.
Step-by-Step Reasoning
- Hydrolysis — add a small volume of dilute hydrochloric acid to the test solution and heat. The acid and heat together cleave the glycosidic bond of any disaccharide, producing two reducing-sugar monosaccharides.
- Neutralisation — add sodium hydrogencarbonate powder a little at a time. The ions neutralise the from the acid (visible as fizzing, release). The solution must be alkaline for Benedict's reagent to work.
- Benedict's test — add Benedict's solution and heat in a boiling water bath at for at least 2 min. A change from blue to green / yellow / orange / brick red is positive.
A useful control: a solution that was positive in the standard reducing-sugar test (a)(i) will also be positive here, because its reducing sugars are still present after hydrolysis. The non-reducing test is therefore diagnostic only when the original reducing-sugar test was negative.
Key Takeaways
- The non-reducing-sugar test is a Benedict's test performed after acid hydrolysis.
- Hydrolysis: dilute + heat; neutralise with sodium hydrogencarbonate before adding Benedict's.
- A positive result is the same blue-to-brick-red colour sequence as the reducing-sugar test.
Common Mistakes
- Forgetting to neutralise the acid before adding Benedict's — the test fails because the reagent must be alkaline.
- Adding Benedict's before the acid hydrolysis — the test then only detects any pre-existing reducing sugar, not the non-reducing sugar.
- Omitting 'heat' from the hydrolysis step — hydrolysis at room temperature is too slow.
Things to Be Careful About
- CIE marks 'add acid AND heat' as one combined mark point — both halves are required.
- Neutralisation with sodium hydrogencarbonate is a separate mark point — both must appear.
- The final colour sequence is the same as for the reducing-sugar test, so the candidate can refer back to (a)(i).
step 5 Label 4 clean test-tubes S1, S2, S3 and S4.
step 6 Put of each solution into the appropriately labelled test-tube.
step 7 Carry out the test for non-reducing sugars on S1, S2, S3 and S4 described in (a)(ii).
step 8 Record the colours observed in (a)(iii).
step 9 Label 4 clean test-tubes S1, S2, S3 and S4.
step 10 Put of each solution into the appropriately labelled test-tube.
step 11 Carry out the test for starch on S1, S2, S3 and S4.
step 12 Record the colours observed in (a)(iii).
Record your results in an appropriate table.
Answer
Representative results table (the candidate's own observations will depend on the four solutions provided):
| solution | test for reducing sugar (colour) | test for non-reducing sugar (colour) | test for starch (colour) |
|---|---|---|---|
| S1 | orange / brick red | orange / brick red | yellow-brown |
| S2 | blue | orange / brick red | yellow-brown |
| S3 | blue | blue | blue-black |
| S4 | blue | blue | yellow-brown |
Results table with four rows (S1–S4) and three columns (reducing sugar, non-reducing sugar, starch), with the colour observed recorded in each cell; the independent-variable heading ('solution') is written first and the dependent-variable heading ('colour') covers the three test columns.
Background Concept
A results table must record the observation (the dependent variable) for each sample (the independent variable). In CIE practical biology the table convention is:
- the independent-variable (IV) heading comes first;
- the dependent-variable (DV) heading covers the observation column(s);
- every column heading includes a quantity or descriptor and, where relevant, a unit (here the unit is the colour, written in brackets);
- all cells in a column use the same units and consistent precision.
Three food tests are being carried out:
- Benedict's test (after heating) for reducing sugars — positive colours blue green yellow orange brick red.
- Benedict's test after acid hydrolysis for non-reducing sugars — same colour sequence when positive.
- Iodine test for starch — yellow-brown is negative, blue-black is positive.
Understanding the Question
Steps 1–12 of the question give the candidate a procedure to follow. Part (a)(iii) asks them to record the colours observed in an appropriate table. The mark scheme awards marks for: (1) a correct IV heading, (2) a correct DV heading that includes the three test names, and (3–5) correct observations for each of the three tests.
Approach
Draw a four-row by four-column table. The first column is the solution (S1, S2, S3, S4). The next three columns are the three food tests, with 'colour' as a sub-heading that applies to all three. Run the three tests on each solution, observe the final colour, and record it in the appropriate cell.
Step-by-Step Reasoning
- Independent variable (rows) — the four solutions S1, S2, S3, S4. The IV heading ('solution') is written above this column.
- Dependent variable (columns) — the colour observed for each of the three food tests. The DV heading ('colour') is written above the three test columns; the three tests (reducing sugar, non-reducing sugar, starch) are sub-headings of the columns.
- Reducing-sugar test — for each solution, add Benedict's solution and heat; record the final colour.
- Non-reducing-sugar test — for each solution, add dilute HCl, heat, neutralise with sodium hydrogencarbonate, then add Benedict's solution and heat; record the final colour.
- Starch test — for each solution, add a few drops of iodine solution; record the final colour (yellow-brown = negative, blue-black = positive).
Interpretation of the representative results (used to plan the matching in (a)(iv)):
- S1 gives a positive Benedict's test (orange / brick red), so a reducing sugar is present. The non-reducing test is also positive, but the reducing sugars present originally will still be present after hydrolysis, so this result is not informative for non-reducing sugars in S1.
- S2 gives a negative Benedict's test (blue) but a positive result after hydrolysis (orange / brick red): a non-reducing sugar was originally present (e.g. sucrose, hydrolysed to glucose + fructose).
- S3 gives negative sugar tests but a positive iodine test (blue-black): starch is present.
- S4 is negative in all three tests: the solution contains no detectable sugars or starch (consistent with xylem fluid, mostly water and dissolved mineral ions).
Key Takeaways
- A correctly presented results table has the independent-variable heading before the dependent-variable heading.
- The colour observed is the dependent variable; it must be recorded exactly as seen (don't write 'red' if the actual colour is orange).
- A solution that is negative in the reducing-sugar test but positive after acid hydrolysis contains a non-reducing sugar (sucrose is the most common in plants).
Common Mistakes
- Writing the three tests as rows and the four solutions as columns — CIE usually expects solutions down the side and tests across the top, with the IV heading before the DV heading.
- Recording a colour in a cell without including 'blue' as the negative result (the colour of Benedict's solution, or the yellow-brown of iodine).
- Confusing the iodine colours: yellow-brown is the negative result, blue-black is the positive result.
- Writing 'green' for the negative result of the non-reducing-sugar test — it should be 'blue' (Benedict's solution remains blue when no reducing sugar is produced).
Things to Be Careful About
- The heading 'colour' applies to all three test columns — there should not be three separate 'colour' headings.
- Use the colour of the final solution, not the colour while heating.
- After the acid hydrolysis, the fizzing from the sodium hydrogencarbonate must stop before Benedict's is added.
Complete Table 1.2 to suggest which solution (S1, S2, S3 or S4) could represent each of the plant extracts.
Use your results in (a)(iii) and the information on plant transport given in (a).
A solution could represent more than one plant extract.
Table 1.2
| plant extract | solution |
|---|---|
| fluid in the phloem | S... |
| root tissue | S... |
| seed tissue | S... |
| fruit tissue | S... |
| fluid in the xylem | S... |
Answer
Suggested matches using the representative results in (a)(iii):
| plant extract | solution |
|---|---|
| fluid in the phloem | S2 |
| root tissue | S3 |
| seed tissue | S3 |
| fruit tissue | S1 |
| fluid in the xylem | S4 |
Reasoning:
- Phloem transports sucrose, a non-reducing sugar S2 (positive non-reducing-sugar test, negative reducing-sugar test).
- Root tissue stores starch S3 (positive iodine test, negative sugar tests).
- Seed tissue may also store starch S3 (a single solution may represent more than one tissue, as the question allows).
- Fruit tissue contains glucose and fructose, both reducing sugars S1 (positive reducing-sugar test).
- Xylem carries water and dissolved mineral ions, no sugars or starch S4 (negative in all three tests).
Phloem = S2; root = S3; seed = S3; fruit = S1; xylem = S4 (using the representative results; the candidate's own matches depend on their observations).
Background Concept
The question stem gives the biochemistry of each plant extract:
- Phloem fluid — transports sucrose (a disaccharide of glucose + fructose), which is a non-reducing sugar. There are no significant amounts of starch or free reducing sugars in transit.
- Root tissue — stores the carbohydrate received from the phloem as starch (a polysaccharide of -glucose) in storage parenchyma cells.
- Seed tissue — many seeds store the carbohydrate supplied during seed filling as starch (cereals, legumes), though some store oils or proteins; sucrose may also be present during development.
- Fruit tissue — the sugar stored in ripe fruit is largely glucose and fructose, both reducing sugars, which is why fruit tastes sweet and why a ripe apple gives a strong positive Benedict's test.
- Xylem fluid — the xylem carries water and dissolved mineral ions (e.g. , , , ); it carries no organic molecules, so all three food tests should be negative.
Understanding the Question
The candidate must use their own results from (a)(iii) to suggest which of the four solutions could represent each of the five plant extracts. The mark scheme awards marks according to the candidate's own results, so up to 2 marks for having 4 correct matches in the table. The question explicitly allows one solution to represent more than one extract.
Approach
List the dominant biological molecule in each plant extract, then look across the candidate's results table for a solution whose test results match.
Step-by-Step Reasoning
- Phloem fluid contains sucrose (a non-reducing sugar). The matching solution must give a negative reducing-sugar test and a positive non-reducing-sugar test. In the representative results this is S2.
- Root tissue stores starch. The matching solution must give a positive iodine test and negative sugar tests. In the representative results this is S3.
- Seed tissue may also store starch (cereals, peas, beans). It therefore also matches S3 — the question explicitly allows a single solution to stand for more than one extract.
- Fruit tissue contains glucose and fructose (reducing sugars). The matching solution must give a positive reducing-sugar test. In the representative results this is S1.
- Xylem fluid contains only water and mineral ions. The matching solution must be negative in all three food tests. In the representative results this is S4.
Key Takeaways
- A solution that gives a positive Benedict's test after acid hydrolysis but a negative Benedict's test before hydrolysis indicates a non-reducing sugar — the chemical signature of phloem transport fluid.
- A solution that gives a positive iodine test indicates starch — the storage form in roots, tubers and many seeds.
- A solution that gives a positive Benedict's test without hydrolysis indicates a reducing sugar — the form stored in fruit.
- A solution that is negative in all three tests is consistent with xylem fluid.
Common Mistakes
- Matching the phloem to the solution that is positive in the reducing-sugar test — the phloem transports sucrose, which is non-reducing.
- Matching the root to a solution that is positive in the sugar tests — the root stores starch, not free sugar.
- Matching the xylem to a solution that gives a positive test — xylem contains no organic molecules and must be negative in all three food tests.
- Failing to consider that one solution may represent more than one extract (e.g. both root and seed tissue store starch and so both could match the starch-positive solution).
Things to Be Careful About
- The matches must be consistent with the candidate's own results — a different set of observations could legitimately lead to a different set of matches.
- A solution that is positive in the reducing-sugar test cannot be ruled out as a non-reducing-sugar source — both could be present, but the test is not informative once reducing sugars are already there.
- The xylem match must be a solution that is negative in all three tests, not just one or two.
Protein could be present in some of the solutions.
Describe how you would identify which solutions contain protein.
Answer
- Add of the solution to a clean test-tube.
- Add of sodium hydroxide solution and a few drops of dilute copper(II) sulfate solution (or a few drops of Biuret reagent), and mix.
- A change from blue to purple / violet indicates that protein is present.
Add Biuret reagent (sodium hydroxide + copper(II) sulfate); a purple / violet colour indicates the presence of protein.
Background Concept
The Biuret test detects peptide bonds. In a strongly alkaline solution, ions complex with the nitrogen atoms of peptide bonds to form a violet / purple coordination compound. The intensity of the purple colour is roughly proportional to the number of peptide bonds, so the test can be made semi-quantitative with a colorimeter.
The original 'Biuret reagent' is a single solution of in (Rochelle salt) and ; modern A-level specifications often describe the test as two separate solutions (sodium hydroxide followed by copper sulfate), but both formulations give the same purple colour when protein is present.
Understanding the Question
Part (a)(v) asks the candidate to describe how they would identify which of the four solutions contain protein. Two marks are available: one for naming the reagent, one for naming the positive colour.
Approach
State the reagent, describe the procedure, and state the colour change expected for a positive result.
Step-by-Step Reasoning
- Reagent — Biuret reagent (or sodium hydroxide + copper(II) sulfate).
- Procedure — add the reagent to the test solution; the test is usually carried out at room temperature (no heating is required for Biuret).
- Positive result — a purple / violet colour indicates protein is present; the original blue colour of the copper sulfate (Biuret reagent) remains when protein is absent.
Key Takeaways
- The Biuret test detects peptide bonds, not whole proteins per se.
- The positive colour is purple / violet; the negative colour is the original blue of the reagent.
- No heating is required.
Common Mistakes
- Writing 'mauve' or 'lilac' — these are sometimes accepted informally, but the official colour is 'purple' or 'violet'.
- Adding 'and heat' to the procedure — Biuret is performed at room temperature; heating is not required and may decompose the complex.
- Confusing Biuret (protein, purple) with Benedict's (reducing sugar, brick red) — the reagents and colours are different.
Things to Be Careful About
- The mark scheme awards 1 mark for 'biuret' (or equivalent) and 1 mark for 'purple' — both must appear.
- A common alternative wording is to state the two separate solutions ('sodium hydroxide and copper(II) sulfate') rather than the combined Biuret reagent; both are accepted.
A scientist investigated the effect of light on the concentration of sugars in a plant for 24 hours. The plant was kept in the dark for the first 8 hours and then exposed to light for the remaining 16 hours.
Samples were taken from the leaves and from the phloem sieve tubes. The concentration of sugars in each sample was measured.
The results are shown in Table 1.3.
Table 1.3
| time / hours | concentration of sugars / | |
|---|---|---|
| leaves | phloem sieve tubes | |
| 0 | 0.38 | 0.22 |
| 5 | 0.21 | 0.17 |
| 8 | 0.13 | 0.11 |
| 15 | 0.24 | 0.16 |
| 24 | 0.39 | 0.22 |
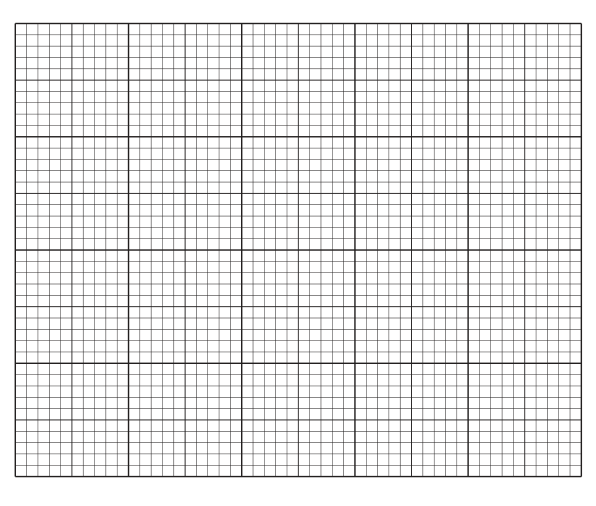
Plot a line graph of the data in Table 1.3 on the grid in Fig. 1.1.
Use a sharp pencil.
Answer
Plot the data as two line graphs on the same axes:
- x-axis: time / hours, scale of to , labelled at every from 0 to 25.
- y-axis: concentration of sugars / , scale of to , labelled at every from 0 to 0.4.
- Leaves (plot as small crosses): (0, 0.38), (5, 0.21), (8, 0.13), (15, 0.24), (24, 0.39). Join with a thin ruled line.
- Phloem sieve tubes (plot as small crosses or circles): (0, 0.22), (5, 0.17), (8, 0.11), (15, 0.16), (24, 0.22). Join with a thin ruled line.
- Label the two lines 'leaves' and 'phloem sieve tubes' (write the label at the end of each line, or include a key).
Two labelled line graphs on shared axes, plotted as described; see diagram.
Background Concept
A line graph is the correct way to display two continuous variables that change together, here time (independent variable) and concentration of sugars (dependent variable). CIE graph conventions for Paper 3 are strict:
- The independent variable is on the x-axis, the dependent variable on the y-axis.
- Each axis has a quantity and a unit in the heading (e.g. 'time / hours', 'concentration of sugars / ').
- The scale is chosen so that the points cover at least half the grid in both directions, and the intervals are 'sensible' (1, 2 or 5 units per 2 cm rather than awkward 3's or 7's).
- Every on the grid has a label on the axis.
- Points are plotted as small, clear crosses (or circled dots); no blob plots, no thick crosses.
- Points are joined with a thin line; a straight ruled line is used when the relationship looks linear and a smooth curve when the relationship is curvilinear. In this question the relationship is curvilinear, so the lines are best drawn as smooth curves through all the points.
- Each line on a multi-line graph must be clearly labelled so that the reader can tell them apart.
Understanding the Question
Table 1.3 gives sugar concentrations in leaves and in phloem sieve tubes at five times over a 24-hour period. The candidate must plot both series on the same axes on the grid in Fig. 1.1, label both axes, scale both axes, plot all 10 points accurately and join the points in each series with a thin line. The marks are awarded for: (1) correct axis labels + line labels, (2) correct scales with regular labels, (3) correct plotting, (4) lines joined with a thin line through every point.
Approach
Set up the axes first (labels, units, scale), then plot the leaves points, then plot the phloem points, then join each series with a thin line. Use a sharp pencil throughout, and label the two lines either at their right-hand end or in a small key.
Step-by-Step Reasoning
- x-axis — label 'time / hours' and choose a scale so that occupies (this is the CIE-preferred scale given in the mark scheme). The 0–25 hour range then occupies 10 cm of the 20 cm available, comfortably half the grid. Label at every (i.e. at 0, 5, 10, 15, 20, 25).
- y-axis — label 'concentration of sugars / ' and choose a scale so that occupies . The 0–0.4 range occupies 8 cm. Label at every (i.e. at 0, 0.1, 0.2, 0.3, 0.4).
- Plot the leaves points — at (0, 0.38), (5, 0.21), (8, 0.13), (15, 0.24), (24, 0.39). Mark each as a small cross.
- Plot the phloem points — at (0, 0.22), (5, 0.17), (8, 0.11), (15, 0.16), (24, 0.22). Mark each as a small cross.
- Join the points in each series with a thin line. The lines do not have to be straight; a smooth curve that passes through every point is best.
- Label the lines — write 'leaves' next to one end of the leaves line and 'phloem sieve tubes' next to one end of the phloem line (or include a small key on the graph).
Key Takeaways
- A CIE line graph requires labelled axes (quantity + unit), a regular scale, accurate plotted points, lines joining every point and a label or key for each line on a multi-line graph.
- The two lines in this graph cross only at the endpoints (both at 0 h and 24 h the phloem value is the same in each case); the leaves line stays above the phloem line throughout the rest of the experiment.
- The two series are plotted on the same axes to make the comparison easy.
Common Mistakes
- Choosing an awkward scale (e.g. 3 h to 2 cm) — CIE examiners look for 1, 2 or 5 units per 2 cm.
- Failing to label the y-axis units ('') — units are part of the heading.
- Drawing blob plots instead of small crosses.
- Drawing a thick, fuzzy line — the line must be thin.
- Omitting the label for each line — both series must be identifiable.
Things to Be Careful About
- The y-axis must include the unit '' (micromoles), not just 'concentration'.
- The x-axis must include the unit 'hours', not just 'time'.
- A line that does not pass exactly through every plotted point will lose the 'line through every point' mark — the curve must be redrawn to pass through each point.
- The two lines should be distinguishable in the final printed version (e.g. one continuous and one continuous, but with a clear label on each).
Describe the trend for the concentration of sugars in the leaves and phloem sieve tubes shown in Fig. 1.1.
Answer
- The concentration of sugars in both the leaves and the phloem sieve tubes decreases during the first 8 hours (the dark period) and then increases from 8 to 24 hours (the light period).
- The concentration of sugars in the leaves is higher than in the phloem sieve tubes at every time point.
Both the leaves and the phloem concentration of sugars decrease for the first 8 hours and then increase; the leaves concentration is higher than the phloem concentration throughout.
Background Concept
A 'trend' describes the overall pattern of change of the dependent variable across the range of the independent variable. For this graph the independent variable is time, so the trend is read by following the curves from left to right. The minimum of each curve occurs at , which is exactly when the dark period ends and the light period begins.
A 'comparison' describes the relationship between the two series at any given time. In this graph the leaves curve lies above the phloem curve at every measured time.
Understanding the Question
Part (b)(ii) asks for a one-mark description of the trend shown in Fig. 1.1. The mark scheme accepts either of two equivalent observations: (1) the concentration decreases for 8 hours and then increases, or (2) the leaves concentration is higher than the phloem concentration over 24 hours. Either one of these is worth the mark.
Approach
Look at the shape of the two curves. Both fall to a minimum at 8 h and then rise to a maximum at 24 h. The leaves curve lies above the phloem curve at all measured times.
Step-by-Step Reasoning
- Trend in time — both curves fall from 0 h to 8 h and then rise from 8 h to 24 h. This is a 'V-shape' (or 'valley') pattern.
- Comparison between series — at every one of the five measured times, the leaves concentration is greater than the phloem concentration. The differences are 0.16, 0.04, 0.02, 0.08 and 0.17 μmol at the five times respectively.
A simpler answer: 'The concentration of sugars in both leaves and phloem sieve tubes decreases for the first 8 hours and then increases.' This single sentence captures the main trend and earns the mark.
Key Takeaways
- Trends on a time-course graph are read by following the curve from left to right.
- The minimum of the curves corresponds to the end of the dark period; the maximum corresponds to the end of the light period.
- 'Higher than' is a valid comparative trend description.
Common Mistakes
- Stating a 'trend' as a single value (e.g. 'the concentration is 0.38 at 0 h') — that is a reading, not a trend.
- Saying the concentration 'stays the same' or 'fluctuates' — the graph shows a clear fall then rise.
- Confusing the two series and describing the phloem line as if it were the leaves line.
Things to Be Careful About
- The mark is for any one of the two accepted trends; the candidate can write either to earn the mark.
- The description should be in continuous prose, not in table form.
Suggest an explanation for the trend in the data when the plant was in the dark and when the plant was in the light.
plant in the dark ______
plant in the light ______
Answer
plant in the dark — No photosynthesis is occurring, so the leaves are not making sugars. Sugars already in the leaves continue to be used in respiration and are loaded into the phloem for transport to the rest of the plant, so the concentration of sugars in both the leaves and the phloem sieve tubes falls.
plant in the light — Photosynthesis in the leaves produces sugars. The sugars are loaded into the phloem sieve tubes (translocation) and transported away, but the rate of production in the leaves exceeds the rate of export, so the concentration of sugars in both the leaves and the phloem sieve tubes rises.
Dark: no photosynthesis, so no sugars are produced; existing sugars are respired or transported away, so the concentration falls. Light: photosynthesis produces sugars which are loaded into the phloem (translocation) and transported, raising the concentration.
Background Concept
Two plant processes determine the concentration of sugars in the leaves and the phloem:
- Photosynthesis fixes into triose phosphate, which is then converted to sucrose in the mesophyll cells. This process requires light.
- Respiration consumes sugars to release energy and produce . This process occurs in the dark as well as in the light.
- Translocation is the mass flow of sucrose (and other solutes) through the phloem sieve tubes from 'sources' (e.g. mature leaves, where sugar is made or released from storage) to 'sinks' (e.g. roots, fruits, developing seeds and growing tips). The loading of sucrose into the phloem at the source raises the solute concentration in the sieve tubes, drawing water in by osmosis and generating the turgor pressure that drives mass flow.
The concentration in any compartment at any moment reflects the balance between (i) inputs (photosynthesis, import from another compartment) and (ii) outputs (respiration, export to another compartment).
Understanding the Question
Part (b)(iii) asks for an explanation of the dark-period and light-period trends in terms of the underlying biology. The mark scheme awards 1 mark for the dark explanation and 1 mark for the light explanation.
Approach
For each period, name the dominant process and the resulting net change in sugar concentration. Link the change in the leaves to the change in the phloem through the source-sink relationship.
Step-by-Step Reasoning
Dark period (0 h to 8 h)
- Photosynthesis stops because there is no light.
- Respiration continues, so sugars already in the leaves are being consumed.
- Sugars continue to be loaded into the phloem and exported to sinks, but no new sugars are coming in from photosynthesis.
- The net result: the sugar concentration in the leaves falls, and because less sugar is being loaded into the phloem, the concentration in the phloem also falls.
Light period (8 h to 24 h)
- Photosynthesis resumes and produces sugars in the mesophyll cells.
- These sugars are loaded into the phloem sieve tubes (translocation) and transported to sinks.
- The rate of production in the leaves exceeds the rate of export plus respiration, so the sugar concentration in the leaves rises; the increased loading raises the concentration in the phloem, so the phloem concentration also rises.
Key Takeaways
- The concentration of sugars in any compartment is a balance between input (photosynthesis) and output (respiration + export).
- In the dark, only respiration and export operate, so the concentration falls.
- In the light, photosynthesis dominates, so the concentration rises.
- The phloem concentration follows the leaves concentration because the phloem is the export route from the leaves.
Common Mistakes
- Saying the concentration falls in the dark because the plant 'stops respiring' — respiration continues in the dark.
- Saying the concentration rises in the light only because the plant 'stops respiring' — respiration continues in the light too; the rise is because photosynthesis is faster than respiration + export.
- Failing to mention translocation / phloem loading when explaining the rise in the phloem concentration.
- Confusing the leaves and phloem series and describing the phloem trend as if it were the leaves trend.
Things to Be Careful About
- The CIE mark scheme phrases both explanations in terms of sugar production, consumption and transport — use this vocabulary.
- A common alternative accepted by CIE is to say that 'sugars move from leaves to phloem by translocation' in the light period; this is the same idea as 'loaded into the phloem sieve tubes' but phrased from the perspective of movement.
- Both explanations should be specific to the dark and the light, not generic statements about photosynthesis.
Calculate the percentage increase in the concentration of sugars in the leaves between 15 and 20 hours.
Show your working.
percentage increase = ______ %
Working
- At 15 hours the concentration of sugars in the leaves is given in the table as .
- At 20 hours, read the value from the graph. The leaves line lies between the (15, 0.24) and (24, 0.39) points; the value at 20 hours is approximately .
- Apply the percentage increase formula:
Answer
percentage increase = 33.3 % (approximately 33 %; the exact answer depends on the candidate's own reading at 20 hours).
≈ 33 % (based on a 20-hour reading of 0.32 μmol; the candidate's own answer depends on their reading from the graph).
Background Concept
Percentage increase is the change in a quantity expressed as a percentage of the original value:
The two values that go into the formula are the original value (at the start of the interval, here 15 hours) and the new value (at the end of the interval, here 20 hours). The 15-hour value is given directly in the table; the 20-hour value must be read from the graph because no 20-hour measurement was taken.
Understanding the Question
Part (b)(iv) gives the 15-hour value (0.24) and asks for the percentage increase to the 20-hour value. The 20-hour value is not in the table; the candidate must read it from their own line graph. The mark scheme awards 1 mark for using 0.24 and the 20-hour value, and 1 mark for showing the formula and multiplying by 100.
Approach
Read the 20-hour value from the leaves line, then substitute into the percentage increase formula. Show all the working so the marks for 'using 0.24' and 'showing the formula' can be credited.
Step-by-Step Reasoning
- Start value — at 15 h (from Table 1.3).
- End value — read from the leaves line at 20 h. The 20-hour point lies on the straight line segment between (15, 0.24) and (24, 0.39). Linear interpolation gives:
So a reasonable reading is at 20 h. Acceptable readings in practice are in the range .
- Substitute into the formula:
Key Takeaways
- Percentage increase = (new − original) / original × 100.
- When a value is not given in the table, it must be read from the candidate's own graph; the result is therefore approximate.
- The mark scheme requires the candidate to show the substitution of both 0.24 and the 20-hour reading, and the multiplication by 100, to earn both marks.
Common Mistakes
- Using 24 hours instead of 20 hours as the end point — the question asks for the increase between 15 and 20 hours, not between 15 and 24 hours.
- Dividing by the new value instead of the original value — this gives the percentage decrease, not the percentage increase.
- Forgetting to multiply by 100, leaving the answer as 0.33 instead of 33 %.
- Using the phloem value (0.16 at 15 h) instead of the leaves value (0.24) — the question specifies 'concentration of sugars in the leaves'.
Things to Be Careful About
- The candidate's own answer will depend on the 20-hour reading from their own graph. A reading of 0.31 gives 29.2 %; a reading of 0.33 gives 37.5 %. Any of these is acceptable as long as the working is shown.
- The end-of-pipe answer must be a percentage — write the '%' symbol explicitly.
- Significant figures: the original value 0.24 has two significant figures, so the final answer should be quoted to two or three significant figures (≈ 33 %).
L1 is a slide of a stained transverse section through a plant organ.
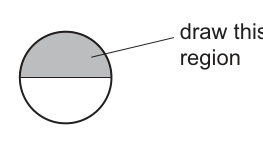
Draw a large plan diagram of the region on L1 indicated by the shaded area in Fig. 2.1.
Use a sharp pencil.
Use one ruled label line and label to identify one vascular bundle.
Answer
A large plan diagram of the shaded sector drawn with a sharp pencil and no shading:
- Epidermis: outer boundary drawn as two close parallel lines, with small protrusions (trichomes) projecting outward at intervals.
- Cortex: a narrow band of tissue inside the epidermis.
- Vascular bundles: of two distinct sizes, arranged at the bulges/corners and between the bulges; each bundle has a darker sclerenchyma cap on its outer side.
- Pith: the central region, outlined only — no individual cells drawn.
- One ruled label line pointing to one vascular bundle, labelled 'vascular bundle'.
Plan diagram of the shaded sector showing epidermis with trichomes, cortex, vascular bundles of two sizes at the corners and between them with sclerenchyma caps, and central pith; vascular bundle labelled.
Background Concept
A plan diagram is a low-magnification drawing of a specimen (usually a tissue section) that shows the distribution and arrangement of tissues without drawing any individual cells. It is drawn with a sharp pencil using single continuous lines to outline each tissue region, with no shading, no hatching, and no colour. Plan diagrams are used to show the overall organisation of a specimen — for example, the positions of vascular bundles, the thickness of the cortex, and the extent of the pith in a stem cross-section.
In a young dicot stem (such as sunflower, Helianthus), the cross-section is often square in outline with four bulges at the corners. The epidermis is the outermost layer and may carry trichomes (small hair-like outgrowths). Inside the epidermis lies the cortex. The vascular bundles are arranged around a central pith. In young stems with bulges, the vascular bundles are of two distinct sizes: larger at the corners and smaller between the bulges. Each vascular bundle typically has a sclerenchyma cap on its outer side for support.
Understanding the Question
L1 is a slide of a stained transverse section through a plant organ. Fig. 2.1 shows the whole cross-section with a shaded sector at the top — that shaded sector is the region you must draw. You must produce a plan diagram (no cells, no shading) showing the correct arrangement and proportions of the tissues, and you must use one ruled label line to identify one vascular bundle. Marks are awarded for: (1) appropriate size and no shading; (2) correct section of the organ; (3) correct pattern and proportions of vascular bundles; (4) epidermis drawn with two lines and trichomes; (5) label line and label to a vascular bundle.
Approach
Look down the microscope at L1 and identify the shaded region. Trace the outer boundary (epidermis with trichomes), then mark the inner edge of the cortex. Locate the vascular bundles in the region — note their sizes and positions. Mark the boundary of the pith. Draw the whole sector at a size that fills most of the space available, with no shading and no individual cells. Add one ruled label line to a vascular bundle.
Step-by-Step Reasoning
- Appropriate size and no shading — the plan diagram should occupy most of the available space; use sharp pencil lines only and contain no shading, hatching, or colour.
- Correct section of the organ — only the shaded sector should be drawn; proportions within the sector must match what you observe on the slide.
- Correct pattern and proportions of vascular bundles — show the vascular bundles at the bulges and between the bulges, with larger bundles at the corners drawn larger than those between; do not draw individual cells inside the bundles.
- Epidermis and trichomes — the outermost layer is drawn as two parallel lines (representing the outer and inner surfaces of the epidermal cell walls); small protrusions on the outer side represent trichomes.
- One ruled label line — a single horizontal line drawn with a ruler from the label 'vascular bundle' to one of the vascular bundles in your drawing.
Key Takeaways
- A plan diagram shows tissues, not cells.
- Use a sharp pencil, no shading, continuous lines.
- Draw double lines for the epidermis.
- Preserve correct tissue proportions.
- Labels should be on ruled lines, with the line ending exactly on the structure being labelled.
Common Mistakes
- Drawing individual cells inside the plan diagram (this turns it into a high-power drawing, not a plan).
- Shading any region — plan diagrams must be line-only.
- Missing the trichomes or drawing them as full cell-like structures.
- Drawing the vascular bundles all the same size when they should be of two sizes (large at corners, small between bulges).
- Using freehand label lines instead of ruled ones.
Things to Be Careful About
- Make the diagram large enough to fill most of the available space.
- Use only a sharp pencil so the lines are clean and continuous.
- Trichomes are drawn as small protrusions on the outer surface — not as full cells.
- The label line must actually touch one of the vascular bundles in your drawing.
- Do not add any colour, hatching, or shading to the plan diagram.
Observe the xylem vessel elements in the organ on L1.
Select a line of four adjacent xylem vessel elements.
Each xylem vessel element must touch at least one other xylem vessel element.
- Make a large drawing of this line of four xylem vessel elements.
- Use one ruled label line and label to identify the wall of one xylem vessel element.
Answer
A large drawing of four adjacent xylem vessel elements, each touching at least one other, drawn with sharp, continuous lines.
- Only four xylem vessel elements drawn.
- Each cell has a polygonal shape (typically pentagonal or hexagonal).
- Two lines drawn around each xylem vessel element (double line for the cell wall).
- Three lines drawn where two xylem vessel elements touch (the two walls become one line, plus one line on each side from the lumens).
- Each cell has a clear central lumen.
- One ruled label line points to the wall of one xylem vessel element.
Large drawing of four adjacent xylem vessel elements (each touching at least one other) with polygonal shape, double lines for walls, three lines where touching, and the wall labelled.
Background Concept
A high-power (cellular) drawing shows individual cells with their walls clearly drawn. The convention is to use two parallel lines to represent the cell wall (one line for each side of the wall). Where two adjacent cells meet, the two walls lie close together and only one line is drawn for them, but the lumen of each cell adds a further line, so three lines appear in total at the boundary between two cells. Cells must be drawn with sharp, continuous lines and the correct shape — xylem vessel elements are polygonal (often pentagonal or hexagonal) in cross-section because they fit together under turgor pressure when young.
Understanding the Question
You must observe the xylem vessel elements on slide L1 under high power, select a line of four adjacent elements where each touches at least one other, and make a large drawing following the conventions. Marks are awarded for: (1) appropriate size and sharp continuous lines; (2) only four elements drawn, each touching at least one other; (3) double lines around each element and triple lines where elements touch; (4) correct polygonal shape; (5) label line and label to the wall.
Approach
Use the high-power objective to look at the xylem on L1. Choose a line of four xylem vessel elements that form a chain. Draw them large and close together, ensuring each cell touches at least one other. Use double lines around each, triple lines where cells touch. Draw the correct polygonal shape. Add one ruled label line to the wall of one cell.
Step-by-Step Reasoning
- Appropriate size and sharp continuous lines — draw large so that details (lumen, walls) are visible; lines should be sharp and continuous, with no gaps, feathery strokes, or shading.
- Only four xylem vessel elements — do not draw more than four; each element must touch at least one other (no isolated cells, no cells separated by gaps).
- Double lines around each, three lines where touching — the wall of each cell is drawn as two close parallel lines; where two cells meet, the two walls become one line in the middle, but each lumen contributes a line, giving three lines in total.
- Correct polygonal shape — xylem vessel elements are polygonal in cross-section (often pentagonal or hexagonal), not circular.
- Ruled label line — draw a horizontal line with a ruler from the label 'wall' to the wall of one xylem vessel element.
Key Takeaways
- High-power drawings show cells with double-line walls.
- Where two cells meet, three lines are drawn (two walls + lumens).
- Cells must be drawn with the correct shape (polygonal for xylem).
- Labels use ruled lines.
- No shading or colouring.
Common Mistakes
- Drawing single lines for cell walls (this loses the convention).
- Drawing only two lines where two cells touch (forgetting the lumen line on each side).
- Drawing the cells as circles instead of polygonal.
- Drawing more than four cells.
- Using freehand label lines.
- Labelling the lumen or cytoplasm instead of the wall.
Things to Be Careful About
- Make the drawing large enough to fill most of the space.
- Each cell must touch at least one other — no isolated cells.
- Double-check the convention: three lines where two cells touch (the walls become one line, plus one line on each side from the lumens).
- Use a sharp pencil for crisp lines.
- The label must point to an actual wall, not to the lumen.
Answer
Organ = stem
Reason: Vascular bundles are arranged around a central region of parenchyma cells (pith).
Stem — vascular bundles arranged around a central pith.
Background Concept
A transverse section through a plant organ shows distinct features that allow you to identify whether it is a root, stem, or leaf. Stems typically have vascular bundles arranged around a central pith, with the phloem on the outside and xylem on the inside of each bundle. Many stems also carry trichomes (hair-like outgrowths) on the epidermis. Roots, by contrast, have a central xylem with phloem between the arms of an X or Y shape, and lack trichomes. Leaves have vascular bundles embedded in mesophyll, with distinct palisade and spongy layers.
Understanding the Question
You must look at slide L1 and decide which plant organ it is, giving one specific observable reason.
Approach
Examine the slide under low power. Identify the vascular bundles and note their arrangement relative to the central tissue. Look for trichomes on the outer surface. Note the overall shape of the cross-section.
Step-by-Step Reasoning
- Observe the arrangement of the vascular bundles — they form a ring around the centre of the section, with the central tissue made up of parenchyma cells (the pith).
- Note that this arrangement is characteristic of a young dicot stem (not a root, where xylem is central, nor a leaf, where vascular bundles are scattered or form a single ring inside mesophyll).
- Trichomes on the epidermis further confirm this is a stem (roots typically lack such trichomes).
- Therefore, the organ is a stem.
Key Takeaways
- Stems have vascular bundles arranged around a central pith.
- Trichomes on the epidermis are a stem feature.
- Roots have central xylem with phloem between the arms.
Common Mistakes
- Confusing stem with root because of the central vascular cylinder in roots.
- Stating a reason that is not observable (e.g., 'transports water' is a function, not an observable feature).
- Failing to give a reason at all.
Things to Be Careful About
- Give a specific observable feature as the reason.
- The reason should be observable on the slide, not a function of the organ.
Fig. 2.2 is a photomicrograph of a stained transverse section of the same organ from a different plant to L1.
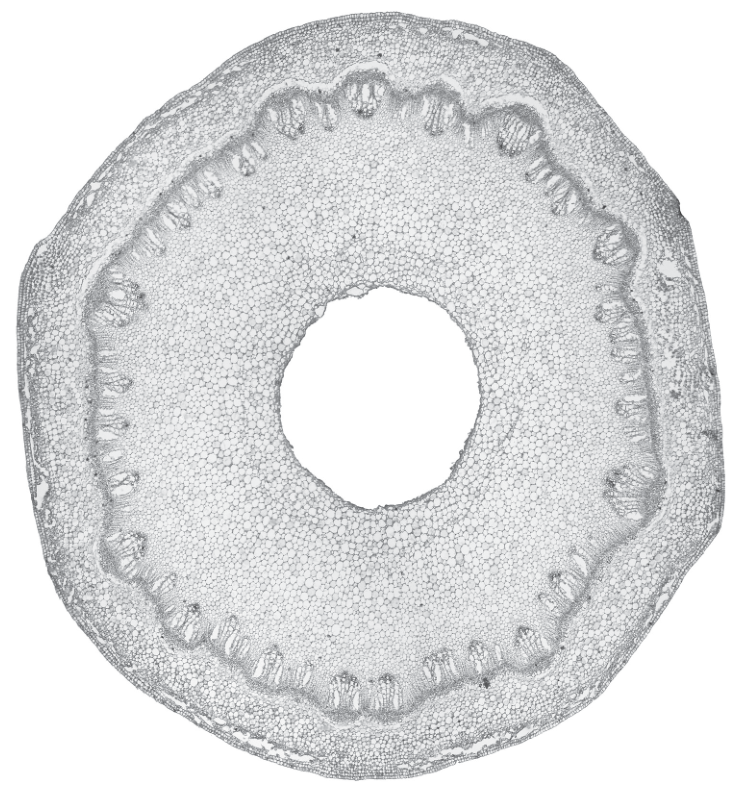
Identify two observable differences, other than colour, between the section on L1 and the section in Fig. 2.2.
Record these two observable differences in Table 2.1.
Table 2.1
| feature | L1 | Fig. 2.2 |
|---|---|---|
| 1 | ||
| 2 |
Answer
| feature | L1 | Fig. 2.2 |
|---|---|---|
| 1 shape of cross-section | square (with bulges at corners) | circular |
| 2 central tissue | has cells (pith) | no cells (hollow) |
Two observable differences:
- Shape: L1 is square in outline (with bulges at the corners), whereas Fig. 2.2 is circular.
- Central tissue: L1 has a central region of parenchyma cells (pith), whereas Fig. 2.2 has a hollow central region (no cells).
- Shape: L1 square (with bulges), Fig. 2.2 circular. 2. Central tissue: L1 has cells (pith), Fig. 2.2 has no cells (hollow).
Background Concept
When comparing two specimens, observable differences are those that can be seen under the microscope without taking colour into account. Features typically compared include: overall shape of the section, arrangement and size of vascular bundles, presence or absence of structures such as trichomes or stomata, presence or absence of a central pith (cells vs hollow), thickness of the cortex, and position of vascular tissue.
Understanding the Question
L1 is the slide you observed under the microscope. Fig. 2.2 is a photomicrograph of a stained transverse section of the same organ (a stem) from a different plant. You must identify two observable differences, other than colour, and record them in Table 2.1.
Approach
Look at L1 under the microscope and at Fig. 2.2 (a photomicrograph). Note the overall shape, the arrangement and size of the vascular bundles, and the central tissue. Pick two clear, observable differences and record them in the table.
Step-by-Step Reasoning
- Shape of the section — L1 has a square outline (with bulges at the corners); Fig. 2.2 has a circular outline.
- Central tissue — L1 has a central pith made of cells; Fig. 2.2 has a hollow central region with no cells.
- Other possible differences include: vascular bundles of two sizes in L1 vs same size in Fig. 2.2; vascular bundles at corners and between bulges in L1 vs in a ring in Fig. 2.2; presence of trichomes in L1 vs absent in Fig. 2.2.
Key Takeaways
- When comparing specimens, focus on observable features only.
- Do not include colour as a difference unless asked.
- Use a table to record the differences clearly.
Common Mistakes
- Including colour as a difference (this is excluded by the question).
- Giving differences that are not observable (e.g., functional differences such as 'rate of transpiration').
- Giving only one difference instead of two.
- Recording only one side of the comparison (e.g., only describing L1).
Things to Be Careful About
- Differences must be observable on the specimens, not inferred from function.
- Differences must be specific (e.g., 'vascular bundles in a ring' rather than 'vascular bundles different').
- Use clear language to describe each difference.
Fig. 2.3 shows a photomicrograph of a stage micrometer scale that is being used to calibrate an eyepiece graticule.
One division, on either the stage micrometer scale or the eyepiece graticule, is the distance between two adjacent lines.
The length of one division on the stage micrometer in Fig. 2.3 is .
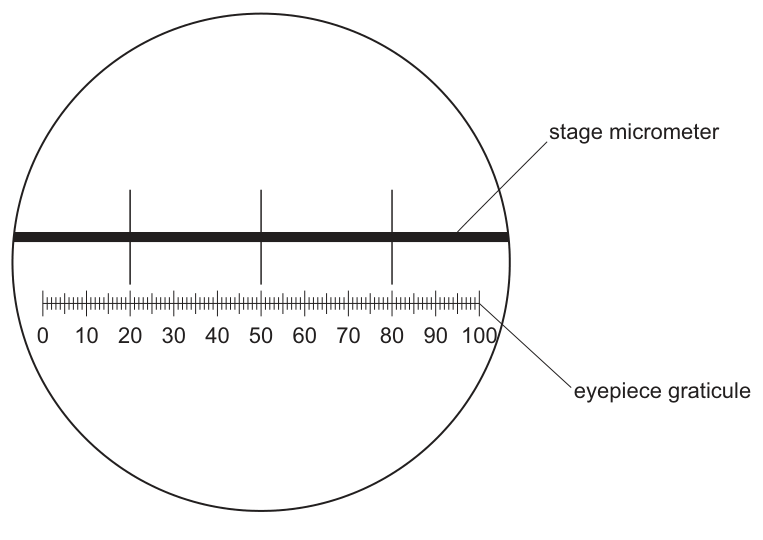
Calculate the actual length of one eyepiece graticule unit shown in Fig. 2.3.
Give your answer in micrometres ().
Show your working.
actual length = ______
Working
From Fig. 2.3:
- 100 eyepiece graticule units align with 3 large divisions of the stage micrometer.
- 1 stage micrometer division = .
Total length spanned by 100 eyepiece units = .
Answer
actual length =
30 μm
Background Concept
An eyepiece graticule is a small glass disc with a scale (typically 100 divisions) that fits inside the microscope eyepiece. Because the graticule is in the eyepiece, its apparent size changes with magnification, so each division does not have a fixed actual length. To find the actual length of one graticule division at a particular magnification, you calibrate it against a stage micrometer — a slide with a precisely known scale (here, 1.0 mm per division).
Understanding the Question
Fig. 2.3 shows the eyepiece graticule (numbered 0–100) aligned against a stage micrometer with large divisions of 1.0 mm each. You must calculate the actual length of one eyepiece graticule unit in micrometres (μm).
Approach
Identify how many eyepiece graticule units span a known distance on the stage micrometer. Divide the known length by the number of eyepiece units. Convert to μm.
Step-by-Step Reasoning
- From Fig. 2.3, 100 eyepiece graticule units (0 to 100) align with 3 large divisions of the stage micrometer.
- Each large division on the stage micrometer = 1.0 mm = 1000 μm.
- Total length spanned by 100 eyepiece units = 3 × 1000 μm = 3000 μm.
- Length of one eyepiece graticule unit = 3000 μm ÷ 100 = 30 μm.
Key Takeaways
- Eyepiece graticule units have no fixed actual size — they must be calibrated.
- Calibration uses a stage micrometer with a known scale.
- 1 mm = 1000 μm (use this conversion in the answer).
- The calibration only applies to the same microscope and lens combination used to take the calibration image.
Common Mistakes
- Forgetting to convert mm to μm in the final answer.
- Using the wrong number of eyepiece units (e.g., counting only part of the graticule).
- Dividing the wrong way (e.g., 100 ÷ 3 instead of 3000 ÷ 100).
- Not showing the working.
Things to Be Careful About
- Show your working clearly with units at every step.
- Make sure the calibration is for the same microscope/lens combination used later in the question.
- The answer must be in μm.
Fig. 2.4 is the same photomicrograph as that shown in Fig. 2.2. This was taken with the same microscope and the same lenses used to take the photomicrograph in Fig. 2.3. The eyepiece graticule has been placed across the width of the tissue.
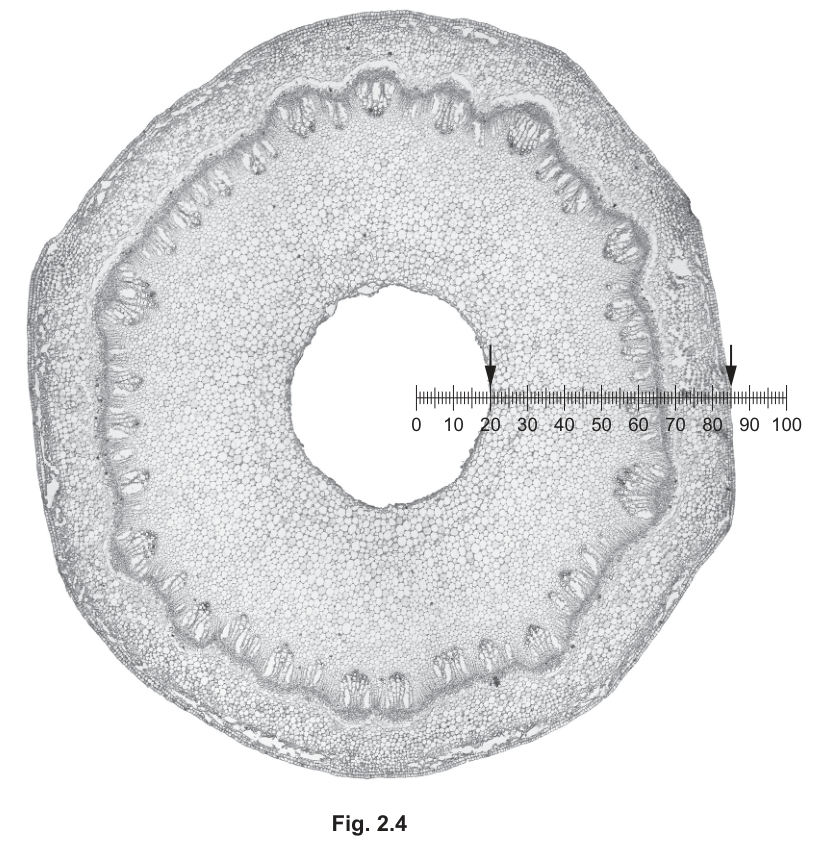
Use your calibration of one eyepiece graticule unit from (c)(i) to calculate the actual width of the tissue between the arrows on Fig. 2.4.
Show your working and use appropriate units.
actual width of the tissue between the arrows = ______
Working
From Fig. 2.4:
- The eyepiece graticule is placed across the tissue.
- First arrow at approximately 20 eyepiece graticule units.
- Second arrow at approximately 85 eyepiece graticule units.
- Width in eyepiece graticule units = units.
From (c)(i): 1 eyepiece graticule unit = .
Answer
actual width of the tissue between the arrows = (or )
1.95 mm (1950 μm)
Background Concept
Once an eyepiece graticule has been calibrated (i.e., the actual length of one division is known), it can be used to measure the actual size of any structure viewed with the same microscope and same lenses. The procedure is to count the number of graticule units spanned by the structure, then multiply by the actual length of one unit. Note that 1 mm = 1000 μm, so for tissue-scale measurements mm is often the more convenient unit.
Understanding the Question
Fig. 2.4 is the same photomicrograph as Fig. 2.2, taken with the same microscope and lenses used for Fig. 2.3. The eyepiece graticule has been placed across the tissue, and two arrows mark the boundaries of the tissue width to be measured. You must use your calibration from (c)(i) to calculate the actual width.
Approach
Count the eyepiece graticule units between the two arrows. Multiply by the calibration factor (actual length of one unit from (c)(i)). Give the answer in appropriate units.
Step-by-Step Reasoning
- From Fig. 2.4, the first arrow is at approximately 20 eyepiece units and the second arrow is at approximately 85 eyepiece units.
- Width in eyepiece units = 85 − 20 = 65 units.
- From (c)(i), 1 eyepiece unit = 30 μm.
- Actual width = 65 × 30 μm = 1950 μm = 1.95 mm.
Key Takeaways
- Calibration only works with the same microscope and lens combination.
- Read off the number of units spanned and multiply by the calibration.
- Use μm for small measurements, mm for larger ones.
Common Mistakes
- Reading the graticule incorrectly (e.g., including parts not between the arrows).
- Forgetting to subtract the starting position from the ending position.
- Using the wrong calibration factor.
- Not including units in the final answer.
Things to Be Careful About
- The arrows are at specific positions on the graticule — read them carefully.
- Show your working clearly with units.
- The answer can be given in μm or mm (1 mm = 1000 μm).
The width of the tissue in Fig. 2.4 varies. Suggest how you could more accurately calculate the width of the tissue.
Answer
Take three measurements of the width of the tissue at different positions and calculate the mean.
Take 3 measurements and calculate the mean.
Background Concept
When measuring an irregular structure, the width can vary from one position to another. To obtain a more accurate value, you should take multiple measurements across the structure and calculate a mean (average). The mean reduces the effect of random variation and gives a better estimate of the true width.
Understanding the Question
The width of the tissue in Fig. 2.4 varies across the section. You must suggest how to more accurately calculate the width.
Approach
Recognise that a single measurement at one position is unlikely to be representative of the whole tissue. Take several measurements at different positions and average them.
Step-by-Step Reasoning
- The tissue is not uniform in width — it varies across the section.
- A single measurement at one position is therefore unreliable.
- To get a more accurate value, take three or more measurements at different positions across the tissue.
- Calculate the mean of these measurements to get a representative value.
Key Takeaways
- Multiple measurements improve accuracy.
- The mean is a better estimate than a single value.
- Take measurements at different positions for irregular structures.
Common Mistakes
- Vague suggestions like 'be more careful' or 'use better equipment' (not specific to the problem).
- Suggesting only one additional measurement (a single extra measurement is not enough — at least three are needed for a mean).
- Failing to mention the mean (averaging is essential).
Things to Be Careful About
- Be specific: state the number of measurements (e.g., three) and the calculation (e.g., mean).
- The suggestion must address the variability of the tissue width.