Biology 9700/13 — October/November 2025
Cambridge AS Level · Multiple Choice (AS Level) · answer key with instant marking and worked solutions
Topics Cell Structure · Biological Molecules · Nucleic Acids and Protein Synthesis · Cell Membranes and Transport · Enzymes · The Mitotic Cell Cycle · +5 more
Tap an option under each question to check it — your score builds as you go.
The diagram shows a stage micrometer, with divisions apart, viewed through an eyepiece containing a graticule.
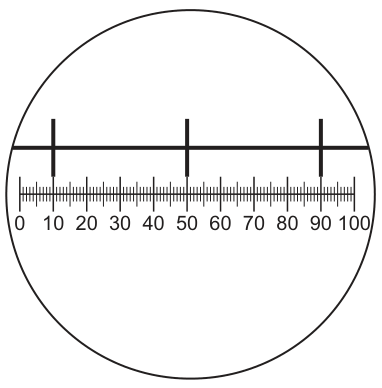
The same eyepiece is now used to examine a blood smear.
How many graticule divisions will cover the diameter of a lymphocyte of ?
Options
A 1
B 4
C 10
D 20
Working
The two large marks of the stage micrometer are 0.1 mm apart. From Fig. 1.1, 0.1 mm on the stage micrometer spans 40 eyepiece-graticule divisions.
So 1 graticule division represents:
A lymphocyte of diameter 10 µm therefore covers:
Answer
B
B
Background Concept
An eyepiece graticule is a tiny scale etched onto a glass disc that sits inside the eyepiece of a microscope. It appears superimposed over the specimen every time you look down the microscope, and it lets you measure a length in the field of view. Crucially, the graticule is not a fixed ruler: the same graticule line corresponds to a different real length at every objective magnification. So before it can be used, it must be calibrated against a stage micrometer — a glass slide carrying an accurately known scale (here, lines 0.1 mm = 100 µm apart).
The calibration is done in two steps:
- With the stage micrometer on the stage, count how many graticule divisions coincide with a known distance on the stage micrometer (e.g. 0.1 mm).
- Divide the known distance by the number of graticule divisions to give the real length of one graticule division at that objective.
Once calibrated, the graticule is used in place of the stage micrometer to measure any structure of interest. Remember to reconfirm the calibration whenever you change objective lens, because the graticule does not rescale itself.
Understanding the Question
Fig. 1.1 shows the graticule (0 – 100) overlaid on the stage micrometer. The stage micrometer's large marks are 0.1 mm apart, and these marks fall on graticule positions that you read off the figure. The question then takes the calibrated graticule and asks: how many graticule divisions will span a lymphocyte whose real diameter is 10 µm?
This is a two-step problem:
- Calibration — use the stage-micrometer reading to find the µm-per-graticule-division at this magnification.
- Application — convert the lymphocyte's 10 µm diameter into graticule divisions using that calibration.
The command word is "how many", so a numerical value (an integer or a single option letter) is required.
Approach
- Read off how many graticule divisions lie between two adjacent large stage-micrometer marks (the 0.1 mm distance).
- Convert 0.1 mm to µm so the units are compatible with the lymphocyte.
- Divide to obtain the length of one graticule division in µm.
- Divide the lymphocyte's 10 µm by that length to obtain the number of graticule divisions.
Step-by-Step Reasoning
Step 1 – Read the calibration from Fig. 1.1.
The two large stage-micrometer marks (0.1 mm apart) line up with graticule positions 10 and 50. The separation in graticule divisions is therefore:
(Equivalently, the third mark at 90 confirms the same spacing: 90 − 50 = 40.)
Step 2 – Convert 0.1 mm to µm.
Step 3 – Calculate the real length of one graticule division.
Step 4 – Apply the calibration to the lymphocyte.
The lymphocyte's diameter is 10 µm, so the number of graticule divisions it covers is:
Step 5 – Match to the options.
4 divisions → option B.
Quick check on the other options
- A (1 division): would correspond to a 2.5 µm cell — too small for a lymphocyte.
- C (10 divisions): would correspond to a 25 µm cell — closer to a red blood cell or a much larger object; not a lymphocyte.
- D (20 divisions): would correspond to a 50 µm cell — far too big.
Key Takeaways
- An eyepiece graticule must be calibrated with a stage micrometer at every magnification before it can be used as a measuring tool.
- The calibration rule is: (real length of one graticule division) = (known stage-micrometer distance) ÷ (number of graticule divisions that span it).
- Always convert units so the calibration and the specimen are in the same units (mm ↔ µm: ×1000 or ÷1000). Mixing the two is the single most common error in this type of question.
- The same calibration cannot be reused after changing the objective lens — you must recalibrate.
Common Mistakes
- Forgetting the unit conversion. Treating 0.1 mm as if it were 0.1 µm gives 1 division per µm and leads to the wrong answer (C = 10). Always convert mm to µm (or vice versa) before dividing.
- Reading the graticule the wrong way around. CIE examiners routinely reverse the role of the two scales; make sure you are dividing the stage-micrometer distance by the graticule count, not the other way round.
- Reusing a previous magnification's calibration. Each objective has its own µm/division value. The value here (2.5 µm/division) applies only at the magnification used to take Fig. 1.1.
- Confusing lymphocyte size with red blood cell size. A red blood cell is ~7–8 µm across; a lymphocyte is slightly larger, around 10 µm. Option C (10 divisions = 25 µm) is the kind of answer a student picks when they forget which cell they are dealing with.
Things to Be Careful About
- The stage micrometer's 0.1 mm = 100 µm is fixed — the figure is only needed to read how many graticule divisions span that 0.1 mm.
- When a graticule scale runs 0 to 100, the marks almost never sit exactly on the graticule's labelled integers. Read each mark against the nearest graticule subdivision rather than against the major numbered divisions to keep the count accurate.
- Always quote the conversion explicitly (0.1 mm = 100 µm) in your working; the unit conversion is the step most often skipped, and it is also the step most often marked wrong in mark-scheme rejections.
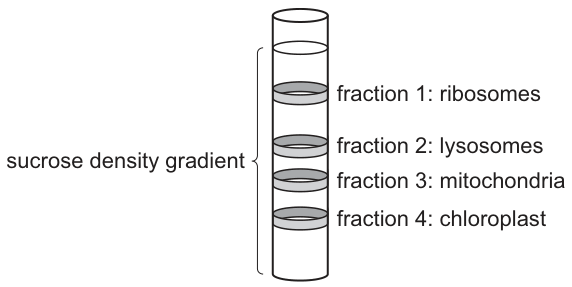
Cell structures can be isolated by centrifuging the cells in a sucrose density gradient. This breaks up the cells and separates the cell structures into fractions.
The diagram shows the positions of some of these fractions in a sucrose density gradient.
Which fractions contain cell structures that carry out protein synthesis?
Options
A 1, 2 and 3
B 1, 3 and 4
C 1 only
D 2, 3 and 4
Working
The fractions in the gradient contain:
- Fraction 1: ribosomes — site of protein synthesis
- Fraction 2: lysosomes — contain hydrolytic enzymes for digestion, not protein synthesis
- Fraction 3: mitochondria — contain their own ribosomes and DNA; carry out protein synthesis of some of their own proteins
- Fraction 4: chloroplasts — contain their own ribosomes and DNA; carry out protein synthesis of some of their own proteins
So the fractions containing structures that carry out protein synthesis are 1, 3 and 4.
Answer
B
B
Background Concept
Different organelles within a eukaryotic cell have different densities. When cells are homogenised and placed in a sucrose density gradient and centrifuged, the organelles separate into layers (fractions) according to their density, with the densest organelles settling furthest down the tube.
Each organelle has a specific function:
- Ribosomes are the main site of protein synthesis. They translate mRNA into polypeptides. Free ribosomes in the cytoplasm and rough endoplasmic reticulum ribosomes synthesise proteins encoded by nuclear DNA.
- Mitochondria have their own circular DNA and their own 70S ribosomes, enabling them to synthesise a small number of their own proteins (mostly encoded by mitochondrial DNA). The remaining mitochondrial proteins are encoded by nuclear DNA and imported.
- Chloroplasts similarly contain circular DNA and 70S ribosomes (reflecting their endosymbiotic origin from cyanobacteria), and synthesise some of their own proteins.
- Lysosomes are membrane-bound vesicles containing hydrolytic (digestive) enzymes. They break down waste materials, damaged organelles and engulfed pathogens — they do not carry out protein synthesis.
Understanding the Question
The question describes centrifugation of cell contents in a sucrose density gradient, producing four labelled fractions (ribosomes, lysosomes, mitochondria, chloroplast). It asks which of these fractions contain structures capable of carrying out protein synthesis.
Approach
Identify each organelle, then decide whether it carries out protein synthesis. The trick here is that students often focus only on ribosomes, forgetting that mitochondria and chloroplasts also synthesise some of their own proteins using their own ribosomes.
Step-by-Step Reasoning
- Fraction 1 contains ribosomes — these are the universal site of translation, so they definitely carry out protein synthesis. ✓
- Fraction 2 contains lysosomes — these are storage vesicles of hydrolytic enzymes; they digest materials, not synthesise proteins. ✗
- Fraction 3 contains mitochondria — these possess their own DNA and ribosomes and synthesise a small subset of their proteins (the majority are imported from the cytoplasm after synthesis on cytosolic ribosomes, but mitochondria still conduct protein synthesis internally). ✓
- Fraction 4 contains chloroplasts — these, like mitochondria, have their own DNA and ribosomes and conduct some protein synthesis of their own proteins. ✓
Therefore the fractions containing structures that carry out protein synthesis are 1, 3 and 4, corresponding to option B.
Key Takeaways
- Ribosomes are the primary site of protein synthesis in cells.
- Mitochondria and chloroplasts also carry out protein synthesis because they contain their own DNA and 70S ribosomes — a feature supporting the endosymbiotic theory.
- Lysosomes do not synthesise proteins; they digest material using hydrolytic enzymes.
- Cell fractionation by density-gradient centrifugation separates organelles so they can be studied individually.
Common Mistakes
- Selecting C (1 only) — forgetting that mitochondria and chloroplasts contain their own ribosomes.
- Selecting A (1, 2 and 3) — confusing lysosomes with a synthetic organelle; lysosomes are digestive, not synthetic.
- Selecting D (2, 3 and 4) — forgetting that ribosomes (fraction 1) are themselves a protein-synthesising structure and are also the most obvious answer.
Things to Be Careful About
- The question asks which fractions contain the structures, so consider each organelle's capability rather than the volume of protein it synthesises.
- Do not assume "protein synthesis" only means cytoplasmic translation — it can also include the limited translation that occurs inside mitochondria and chloroplasts.
- Density-gradient centrifugation separates by density, not function; ribosomes (relatively dense ribonucleoprotein particles) sit in a particular band, and identification is confirmed by markers such as enzyme assays or microscopy.
The diagram shows a plant cell.
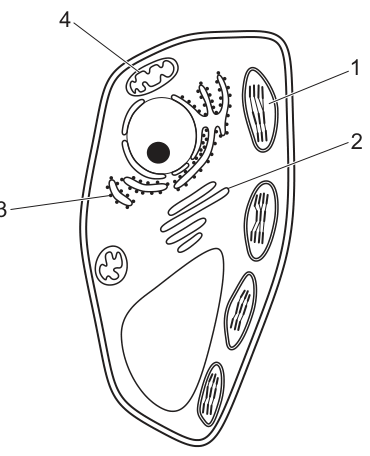
Which labelled organelles would contain nucleotides?
Options
A 1, 2 and 3
B 1, 2 and 4
C 1, 3 and 4
D 2, 3 and 4
Answer
ATP is a nucleotide, so any organelle that contains ATP (or other free nucleotides) is a correct choice.
- 1 — Mitochondrion: site of oxidative phosphorylation; produces ATP.
- 2 — Nucleus: houses DNA/RNA (polynucleotides), not free nucleotides such as ATP.
- 3 — Chloroplast: site of photophosphorylation; produces ATP.
- 4 — Golgi apparatus: uses ATP to phosphorylate and modify proteins.
Organelles 1, 3 and 4 all contain ATP (a nucleotide).
C
C
Background Concept
A nucleotide is the monomer from which nucleic acids are built, but the term also covers a much wider family of related molecules. Every nucleotide has three components: a nitrogen-containing base (a purine such as adenine/guanine, or a pyrimidine such as cytosine/thymine/uracil), a pentose sugar (ribose or deoxyribose), and one or more phosphate groups. The nucleic-acid building blocks (dATP, dTTP, dGTP, dCTP, ATP, UTP, CTP, GTP) are nucleotides, but so are the coenzymes and energy carriers ATP, ADP, AMP, NAD⁺, NADH, FAD, FADH₂ and coenzyme A. ATP (adenosine 5′-triphosphate) is therefore a nucleotide, and any organelle that produces, stores, or consumes ATP contains a nucleotide.
The four labelled organelles in Fig. 3.1 are:
- 1 — Mitochondrion, the site of aerobic respiration and oxidative phosphorylation.
- 2 — Nucleus, which stores the cell's main genome as DNA and is the site of transcription.
- 3 — Chloroplast, the site of photosynthesis and photophosphorylation (in a plant cell).
- 4 — Golgi apparatus, which modifies, sorts and packages proteins and lipids.
Understanding the Question
The question asks which of the labelled organelles would contain nucleotides. The mark-scheme-accepted interpretation is that the question refers primarily to ATP (and other free, functional nucleotides), not to the long polymeric chains of DNA/RNA housed in the nucleus. We therefore need to pick the organelles that produce or use ATP.
Approach
Go through each labelled organelle in turn and ask: Does it produce, store, or consume ATP (or another free nucleotide such as NADH or UDP-glucose)? Organelles that do are the correct answers.
Step-by-Step Reasoning
- 1 — Mitochondrion: Oxidative phosphorylation in the inner mitochondrial membrane synthesises large amounts of ATP from ADP and Pᵢ using energy released by the electron transport chain. The matrix is therefore rich in ATP, ADP, NADH and FADH₂. ✓ Contains nucleotides.
- 2 — Nucleus: The nucleus contains the cell's DNA and the RNA being transcribed. These are polynucleotides — long polymers of nucleotides — but the nucleus is not a site where free, functional nucleotides (ATP, NADH, etc.) accumulate in significant amounts; energy for nuclear processes (replication, transcription) is supplied by ATP imported from the cytoplasm, not generated in the nucleus. The mark scheme treats the nucleus as not 'containing' nucleotides in the functional sense the question probes.
- 3 — Chloroplast: Photophosphorylation by the thylakoid electron transport chain produces ATP in the stroma during the light-dependent reactions. The chloroplast also contains its own DNA and ribosomes, so it likewise contains nucleic-acid monomers. ✓ Contains nucleotides.
- 4 — Golgi apparatus: The cisternae of the Golgi use ATP to phosphorylate proteins (e.g. mannose-6-phosphate tagging of lysosomal enzymes) and use nucleotide-sugars such as UDP-glucose as donors in glycosylation. ATP and these nucleotide-sugars are present throughout the Golgi. ✓ Contains nucleotides.
The three organelles that contain nucleotides are therefore 1, 3 and 4 → option C.
Key Takeaways
- A nucleotide is not only a DNA/RNA building block; ATP, NAD, FAD, CoA and UDP-glucose are all nucleotides.
- The two organelles that generate ATP are the mitochondrion (respiration) and the chloroplast (photosynthesis).
- Many other organelles that use ATP also contain it — the Golgi apparatus, for example, consumes ATP during protein modification and glycosylation.
- The nucleus, although full of nucleic acids, is not a notable reservoir of free, functional nucleotides and is treated by this question as the 'odd one out'.
Common Mistakes
- Selecting the nucleus because it 'has DNA'. DNA is a polynucleotide, not a free nucleotide; the question is interpreted by the mark scheme as asking about free, functional nucleotides such as ATP. Always read the question's emphasis — here, on molecules rather than polymers.
- Excluding the Golgi apparatus because it is 'just a packaging organelle'. The Golgi is highly energy- and nucleotide-sugar-dependent; it contains ATP, UDP-glucose, and other nucleotide-sugars.
- Confusing ATP with 'energy from respiration' rather than with a nucleotide. ATP is a nucleotide by structural definition (adenine + ribose + 3 phosphates).
- Thinking the mitochondrion and chloroplast are 'animal-cell only' / 'plant-cell only'. Both occur in plant cells: mitochondria in all eukaryotic cells, chloroplasts in photosynthetic cells.
Things to Be Careful About
- The mark scheme answer relies on the ATP-centred interpretation of 'nucleotides'. If a more inclusive reading were taken (any nucleotide, including the dNTPs/NTPs used in replication and transcription), the nucleus would also qualify, and the answer would change. Stick to the mark-scheme definition on this question.
- Always check the question's command: 'contain nucleotides' ≠ 'contain nucleic acids'. Polynucleotides (DNA, RNA) are made of nucleotides but are not themselves nucleotides.
- When a labelled diagram is given, name each structure carefully before deciding — a misread label (e.g. confusing the Golgi with a vesicle) is the most common route to the wrong option.
The image shown is produced using a microscope.
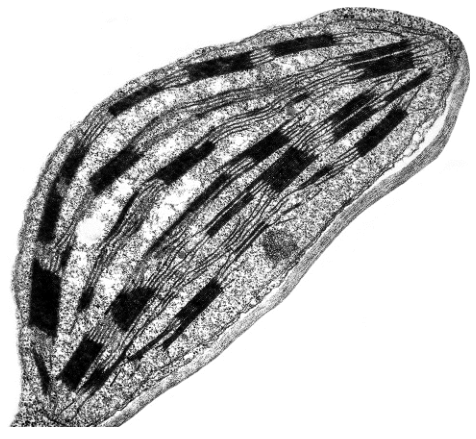
How many statements about this image are correct?
● It is an electron micrograph.
● It shows part of a eukaryotic cell.
● It shows at least one mitochondrion.
● It shows a specimen viewed at more than magnification.
Options
A 1
B 2
C 3
D 4
Working
The image shows a single oval organelle with dark, parallel internal bands — these are grana (stacks of thylakoids), identifying the organelle as a chloroplast.
Evaluating each statement:
- It is an electron micrograph — TRUE. The fine internal membrane structure (individual thylakoid stacks) is resolved, which is beyond the resolution of a light microscope.
- It shows part of a eukaryotic cell — TRUE. Chloroplasts occur only in eukaryotic (plant/algal) cells.
- It shows at least one mitochondrion — FALSE. The organelle shown is a chloroplast (grana of thylakoids), not a mitochondrion (which would show cristae, not stacked grana).
- It shows a specimen viewed at more than ×400 magnification — TRUE. The level of internal detail shown is consistent with the high magnifications achievable only with electron microscopy (well above ×400).
Three of the four statements are correct.
Answer
C
C
Background Concept
Light microscopes and electron microscopes differ fundamentally in resolving power — the smallest distance between two points that can be distinguished as separate.
- A light microscope uses visible light and glass lenses. Its maximum useful resolution is about 200 nm, which limits useful magnification to roughly ×1500 (school/college work rarely goes beyond ×400 or ×1000).
- An electron microscope uses a beam of electrons (wavelengths far shorter than visible light) and electromagnetic lenses. Its resolution is about 0.2 nm and useful magnification can exceed ×500,000.
This means that if you can see fine internal membrane detail — individual thylakoids stacked into grana, the outline of cristae inside a mitochondrion, ribosomes studding rough ER, or nuclear pores — the image must be an electron micrograph, and the magnification must be high.
The organelle in the image is a chloroplast. Its diagnostic features are:
- An oval/ellipsoidal shape bounded by a double envelope.
- Internal stacks of disc-like membranes called grana (singular: granum), which are stacks of thylakoids.
- Membranous connections between grana called stroma lamellae (or intergranal lamellae).
- A surrounding stroma (fluid matrix).
Understanding the Question
The candidate is shown a single micrograph (Fig. 4.1) and given four statements. They must count how many are correct, then select A (1), B (2), C (3) or D (4). The image is the only evidence available; the candidate must interpret it carefully rather than relying on the question text.
The command word is effectively "identify how many" — the question is a meta-task of evaluation, not a single fact recall.
Approach
Take each statement in turn and ask:
- Is the claim consistent with the image, AND
- Is the claim biologically correct in general?
A statement is "correct" only if both conditions hold. Count the true statements and match to the option.
Step-by-Step Reasoning
Statement 1: It is an electron micrograph.
The image shows the internal organisation of a chloroplast in great detail — individual granum stacks and the connecting stroma lamellae are clearly resolved. Resolving structures as small as thylakoid membranes (tens of nm) is well beyond the resolution of a light microscope. Therefore, this must be an electron micrograph. TRUE.
Statement 2: It shows part of a eukaryotic cell.
Chloroplasts are organelles bounded by a double membrane and are found only in eukaryotic photosynthetic organisms (plants and some protists). Prokaryotes (e.g. cyanobacteria) carry out photosynthesis but do not have membrane-bound chloroplasts. The image therefore shows a part of a eukaryotic cell. TRUE.
Statement 3: It shows at least one mitochondrion.
Mitochondria are roughly the size of bacteria and contain internal folds called cristae, not the regular, repeating, disc-like stacks seen in this image. The structure here is unmistakably a chloroplast (granum stacks are too large, too regular, and too parallel to be mitochondrial cristae). FALSE.
Statement 4: It shows a specimen viewed at more than ×400 magnification.
A school light microscope at ×400 would show chloroplasts as small green ovals with no internal grana visible — at best, faint granularity. The fact that individual thylakoid membranes and stroma lamellae are resolved means the magnification is far higher than ×400 (most likely several tens of thousands of times for a TEM). TRUE.
Counting: statements 1, 2, and 4 are correct → 3 correct statements → option C.
Key Takeaways
- Resolution and magnification are different properties; high resolution of internal membrane structure is the hallmark of an electron micrograph.
- A chloroplast is identified by its grana (stacks of thylakoids) and surrounding stroma; a mitochondrion by its cristae. The two are easily confused if you only glance at internal membranes.
- Only eukaryotes possess membrane-bound organelles such as chloroplasts, mitochondria, the nucleus and the ER.
- This question is a classic "evaluate the claim against the picture" type — read the image first, then test each statement against it.
Common Mistakes
- Misidentifying the organelle. Students sometimes call the structure a mitochondrion because they see internal membranes and assume "cristae." Cristae are sparse, irregular folds; grana are dense, regular, parallel stacks — the visual difference is striking once learnt.
- Rejecting "electron micrograph" because the image is greyscale, not coloured. TEM images are inherently greyscale (electrons have no colour). Colour EM images are false-colour additions. The greyscale nature of Fig. 4.1 is evidence for, not against, an electron micrograph.
- Rejecting statement 4 because they think anything beyond ×400 is "impossible." A light microscope's useful magnification ceiling is ~×1500, and electron microscopes go far higher. ×400 is simply a school-room cap; real biology is examined at vastly higher magnifications routinely.
- Dismissing statement 2 as wrong on the grounds that "the whole cell isn't shown." The statement says "part of a eukaryotic cell" — showing a chloroplast, which is exclusively eukaryotic, satisfies the claim.
Things to Be Careful About
- Always read each statement as a whole before deciding. A statement with a small error (e.g. "prokaryotic cell") is wrong even if everything else in it is right.
- The question does not ask which statements are correct individually; it asks how many are correct. Don't stop at the first true statement and pick option A.
- Make sure you can distinguish resolution (the ability to distinguish two close points as separate) from magnification (how large the image is). High magnification with poor resolution just gives a larger blurry blob — the clue that this is an EM is the detail, not the size.
- The mark scheme for this style of question usually accepts one answer only, so be confident in your count before choosing A, B, C or D.
Bacterial ribosomes consist of two subunits and a total of three rRNA molecules per ribosome. An analysis of all the 70S ribosomes from a single cell of the bacterium Escherichia coli showed that there were:
● rRNA molecules
● three types of rRNA molecule
● copies of each type of rRNA molecule.
How many 70S ribosomes were there in the E. coli cell?
Options
A 9500
B 19 000
C 38 000
D 57 000
Answer
Each 70S ribosome contains 3 rRNA molecules (one of each of the three types). The cell contains 57 000 rRNA molecules in total.
B
B
Background Concept
Ribosomes are the sites of protein synthesis in all cells. In prokaryotes such as Escherichia coli, the functional ribosome has a sedimentation coefficient of 70S (it is smaller than the 80S ribosome found in the cytoplasm of eukaryotic cells). Although the mature ribosome behaves as a single 70S particle, it is built from two unequal subunits:
- a 30S (small) subunit containing one 16S rRNA molecule
- a 50S (large) subunit containing one 23S rRNA molecule and one 5S rRNA molecule
So each complete 70S ribosome carries a total of three rRNA molecules — one of each of the three types. The three different rRNA molecules are not free-floating; they are packaged together into the assembled ribosome, so a count of rRNA molecules can be converted directly into a count of ribosomes.
Understanding the Question
The stem tells us the composition of a bacterial 70S ribosome (two subunits, three rRNA molecules per ribosome) and gives the rRNA inventory of a single E. coli cell:
- 57 000 rRNA molecules in total
- three types of rRNA molecule
- 19 000 copies of each type
The question asks for the number of 70S ribosomes in that cell. It is a one-step division question: the total count of rRNA molecules divided by the number of rRNA molecules per ribosome.
Approach
- Identify how many rRNA molecules make up one complete 70S ribosome (given as 3 in the stem).
- Use the total rRNA count (57 000) and divide by 3 to obtain the number of assembled ribosomes.
- Check consistency: 3 types × 19 000 copies = 57 000 total rRNA molecules ✓ — every ribosome must contain exactly one of each type, so the number of ribosomes must equal the number of copies of any one type, which is 19 000.
Step-by-Step Reasoning
- Each 70S ribosome contains 3 rRNA molecules (one 16S + one 23S + one 5S).
- Total rRNA molecules in the cell = 57 000.
- Number of ribosomes = 57 000 ÷ 3 = 19 000.
- Cross-check using the second piece of information: there are 19 000 copies of each of the three rRNA types. Because each ribosome contains exactly one of each type, the number of ribosomes must equal the number of copies of any single type, i.e. 19 000. The two approaches agree, confirming the answer.
Key Takeaways
- A prokaryotic 70S ribosome comprises 2 subunits but 3 rRNA molecules in total (one 16S, one 23S, one 5S).
- Total rRNA molecule count ÷ rRNA molecules per ribosome = number of ribosomes.
- The copy number per rRNA type alone is sufficient to give the answer, because the three types are present in equimolar amounts in the assembled ribosome.
Common Mistakes
- Dividing 57 000 by 2 (the number of subunits) instead of 3 (the number of rRNA molecules). The 50S subunit contains two rRNA molecules, not one, so each ribosome has three, not two.
- Adding the three copy numbers instead of dividing (3 × 19 000 = 57 000 is the total rRNA, not the number of ribosomes).
- Choosing D (57 000) by forgetting to divide by the rRNA molecules per ribosome.
Things to Be Careful About
- The number of ribosome subunits (2) is different from the number of rRNA molecules per ribosome (3); the question gives the figure 3 explicitly — use that.
- Ribosome copy numbers are usually reported as large integers; do not be tempted to express the answer in scientific notation unless the question requires it.
Radioactively labelled amino acids are introduced into a tracheal cell that uses them to make mucus (a glycoprotein).
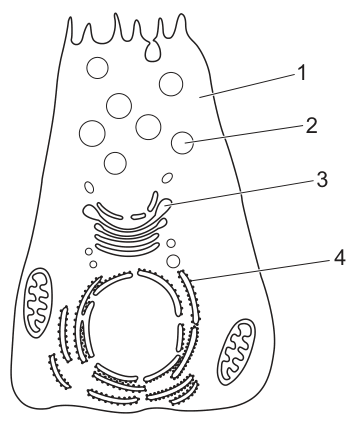
Which route will the amino acids take?
Options
| first | last | |||
|---|---|---|---|---|
| A | 1 | 2 | 3 | 4 |
| B | 1 | 4 | 3 | 2 |
| C | 4 | 1 | 2 | 3 |
| D | 4 | 3 | 2 | 1 |
Answer
B
The amino acids follow the secretory pathway for a glycoprotein. They are first incorporated into a polypeptide at the rough endoplasmic reticulum (RER), where membrane-bound ribosomes translate mRNA. The polypeptide is then transported to the Golgi apparatus for modification (glycosylation), and finally packaged into secretory vesicles that fuse with the plasma membrane to release the mucus. The order in option B (1, 4, 3, 2) traces this path through the labelled structures in the diagram.
B
Background Concept
Goblet cells in the trachea secrete mucus, which is a glycoprotein — a protein with attached carbohydrate chains. The synthesis, modification, and secretion of such proteins follow a well-defined intracellular route called the secretory pathway. The three key membrane-bound organelles involved are:
- Rough Endoplasmic Reticulum (RER) — flattened membrane sacs studded with ribosomes. The ribosomes on the RER translate mRNA encoding secreted proteins, and the new polypeptide is pushed into the RER lumen, where initial folding and glycosylation occur.
- Golgi Apparatus — a stack of flattened cisternae that receives proteins from the RER in transport vesicles. It modifies them further (completing glycosylation, sorting, and packaging).
- Secretory Vesicles — membrane-bound sacs that bud off the trans face of the Golgi, carrying the mature glycoprotein to the plasma membrane for exocytosis.
The nucleus is NOT part of the secretory pathway. Amino acids are not used or stored in the nucleus; they meet mRNA at the ribosomes in the cytoplasm or on the RER.
Understanding the Question
The diagram shows a secretory (goblet) cell with four labelled structures (1, 2, 3, 4). Radioactively labelled amino acids are placed in the cell, and the question asks which order (A–D) correctly represents the route the amino acids take as they are assembled into the glycoprotein mucus and secreted.
The key is to apply knowledge of the secretory pathway to the diagram.
Approach
Apply the secretory pathway in the correct order:
Then match this to the labels in the diagram to select the correct option.
Step-by-Step Reasoning
- The amino acids are activated in the cytoplasm (attached to tRNA).
- The amino acids are delivered to ribosomes on the RER. The ribosomes translate the mRNA, joining the amino acids into a polypeptide that is co-translationally inserted into the RER lumen.
- In the RER, the polypeptide is folded and the first carbohydrate chains are added (initial glycosylation).
- The protein is exported in transport vesicles to the Golgi apparatus, where it is further modified (more glycosylation, trimming) to become the mature glycoprotein.
- The mature glycoprotein is sorted and packaged into secretory vesicles that bud from the trans face of the Golgi.
- The secretory vesicles travel to the apical plasma membrane and fuse with it, releasing the mucus outside the cell by exocytosis.
The order in which the radioactive label passes through the organelles in the diagram is the order in option B (1, 4, 3, 2).
Key Takeaways
- The secretory pathway is: RER → Golgi → secretory vesicles → exocytosis.
- Secreted proteins (and glycoproteins) are made on ribosomes attached to the RER — not on free cytoplasmic ribosomes.
- The Golgi is the site of further modification, sorting, and packaging.
- The nucleus is not on the secretory route.
Common Mistakes
- Including the nucleus in the secretory pathway (e.g., choosing option C). The nucleus is where DNA is stored and transcribed, but amino acids do not pass through it.
- Reversing the order of the RER and Golgi (e.g., choosing A or D). Proteins always flow RER → Golgi → vesicles, never the reverse.
- Confusing the RER with the smooth ER — only the RER (with ribosomes) is the starting point for secreted proteins.
- Forgetting that secretory vesicles are a distinct compartment from transport vesicles — transport vesicles move proteins from RER to Golgi; secretory vesicles carry the finished product from the Golgi to the plasma membrane.
Things to Be Careful About
- The RER is recognisable by the ribosomes dotted on its cytoplasmic surface; the Golgi is recognisable as a stack of curved cisternae with no ribosomes.
- Glycosylation begins in the RER and is completed in the Golgi — the carbohydrate chains added in each compartment are different (N-linked in the RER, O-linked and trimming in the Golgi).
- The secretory pathway is unidirectional: proteins do not travel back from the Golgi to the RER, or from the plasma membrane back into the cell (except in special recycling pathways).
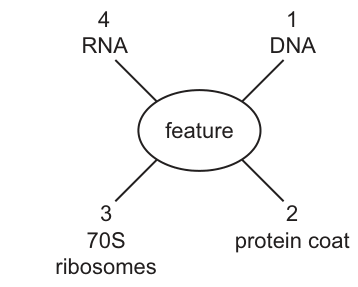
Which features shown in the diagram can be present in viruses?
Options
A 1, 2 and 3
B 1, 2 and 4
C 1, 3 and 4
D 2, 3 and 4
Working
Viruses are non-cellular particles. Their basic structure consists of a nucleic acid core (either DNA or RNA, but not both) surrounded by a protein coat (capsid).
Evaluating each feature:
- 1 (DNA): Some viruses (e.g. herpesvirus, adenovirus) have DNA — ✔ present in viruses.
- 2 (protein coat): All viruses have a protein capsid — ✔ present in viruses.
- 3 (70S ribosomes): Viruses have no ribosomes; they rely on the host cell's ribosomes for protein synthesis — ✘ NOT present in viruses.
- 4 (RNA): Some viruses (e.g. HIV, influenza, coronavirus) have RNA — ✔ present in viruses.
Features 1, 2 and 4 can be present in viruses.
Answer
B
B
Background Concept
Viruses are non-cellular infectious particles, much smaller than bacteria (typically 20–300 nm). Because they are not cells, they lack the structures associated with cellular life — no cytoplasm, no membrane-bound organelles and, crucially, no ribosomes. A complete virus particle (virion) consists of:
- A nucleic acid core of either DNA or RNA (never both as the genetic material of a single virus). DNA viruses include bacteriophage T4, herpesvirus and adenovirus; RNA viruses include HIV, influenza virus, coronavirus and tobacco mosaic virus.
- A protein coat (capsid) made of repeating protein subunits (capsomeres), which protects the nucleic acid and often aids attachment to host cells.
- In some viruses, an additional envelope derived from host cell membrane (e.g. HIV, influenza).
Because viruses lack ribosomes (and all other biosynthetic machinery), they can only reproduce inside a living host cell, hijacking the host's ribosomes, enzymes and nucleotides to make new viral proteins and nucleic acids.
Understanding the Question
The diagram presents four possible features radiating from a central "feature" label:
- DNA
- protein coat
- 70S ribosomes
- RNA
The question asks which combination of these features can be present in viruses. A feature is acceptable if it occurs in at least some viruses; it is rejected if it never occurs in viruses.
Approach
Go through each numbered feature and judge whether it is a component of any virus. Eliminate the option that is a cellular structure viruses do not possess.
Step-by-Step Reasoning
- Feature 1 — DNA: Many viruses use DNA as their genetic material (e.g. herpesvirus, smallpox, adenovirus, bacteriophage T4). ✔
- Feature 2 — protein coat: Every virus has a protein capsid surrounding its nucleic acid; this is a defining feature. ✔
- Feature 3 — 70S ribosomes: 70S ribosomes are found in prokaryotes (bacteria and archaea) and in the chloroplasts/mitochondria of eukaryotes. Viruses are non-cellular and have no ribosomes of their own — they must use the host's ribosomes. ✘
- Feature 4 — RNA: Many viruses (e.g. HIV, influenza, coronavirus, tobacco mosaic virus) use RNA as their genetic material. ✔
So features 1, 2 and 4 are all possible in viruses; feature 3 is never present. This matches option B.
Key Takeaways
- Viruses have a nucleic acid core of DNA or RNA (not both) inside a protein coat (capsid).
- Viruses are non-cellular and therefore lack ribosomes, cytoplasm and all metabolic machinery; they depend on a host cell to replicate.
- Distinguishing viral from cellular features is a common CIE exam theme — remember that antibiotics target prokaryotic ribosomes (70S), which is one reason antibiotics do not work against viruses.
Common Mistakes
- Selecting D (2, 3 and 4): a common error is assuming that because viruses contain RNA, they must also have ribosomes. Viruses do not.
- Confusing DNA vs RNA viruses: a single virus contains either DNA or RNA, not both, but across the virus family as a whole, both nucleic acid types are represented — so both 1 and 4 are valid answers.
- Confusing 70S ribosomes (prokaryotic) with 80S ribosomes (eukaryotic cytoplasmic) — both are absent in viruses, but the diagram specifically lists 70S.
Things to Be Careful About
- The question is about what can be present, so even DNA-only or RNA-only answers need to be considered separately — both are valid as long as some viruses have that feature.
- Ribosomes (of any type) are never part of a virus particle, so any option containing feature 3 should be eliminated first.
The diagram shows some steps in a laboratory method used to identify the presence of non-reducing sugars in a food sample.
Some terms are missing.

Which terms are correct for the expected result for a very low concentration of non-reducing sugar?
Options
| X | Y | Z | |
|---|---|---|---|
| A | acid hydrolysis | Benedict’s test | orange |
| B | Benedict’s test | acid hydrolysis | orange |
| C | acid hydrolysis | Benedict’s test | green |
| D | Benedict’s test | acid hydrolysis | green |
Working
To test for a non-reducing sugar:
- Step X = acid hydrolysis — the sample is boiled with dilute hydrochloric acid. This hydrolyses the glycosidic bond in the non-reducing sugar (e.g. sucrose), releasing its monosaccharide components which are reducing sugars.
- Step Y = Benedict's test — the acid is neutralised (e.g. with sodium hydrogencarbonate) and Benedict's reagent is then added and the mixture heated. A positive result is indicated by a colour change from blue.
- End colour Z = green — Benedict's test is semi-quantitative. For a very low concentration of reducing sugar, the colour produced is green (blue → green → yellow → orange → brick red as concentration increases).
So X = acid hydrolysis, Y = Benedict's test, Z = green.
Answer
C
C
Background Concept
Sugars are classified chemically as reducing or non-reducing. A reducing sugar has a free aldehyde (–CHO) or ketone group that can donate electrons and reduce other species (e.g. Cu²⁺ to Cu⁺ in Benedict's reagent). Examples include glucose, fructose, maltose and lactose. A non-reducing sugar — the classic example is sucrose — has both its anomeric carbons tied up in the glycosidic bond, so it has no free group to act as a reducing agent and gives a negative result with Benedict's reagent on its own.
However, the glycosidic bond in a non-reducing sugar can be broken by acid hydrolysis (boiling with dilute HCl). This cleaves the disaccharide into its two monosaccharide constituents, both of which are reducing sugars and will then give a positive Benedict's result.
Benedict's test is also semi-quantitative: the colour of the precipitate (copper(I) oxide, Cu₂O) formed depends on how much reducing sugar is present:
| Colour of precipitate | Concentration of reducing sugar |
|---|---|
| Stays blue | None / negligible |
| Green | Very low |
| Yellow | Low |
| Orange | Moderate |
| Brick-red | High |
Understanding the Question
The figure shows a three-box flow diagram: step X → step Y → end colour Z. The question asks which combination of terms (X, Y, Z) correctly describes the test for a non-reducing sugar AND the expected end colour when the non-reducing sugar is present only at a very low concentration. The test must therefore hydrolyse the sugar first, then test for the reducing products, and the colour must correspond to the lowest positive band.
Approach
- Decide what each step must be, based on the chemistry: the first step must break the non-reducing sugar down (acid hydrolysis), the second step must detect the resulting reducing sugar (Benedict's test).
- Then pick the colour that matches "very low concentration" on the semi-quantitative scale.
Step-by-Step Reasoning
-
Step X = acid hydrolysis. A non-reducing sugar cannot itself reduce Benedict's reagent, so the bond holding its monosaccharide units together must be broken first. This is done by heating the sample with dilute hydrochloric acid (typically around 2 mol dm⁻³ HCl, boiled for ~1 minute). The acid hydrolyses the glycosidic bond, releasing free monosaccharides.
-
Step Y = Benedict's test. Before doing this, the acid must be neutralised (commonly with sodium hydrogencarbonate) so it does not destroy the Benedict's reagent. Benedict's reagent (an alkaline solution of copper(II) sulfate with sodium citrate) is then added and the mixture is heated in a boiling water bath. Any reducing sugars reduce the soluble blue Cu²⁺ complex to an insoluble brick-red Cu₂O precipitate.
-
End colour Z = green. The question specifies a very low concentration of non-reducing sugar, which after hydrolysis yields only a very low concentration of reducing sugar. The lowest positive band on the semi-quantitative scale is green. Higher concentrations would shift the colour through yellow → orange → brick red. A blue result would mean no (or undetectable) reducing sugar at all — i.e. no non-reducing sugar present.
Matching these to the options:
- X = acid hydrolysis, Y = Benedict's test, Z = green → option C.
Options A and B are wrong because they swap the order of the two steps (and orange corresponds to a moderate, not very low, concentration). Option D reverses steps X and Y, and green is correctly matched with a very low concentration, but the steps are in the wrong order.
Key Takeaways
- The non-reducing sugar test is a two-step procedure: acid hydrolysis first, then Benedict's test.
- Benedict's result is semi-quantitative: blue (none) → green (very low) → yellow (low) → orange (moderate) → brick-red (high).
- Always neutralise the acid (e.g. with NaHCO₃) after hydrolysis and before adding Benedict's reagent, otherwise the strong acid will prevent the test working.
Common Mistakes
- Swapping X and Y. Many students remember "Benedict's test" as the first thing you do for sugars and put it in step X. But Benedict's reagent will not detect a non-reducing sugar unless it has first been hydrolysed.
- Confusing the colour scale. Choosing "orange" because it is a "positive" Benedict's colour is a common slip. Orange corresponds to a moderate concentration, not a very low one. Remember the order blue → green → yellow → orange → brick red.
- Skipping the neutralisation step. A common error in practice is to add Benedict's reagent while the mixture is still strongly acidic, which prevents the colour change.
Things to Be Careful About
- Read the concentration wording in the question — "very low" is decisive for the colour choice.
- The acid hydrolysis step must come before Benedict's test in the flow diagram, never after.
- "Benedict's test" alone is not sufficient to detect non-reducing sugars; the full procedure includes the hydrolysis step first.
Many biological molecules exist as polymers made up of monomer subunits.
Which row correctly identifies the monomer in each of the biological molecules?
Options
| collagen | glycogen | cellulose | |
|---|---|---|---|
| A | amino acid | -glucose | -glucose |
| B | -glucose | -glucose | amino acid |
| C | -glucose | amino acid | -glucose |
| D | amino acid | -glucose | -glucose |
Working
- Collagen is a fibrous protein → its monomers are amino acids (linked by peptide bonds).
- Glycogen is a polysaccharide of α-glucose (1,4- with 1,6-branches, the animal storage form of glucose).
- Cellulose is a polysaccharide of β-glucose (1,4-glycosidic bonds, forming straight chains that hydrogen-bond into microfibrils).
The only row pairing amino acid with collagen, α-glucose with glycogen, and β-glucose with cellulose is A.
Answer
A
A
Background Concept
All the large biological molecules (macromolecules) that cells build are polymers — long chains made by joining many small monomer subunits together, usually by a condensation reaction that releases water, and broken apart by hydrolysis.
Three families dominate:
- Proteins → monomers are amino acids (≈20 different ones) joined by peptide bonds. Examples include enzymes, membrane proteins, antibodies, and structural proteins such as collagen — the most abundant animal protein, found in tendons, bone, skin and blood-vessel walls.
- Polysaccharides (carbohydrate polymers) → monomers are monosaccharides (single sugars). The two most important polysaccharides for this question are:
- Glycogen — the main storage carbohydrate in animals (liver and muscle). It is built from α-glucose units linked by α-1,4-glycosidic bonds along the chain and α-1,6-glycosidic bonds at branch points, giving a highly branched, compact molecule that can be rapidly mobilised when blood glucose falls.
- Cellulose — the main structural polysaccharide of plant cell walls. It is built from β-glucose units linked by β-1,4-glycosidic bonds. The β-linkage flips every alternate glucose, producing straight, unbranched chains that pack together and hydrogen-bond into strong microfibrils — exactly what a load-bearing plant cell wall needs.
- Nucleic acids → monomers are nucleotides (not in this question).
The α vs β distinction is purely a question of geometry around carbon-1 of the glucose ring. In α-glucose the –OH on C1 sits on the same side as the –CH₂OH group (axial/down in the standard Haworth projection); in β-glucose it is on the opposite side (equatorial/up). This small spatial difference completely changes the polymer's shape and function: α-glucose polymers coil and branch (glycogen, starch), whereas β-glucose polymers form straight chains (cellulose).
Understanding the Question
This is a one-mark MCQ from Paper 1. The stem reminds us that biological molecules are polymers of monomers, then asks which row in the table correctly names the monomer of three named molecules: collagen, glycogen and cellulose. Each row offers the same three monomers in a different order, and exactly one row is right.
The command word here is identify — pure recall, no reasoning about structure needed beyond knowing which monomer builds which polymer.
Approach
For each of the three molecules, recall its biological class and the monomer that builds it, then read across the table to find the row that matches all three:
- collagen → protein → amino acid
- glycogen → animal storage polysaccharide → α-glucose
- cellulose → plant structural polysaccharide → β-glucose
Step-by-Step Reasoning
- Collagen is a protein. All proteins, including structural ones like collagen, are polymers of amino acids. So the monomer of collagen must be amino acid.
- This eliminates rows B and C, which put α-glucose or β-glucose in the collagen column.
- Glycogen is a polysaccharide of α-glucose. Glycogen is synthesised from UDP-glucose and the enzyme glycogen synthase; the residues are joined by α-1,4 linkages along the chain and α-1,6 linkages at the branch points, which is only possible because the monomers are α-glucose.
- Cellulose is a polysaccharide of β-glucose. Cellulose synthase uses UDP-glucose and inserts each residue with a β-1,4 glycosidic bond. Alternating β-glucose residues are flipped 180° relative to their neighbours, giving the straight, hydrogen-bonded chains that make plant cell walls rigid.
- So the correct pairing is amino acid | α-glucose | β-glucose, which is row A.
Key Takeaways
- Proteins → amino acids (always, including structural proteins such as collagen, keratin and elastin).
- Glycogen → α-glucose (animal storage, branched; related polymer starch in plants is also α-glucose but less branched).
- Cellulose → β-glucose (plant cell wall, straight, unbranched — the only common β-glucose polymer).
- The α/β distinction at carbon-1 of glucose is the single feature that determines whether the resulting polymer coils and branches (α) or lies straight and packs tightly (β).
Common Mistakes
- Swapping glycogen and cellulose. Students who confuse plant and animal storage carbohydrates may put β-glucose for glycogen and α-glucose for cellulose. Remember: animal = glycogen = α; plant structural = cellulose = β.
- Thinking collagen is made of sugars or fatty acids. Collagen is unambiguously a fibrous protein, so its monomer is an amino acid, not a sugar. The very name colla + gen (Greek for "glue-producing") hints at its protein nature.
- Confusing starch with cellulose. Both are plant polysaccharides, but starch is α-glucose (digestible to humans) while cellulose is β-glucose (indigestible to humans — a useful dietary fibre).
Things to Be Careful About
- The Haworth projection of α- and β-glucose: in α-glucose the C1 –OH is on the same side as the C6 –CH₂OH group; in β-glucose it is on the opposite side. Examiners will often show a Haworth diagram and ask which is α or β, so be confident with the geometry.
- Read the table headers carefully — the order of molecules across the top (collagen, glycogen, cellulose) is fixed, and the option letters just rearrange the monomers. The answer is the row that lines up correctly under each molecule.
- This question is from the AS Level Multiple Choice paper, so expect one mark only and no working required — but you must be able to write the full names (α-glucose, β-glucose) confidently in any free-response paper that asks for them.
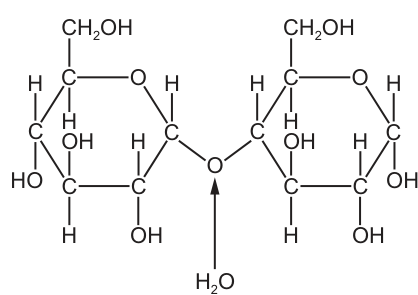
Which statement correctly explains the result when the two molecules shown in the diagram react together?
Options
A A hydrolysis reaction is forming the disaccharide maltose.
B A reducing sugar is split into two monosaccharides by hydrolysis.
C Condensation of two -glucose molecules is taking place.
D A condensation reaction is forming two reducing sugars.
Working
The diagram shows two α-glucose molecules drawn separately, with an arrow pointing to a water molecule () at the position where a glycosidic bond would sit. This indicates that water is being added across that bond to break it — i.e. a hydrolysis reaction.
Two α-glucose units joined by a 1,4-glycosidic bond form maltose. Maltose is a reducing sugar because the second glucose unit still has a free anomeric carbon (C1 with a free –OH group) that can open into an aldehyde and reduce Benedict's reagent.
Evaluating each option:
- A — wrong: hydrolysis breaks bonds; it does not form a disaccharide.
- B — correct: maltose (a reducing sugar) is being split into two glucose monosaccharides by hydrolysis.
- C — wrong: the arrow denotes water being added (hydrolysis), not released (condensation).
- D — wrong: condensation joins molecules into one product; it does not split them, and two monosaccharides cannot be "formed" by condensation.
Answer
B
B
Background Concept
Monosaccharides such as α-glucose can link together to form disaccharides (e.g. maltose) and polysaccharides (e.g. starch, glycogen, cellulose). The linkage between sugar units is a glycosidic bond, formed when the –OH on one carbon reacts with the –OH on another carbon, releasing a molecule of water. Because water is released, this joining process is a condensation reaction. The reverse — breaking the glycosidic bond by adding a water molecule — is hydrolysis.
A sugar is classified as reducing if it has a free anomeric carbon (the carbon bearing the ring oxygen and a hemiacetal –OH) that can open into an aldehyde group and so reduce Cu²⁺ ions in Benedict's reagent to Cu⁺ (brick-red precipitate). All monosaccharides are reducing. Among disaccharides, maltose is reducing (one glucose retains a free anomeric carbon), whereas sucrose is non-reducing (both anomeric carbons are locked in the glycosidic bond).
Understanding the Question
Fig. 10.1 shows two α-glucose molecules drawn separately, with an arrow pointing from the bond position to a water molecule (). The question asks which statement correctly explains what is happening. The arrow direction is the key clue: in Cambridge diagrams, an arrow that points to a water molecule at a bond location indicates that water is being added to break that bond (hydrolysis), not released to form one (condensation).
Approach
- Read the arrow direction in the diagram to decide between condensation and hydrolysis.
- Identify the disaccharide that two α-glucose units make (maltose, a 1,4-linked α-glucose dimer).
- Decide whether maltose is a reducing sugar.
- Match these facts to the only option that fits all three.
Step-by-Step Reasoning
Step 1 — Interpret the arrow. The two glucose rings are shown separated, and the arrow points to sitting between them. This is the standard convention for hydrolysis: water is being supplied to the glycosidic bond so it can break. If it were condensation, the arrow would point the opposite way (away from the bond, indicating water being released) and the two rings would be shown joined.
Step 2 — Identify the disaccharide. Two α-glucose molecules joined by an α-1,4-glycosidic bond form maltose. (A β-1,4 linkage between two glucose units would give cellobiose instead — note the orientation of the –OH on C1 of the left molecule determines which it is.) Maltose is therefore the substrate that has been, or is being, hydrolysed.
Step 3 — Is maltose reducing? Yes. The right-hand glucose in maltose keeps a free hemiacetal –OH on its C1, so it can open into the aldehyde form and act as a reducing agent. This rules out any answer that treats the product of the reaction as non-reducing, or describes condensation.
Step 4 — Match to the options.
- A says hydrolysis is forming maltose — hydrolysis breaks bonds, never forms them. Eliminate.
- B says a reducing sugar (maltose) is split into two monosaccharides by hydrolysis — matches all three facts above. Keep.
- C says condensation of two α-glucose is taking place — the arrow shows water being added, not released. Eliminate.
- D says condensation is forming two reducing sugars — condensation produces one disaccharide from two monosaccharides, not two reducing sugars, and the arrow shows hydrolysis anyway. Eliminate.
Key Takeaways
- An arrow pointing to at a glycosidic bond ⇒ hydrolysis (bond is broken).
- An arrow pointing away from the bond to ⇒ condensation (bond is formed).
- Two α-glucose units form maltose, which is a reducing disaccharide.
- Reducing sugars possess a free anomeric carbon; non-reducing sugars (e.g. sucrose) do not.
Common Mistakes
- Reading the arrow as condensation because "two molecules + water = disaccharide" — the orientation of the arrow (toward vs away from ) determines the direction of the reaction.
- Choosing A because maltose is the right disaccharide — hydrolysis forms the monosaccharides, not the disaccharide.
- Choosing C because the question mentions α-glucose — the diagram shows hydrolysis, not condensation.
- Assuming all disaccharides are non-reducing — maltose and lactose are reducing; only sucrose (and polysaccharides with no free anomeric carbon) are reliably non-reducing.
Things to Be Careful About
- The diagram uses structural formulae: the OH on C1 of the left-hand ring points down (α configuration). Confirming α vs β matters because β-glucose + β-glucose gives cellobiose (still reducing), while α-glucose + α-glucose gives maltose.
- The mark scheme requires the word hydrolysis and the recognition that maltose is a reducing sugar — both must be present for full credit in any extended-answer version of this idea.
- "Condensation forming two reducing sugars" (option D) is wrong on two independent counts: condensation produces one joined product, not two separate sugars; and it is the wrong reaction type for the diagram shown.
Which row describes amylopectin?
Options
| -1,4 glycosidic bonds | -1,6 glycosidic bonds | shape of molecule | function of molecule | |
|---|---|---|---|---|
| A | ✓ | ✓ | branched | storage |
| B | ✓ | ✗ | helical | storage |
| C | ✓ | ✓ | branched | structural |
| D | ✗ | ✓ | helical | structural |
key
✓ = present
✗ = not present
Working
Amylopectin is a branched polymer of α-glucose that is one of the two components of starch.
- It contains α-1,4 glycosidic bonds linking the glucose units along the main chain (✓).
- It contains α-1,6 glycosidic bonds at the branch points (✓).
- The presence of these branch points gives it a branched shape.
- Its role is storage of glucose (as part of starch in plants), not structural.
This matches row A. Rows C and D are wrong because amylopectin is storage, not structural (cellulose is the structural glucose polymer). Row B is wrong because amylopectin has both bond types and is branched, not helical — that description fits amylose.
Answer
A
A
Background Concept
Starch is the main energy-storage polysaccharide in plants and is a mixture of two glucose polymers: amylose (≈20–30%) and amylopectin (≈70–80%). Both are built from α-glucose monomers linked by glycosidic bonds, but they differ in the types of bond present, the resulting shape, and the functional consequences of that shape.
- Amylose is an unbranched chain: glucose units are joined only by α-1,4 glycosidic bonds. The chain coils into a helix, which is why it is the form that gives a deep blue-black colour with iodine/potassium iodide solution (the iodine sits inside the helix).
- Amylopectin is a branched chain. Most glucose units are joined by α-1,4 glycosidic bonds along each chain, but at the branch points an α-1,6 glycosidic bond joins one glucose unit to two others, creating a side chain. The many branch points give it a tree-like (branched) shape and a very large number of free ends, which is why amylopectin can be broken down and loaded/unloaded for storage and mobilisation much more rapidly than amylose.
Both polymers act as storage molecules; they are compact, insoluble (so they do not affect water potential inside the cell), and can be hydrolysed to release glucose when needed. By contrast, cellulose — a β-glucose polymer with only β-1,4 bonds and straight, hydrogen-bonded chains — is the structural polysaccharide of plant cell walls.
Understanding the Question
The question asks which row of a table correctly describes amylopectin across four columns: presence of α-1,4 bonds, presence of α-1,6 bonds, shape, and function. The candidate must know the structure and function of amylopectin well enough to tick the correct combination and reject the others.
Approach
For each row, check all four columns against the known features of amylopectin:
- Bonds: α-1,4 ✓ and α-1,6 ✓
- Shape: branched (because of the α-1,6 branch points)
- Function: storage (it is a component of starch)
The only row that satisfies all four is A.
Step-by-Step Reasoning
- Row A: α-1,4 ✓, α-1,6 ✓, branched, storage. This matches amylopectin exactly. ✓
- Row B: lists only α-1,4 and a helical shape with storage. The "only α-1,4 + helical" description is that of amylose, not amylopectin. ✗
- Row C: has both bond types and a branched shape — correct on structure — but assigns a structural function. Amylopectin is storage, not structural; cellulose is the structural glucose polymer. ✗
- Row D: lacks α-1,4 bonds (wrong, the main chain of amylopectin is α-1,4), lists only α-1,6 (incomplete), gives a helical shape (wrong; amylopectin is branched) and a structural function (wrong; it is storage). ✗
So the answer is A.
Key Takeaways
- Amylopectin = branched α-glucose polymer with α-1,4 bonds along the chains and α-1,6 bonds at the branch points.
- Amylopectin is a storage polysaccharide (part of starch); it is not structural.
- The helical, unbranched α-1,4-only polymer is amylose (also storage).
- The structural glucose polymer is cellulose, made of β-glucose with β-1,4 bonds — a different monomer, a different bond, and a different function.
Common Mistakes
- Confusing amylose and amylopectin: assuming "helical + α-1,4 only" describes amylopectin. It describes amylose.
- Confusing storage with structural function: choosing a row that has the right bonds but a structural function (C or D). Cellulose is structural; starch components are storage.
- Believing α-1,6 bonds are rare or unusual — they are precisely what makes amylopectin (and glycogen) branched.
Things to Be Careful About
- "α-1,4 and α-1,6" together is the diagnostic pair for a branched storage glucan (amylopectin in plants, glycogen in animals). If only α-1,4 is listed, the molecule is unbranched (amylose).
- Do not equate "branched" with "structural"; branching enables rapid mobilisation for storage, not a structural role.
- The α/β designation of the glycosidic bond matters: α-1,4 → storage (starch/glycogen); β-1,4 → structural (cellulose).
What is a feature of triglyceride molecules?
Options
A They are hydrophobic molecules.
B They are molecules with a single ester bond.
C They are polar molecules.
D They are water-soluble molecules.
Working
A triglyceride consists of one glycerol molecule esterified to three fatty acid chains, each of which is a long, non-polar hydrocarbon chain. The non-polar C–H bonds in these chains mean the whole molecule is non-polar overall, so it does not form hydrogen bonds with water and is therefore hydrophobic. By contrast, options C and D contradict this, and option B is wrong because three ester bonds are formed (not one).
Answer
A
A
Background Concept
A triglyceride is formed by a condensation reaction between glycerol (a 3-carbon alcohol with three –OH groups) and three fatty acid molecules. Each carboxyl (–COOH) group of a fatty acid reacts with one of the hydroxyl (–OH) groups of glycerol, releasing a molecule of water and forming an ester bond. Because all three glycerol hydroxyls are used, a triglyceride contains three ester bonds and a single glycerol backbone bearing three long fatty acid (R) chains.
The fatty acid tails are made of long hydrocarbon chains (–CH₂–CH₂–CH₂–). The C–H bond is essentially non-polar, so the tails cannot hydrogen-bond with water. With no overall charge separation across the molecule, triglycerides are non-polar and therefore hydrophobic — they do not dissolve in water. This is why fats form droplets in the cytoplasm of cells and in blood.
Understanding the Question
The command word is "What is a feature…" — a single property is required. We must pick the statement that is true of triglyceride molecules. This is a knowledge-and-elimination question: we test each option against what is known about the chemistry of a triglyceride.
Approach
- Recall the structure of a triglyceride (glycerol + 3 fatty acids, joined by 3 ester bonds).
- Use the non-polar nature of the hydrocarbon chains to predict overall polarity and solubility.
- Test each option against this picture.
Step-by-Step Reasoning
- Option A — hydrophobic. The three long hydrocarbon tails of the fatty acids are non-polar, so the whole molecule is non-polar and repelled by water. ✔ Correct.
- Option B — single ester bond. Each of the three –OH groups of glycerol forms an ester linkage with a fatty acid, giving three ester bonds, not one. ✘
- Option C — polar molecules. The polar ester linkages are dwarfed by the very large non-polar hydrocarbon chains; overall the molecule is non-polar. ✘
- Option D — water-soluble molecules. Because they are non-polar, triglycerides are insoluble in water (this is why they need to be transported in the blood inside lipoprotein particles). ✘
Key Takeaways
- Triglycerides = glycerol + 3 fatty acids, joined by 3 ester bonds.
- The long hydrocarbon tails make the molecule non-polar overall.
- Non-polar ⇒ hydrophobic ⇒ insoluble in water.
Common Mistakes
- Choosing B because students only count one "type" of bond rather than three separate ester linkages.
- Confusing the small polar ester groups with overall polarity of the molecule — the dominant non-polar chains win.
- Conflating "hydrophobic" with "hydrophilic"; remember the prefix hydro- (water) plus -phobic (fearing) = water-fearing.
Things to Be Careful About
- Ester bond count: a monoglyceride has one, a diglyceride has two, a triglyceride has three.
- Triglycerides vs phospholipids: phospholipids have a polar phosphate head and only two fatty acid tails, so they are partly polar/amphipathic; do not transfer the answer from a phospholipid question.
An unsaturated fatty acid molecule has 17 carbon atoms in the tail which is attached to its carboxyl group. The tail contains three double bonds.
How many hydrogen atoms does the tail contain?
Options
A 29
B 31
C 33
D 35
Answer
A saturated 17-carbon tail (an alkyl group, C₁₇H₃₅) would have hydrogen atoms. Each C=C double bond removes 2 hydrogen atoms, so 3 double bonds remove hydrogens.
The tail contains 29 hydrogen atoms → A.
A
Background Concept
A fatty acid is built from a long hydrocarbon "tail" attached to a carboxyl group (–COOH). The general formula of a fully saturated open-chain hydrocarbon with carbon atoms is (alkane). When one end of this chain is attached to the carboxyl group, the terminal carbon loses one H, so the alkyl tail has the formula .
A C=C double bond converts a –CH₂–CH₂– unit into a –CH=CH– unit, which removes exactly 2 hydrogen atoms from the chain. So each additional double bond reduces the hydrogen count by 2 while leaving the carbon count unchanged.
Understanding the Question
The question gives the composition of a fatty acid tail:
- Carbon atoms in tail: 17
- Double bonds (degree of unsaturation): 3
- We are asked for the number of hydrogen atoms in the tail.
This is a quantitative question disguised as biology — the answer depends on the structure of the hydrocarbon chain, not on any special biochemical trick.
Approach
- Calculate the hydrogen count of a fully saturated 17-carbon tail using .
- Subtract 2 hydrogens for every double bond present.
- Match the result to the answer choices.
Step-by-Step Reasoning
Step 1 — Saturated tail.
For :
Step 2 — Adjust for unsaturation.
Each C=C removes 2 H; with 3 double bonds the total reduction is .
Step 3 — Final hydrogen count.
Step 4 — Match to options.
29 corresponds to option A.
Sanity check: the molecule described is essentially α-linolenic acid, an 18-carbon fatty acid (17 in the tail + 1 in –COOH) with 3 double bonds, written as C18:3. Its molecular formula is . Subtracting the carboxyl group (–COOH = , contributing C, 2 O, 1 H) leaves a tail of , exactly as calculated.
Key Takeaways
- A saturated open-chain hydrocarbon follows ; an alkyl substituent is .
- Each C=C double bond in a chain removes 2 hydrogen atoms.
- Lipid shorthand (e.g. C18:3) directly encodes both the carbon count and the number of double bonds.
Common Mistakes
- Using instead of for the tail (forgetting that the carboxyl group takes one of the terminal hydrogens). This would give 30 instead of 29, which is not an option — but if it were, it would be wrong.
- Subtracting only 1 hydrogen per double bond instead of 2. This gives 32, also wrong.
- Treating each double bond as removing 4 hydrogens (confusing with aromatic rings or a fully dehydrogenated unit).
Things to Be Careful About
- The question specifies the tail only (17 carbons), not the whole fatty acid (which would be 18 carbons including the carboxyl carbon). Read carefully — the carboxyl carbon is not part of the tail.
- Double bonds in fatty acids are normally cis; geometric isomerism does not change the H count, so do not adjust further for cis/trans.
- The –COOH group is not in the tail, so its O atoms and its single acidic H should not be included in the count of the tail.
Which statement about phospholipids in the bilayer of a cell surface membrane is correct?
Options
A The non-polar phosphate heads face outwards and the polar fatty acid tails face inwards.
B The polar phosphate heads face outwards and the non-polar fatty acid tails face inwards.
C The non-polar fatty acid tails face outwards and the polar phosphate heads face inwards.
D The polar fatty acid tails face outwards and the non-polar phosphate heads face inwards.
Working
A phospholipid has a hydrophilic (polar) phosphate head and two hydrophobic (non-polar) fatty acid tails. In the bilayer, the heads face the aqueous environment on both the outside and inside of the cell, while the tails are tucked inwards away from water.
Answer
B
B
Background Concept
A phospholipid is an amphipathic molecule, meaning it has both hydrophilic and hydrophobic regions. Its structure consists of:
- A phosphate head — hydrophilic (water-loving) and therefore polar.
- Two fatty acid tails — hydrophobic (water-fearing) and therefore non-polar.
When phospholipids are placed in water (such as the aqueous environments inside and outside a cell), they spontaneously arrange themselves into a bilayer. The polar heads orient towards the water on both the extracellular and intracellular surfaces, while the non-polar tails cluster together in the interior of the membrane, hidden from water. This arrangement is the basis of the fluid mosaic model of the cell surface membrane.
Understanding the Question
This is a multiple-choice question testing recall of phospholipid orientation within the bilayer. The command word is implicit "Which statement... is correct?" — the candidate must identify the option that correctly describes the polarity and position of the heads and tails.
Approach
The key is to remember two facts:
- The phosphate heads are polar (hydrophilic).
- The fatty acid tails are non-polar (hydrophobic).
In a bilayer in an aqueous environment, the polar regions face the water (outwards, on both sides of the membrane) and the non-polar regions face inwards, away from water.
Step-by-Step Reasoning
- Option A states "non-polar phosphate heads" — this is incorrect because phosphate heads are polar, not non-polar. Reject.
- Option B states "polar phosphate heads face outwards and the non-polar fatty acid tails face inwards" — this correctly identifies the polarity of each part AND the correct orientation in the bilayer. This is the correct answer.
- Option C reverses the correct orientation (tails out, heads in) and is wrong.
- Option D swaps the polarities, calling fatty acid tails "polar" and phosphate heads "non-polar". This is factually wrong.
Key Takeaways
- Phosphate heads = polar/hydrophilic → face the aqueous environments (outside and inside the cell).
- Fatty acid tails = non-polar/hydrophobic → face inwards, away from water.
- The bilayer's structure is a direct consequence of the amphipathic nature of phospholipids.
Common Mistakes
- Confusing which part is polar: the phosphate head is polar, not the fatty acid tails. Memorise "heads = hydrophilic, tails = hydrophobic".
- Confusing orientation: some students think both layers of the bilayer have heads pointing the same way; in fact, the two layers are arranged tail-to-tail, with heads on both outer surfaces.
Things to Be Careful About
- The bilayer has heads on both the outer and inner surfaces (facing the extracellular fluid and the cytoplasm respectively), not just on the outside of the cell.
- This is a recall question — no calculation or graph interpretation is required, but precise terminology (polar/non-polar, hydrophilic/hydrophobic) is essential for full understanding.
Which descriptions of enzymes that use the lock-and-key hypothesis are correct?
1 The active site is complementary to the substrate the enzyme acts on.
2 Bonds that form in the enzyme–substrate complex change the shape of the active site.
3 Most of the amino acids in an enzyme help to maintain the specific shape of the enzyme.
Options
A 1, 2 and 3
B 1 and 2 only
C 1 and 3 only
D 3 only
Working
Statement 1: TRUE for lock-and-key — the active site is already complementary in shape to the substrate before binding.
Statement 2: FALSE for lock-and-key — the active site does NOT change shape on binding. A change in the shape of the active site when bonds form in the ES complex describes the induced-fit hypothesis, not the lock-and-key hypothesis.
Statement 3: TRUE — only a small number of amino acids at the active site bind the substrate; the majority form the tertiary structure that maintains the correct shape of the active site.
Therefore only 1 and 3 are correct.
Answer
C
C
Background Concept
Enzymes are biological catalysts (almost always proteins) that speed up reactions by lowering the activation energy. Each enzyme has a region called the active site where the substrate binds. Two models describe how this binding works:
- Lock-and-key hypothesis — the active site and the substrate have shapes that are already perfectly complementary. The substrate fits the active site in the same way a key fits a lock, with no change in shape of either partner.
- Induced-fit hypothesis — the active site is not an exact match initially. When the substrate enters, interactions between enzyme and substrate cause the active site to mould itself around the substrate, becoming complementary only after binding.
The tertiary structure of an enzyme is held together by hydrogen bonds, ionic bonds, disulfide bridges and hydrophobic interactions between R groups of amino acids. Only a few amino acids (typically those lining the active site) make direct contact with the substrate; the rest maintain the 3D shape that positions those residues correctly.
Understanding the Question
This is a "which are correct" multiple choice question with three statements about enzymes considered under the lock-and-key hypothesis. We must judge each statement against this specific model, not against enzyme action in general.
Approach
For each numbered statement, decide whether it is consistent with the lock-and-key model. A statement is correct only if it describes what the lock-and-key hypothesis actually says — the active site is pre-shaped to fit the substrate and does not change.
Step-by-Step Reasoning
Statement 1 — "The active site is complementary to the substrate the enzyme acts on."
This is a direct description of the lock-and-key hypothesis: the active site and substrate have complementary shapes from the start, allowing the substrate to slot in without any reshaping. ✔ Correct under lock-and-key.
Statement 2 — "Bonds that form in the enzyme–substrate complex change the shape of the active site."
A change in active site shape on substrate binding is the defining feature of the induced-fit hypothesis, not lock-and-key. Under lock-and-key the active site is rigid and complementary before binding, so this statement is incorrect. ✘
Statement 3 — "Most of the amino acids in an enzyme help to maintain the specific shape of the enzyme."
Enzymes are large proteins but the active site contacts only a few R groups. The remaining amino acids are not wasted — they form the scaffolding (secondary and tertiary structure) that holds the active site residues in exactly the right geometry. ✔ Correct.
So 1 and 3 only are correct → option C.
Key Takeaways
- Lock-and-key = active site already complementary; no shape change on binding.
- Induced-fit = active site moulds around the substrate on binding.
- Most amino acids in an enzyme are structural — they maintain the shape of the active site rather than contacting the substrate directly.
Common Mistakes
- Confusing lock-and-key with induced-fit and crediting statement 2. The wording "change the shape of the active site" is the giveaway that the question is referring to induced-fit.
- Thinking the lock-and-key model is "wrong" or "outdated". The syllabus presents it as a simplified model; both lock-and-key and induced-fit are accepted descriptions, and you must answer according to which one the question names.
- Believing that only a few amino acids matter, and so rejecting statement 3. It is true that only a few residues contact the substrate, but the rest are essential for holding the active site in the correct shape.
Things to Be Careful About
- Always read the hypothesis named in the question. Many enzyme statements can be true or false depending on which model is being applied.
- Distinguish "complementary" (lock-and-key) from "complementary after a shape change" (induced-fit).
- Watch for the word "most" in statement 3 — it is essential, because only a minority of amino acids actually contact the substrate, but the majority are required for the overall 3D structure.
The graph shows the results of an investigation into the effect of amylase on starch at three different temperatures.
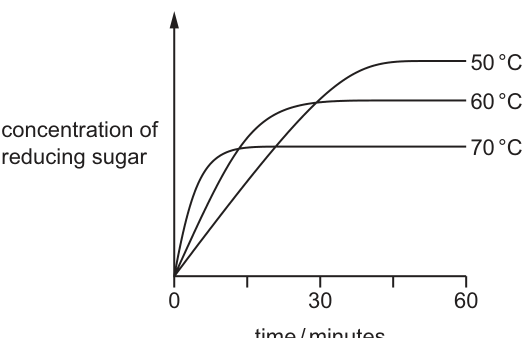
Which statements are correct conclusions using these results?
1 The optimum temperature is .
2 The initial rate of reaction is highest at .
3 The higher the temperature the more quickly the enzyme denatures.
Options
A 1, 2 and 3
B 1 and 2 only
C 1 and 3 only
D 2 and 3 only
Working
- Statement 1: 50 °C has the lowest initial gradient on the graph, so its initial rate is the slowest of the three. The fact that it eventually reaches the highest concentration of reducing sugar is because the enzyme is not denaturing appreciably, not because 50 °C is the optimum. The optimum is where the rate is fastest, so this statement is not supported.
- Statement 2: The 70 °C curve has the steepest initial gradient, so the initial rate of reaction is highest at 70 °C. This is supported by the graph.
- Statement 3: The 70 °C curve plateaus earliest at the lowest final concentration, the 60 °C curve plateaus at an intermediate level, and the 50 °C curve has not plateaued by 60 min. Higher temperature therefore leads to more rapid denaturation of amylase. This is supported by the graph.
Answer
D
D
Background Concept
Enzymes are globular proteins that catalyse metabolic reactions. Their activity depends on the precise three-dimensional shape of the active site, which is held together by hydrogen bonds, ionic interactions, hydrophobic interactions and (in some cases) disulfide bridges. Two competing effects determine how an enzyme behaves as temperature rises:
- Kinetic energy effect — as temperature increases, molecules move faster, so enzyme–substrate collisions become more frequent and more of them have enough energy to overcome the activation energy. The rate therefore increases with temperature up to a point.
- Denaturation effect — above a certain temperature the weak bonds holding the tertiary structure together break, the active site loses its specific shape, and the enzyme can no longer bind substrate. The rate then falls, eventually to zero.
The optimum temperature is defined as the temperature at which the rate of the reaction is greatest. It is not simply the temperature at which the most product is eventually formed. Because enzymes from different organisms have different structures, the optimum varies (e.g. human amylase ≈ 37 °C, thermophilic bacterial enzymes can be > 70 °C).
Understanding the Question
You are shown Fig. 16.1: concentration of reducing sugar (a product of amylase hydrolysing starch) plotted against time at three temperatures — 50 °C, 60 °C and 70 °C. From the shape of each curve you can read two things:
- the initial gradient (= initial rate of reaction), which tells you how fast amylase is working before any denaturation sets in;
- the final plateau height and the time at which it is reached, which tells you how much starch was eventually converted and therefore how much of the enzyme survived.
You must judge which of the three statements are valid conclusions from this graph.
Approach
Read the graph in two passes. First, compare the initial slopes of the three curves to evaluate statements about initial rate. Second, compare the final plateau levels (and how quickly they are reached) to evaluate statements about denaturation. Be careful to separate the concept of "optimum temperature" (highest rate) from "greatest total product" (least denaturation) — they are not the same thing here.
Step-by-Step Reasoning
Statement 1: "The optimum temperature is 50 °C."
The optimum is the temperature at which the rate is highest. On the graph, the 50 °C curve has the shallowest initial gradient of the three, so its rate is the slowest. The reason its curve eventually overtakes the others is that very little amylase denatures at 50 °C, so the reaction can keep going for the full 60 minutes and almost all the starch is converted. That makes 50 °C a favourable working temperature, but it does not make it the optimum — by definition, the optimum is where the rate is fastest. So Statement 1 is incorrect.
Statement 2: "The initial rate of reaction is highest at 70 °C."
Reading the initial gradient of each curve at time = 0:
The 70 °C curve rises most steeply at the start. The kinetic-energy effect dominates at the very beginning, before significant denaturation has occurred, so the initial rate is indeed highest at 70 °C. Statement 2 is correct.
Statement 3: "The higher the temperature the more quickly the enzyme denatures."
Compare the plateaus:
| Temperature | Final concentration of reducing sugar | When plateau reached |
|---|---|---|
| 50 °C | highest (curve still rising slowly at 60 min) | not yet |
| 60 °C | intermediate | around 20 min |
| 70 °C | lowest | around 10 min |
At 70 °C, amylase denatures fastest, so the reaction stops earliest with the least product. At 60 °C, denaturation is slower, so more product is made before the enzyme is lost. At 50 °C, denaturation is negligible, so almost all the starch is eventually hydrolysed. The graph clearly shows that higher temperature → faster denaturation. Statement 3 is correct.
Conclusion: Statements 2 and 3 are correct, Statement 1 is not. The answer is D.
Key Takeaways
- The initial rate is read from the gradient of the curve at time 0.
- The total product formed is read from the final plateau height.
- These two are not the same, and conflating them is the standard trap in this type of question.
- The optimum temperature is the temperature at which the rate is highest, not the one that yields the most product in a fixed time.
- Higher temperatures denature enzymes faster because more weak bonds in the tertiary structure are disrupted.
Common Mistakes
- Picking B or C because "50 °C reaches the highest point, so it must be the optimum." It reaches the highest final concentration only because it is not denaturing; its rate is the slowest, so it cannot be the optimum. This is the most common error on this style of question.
- Picking A — believing that all three statements are true, when the definition of "optimum" rules out Statement 1.
- Confusing rate with yield when describing enzyme experiments. Always say "rate of reaction" or "amount of product" — they are different quantities.
- Ignoring the time axis — Statement 3 depends on noticing that the 70 °C plateau is reached earliest, not just that it is the lowest.
Things to Be Careful About
- Use the exact wording "initial rate of reaction" when describing the gradient at t = 0; "rate of reaction" on its own is ambiguous because the rate changes over time at 60 °C and 70 °C.
- When explaining denaturation, mention that it is the tertiary structure and the shape of the active site that is lost — not the primary structure or the bonds being broken permanently.
- Do not assume the optimum is 37 °C just because amylase is a human enzyme; the data here clearly show the enzyme functioning at 50–70 °C, so the optimum in this experiment lies somewhere in (or above) that range.
- The graph is a typical enzyme-rate graph: it shows rate decreasing over time at 60 °C and 70 °C because substrate is being used up and enzyme is being lost. Be ready to explain either or both reasons if asked.
The rate of enzyme-catalysed reactions in human cells is regulated.
What may be involved in this regulation?
1 a change in enzyme concentration
2 a change in substrate concentration
3 inhibition by the final product of the reaction
Options
A 1, 2 and 3
B 1 and 2 only
C 1 and 3 only
D 2 and 3 only
Working
The question asks which mechanisms may regulate the rate of enzyme-catalysed reactions in human cells.
-
Change in enzyme concentration — Cells control the amount of enzyme they make by regulating gene expression (transcription/translation). Increasing or decreasing the number of enzyme molecules directly alters the maximum reaction rate (). This is a major form of metabolic regulation.
-
Change in substrate concentration — As substrate concentration rises (at constant enzyme concentration), more enzyme–substrate complexes form and the rate increases (until is reached). Cells can regulate substrate supply (e.g. through transport or upstream reactions), so substrate concentration is a legitimate regulator of rate.
-
Inhibition by the final product of the reaction — This describes end-product (feedback) inhibition, where the end product of a pathway binds to an enzyme (often allosterically) earlier in the pathway, reducing its activity. This is a classic form of metabolic regulation.
All three mechanisms operate in human cells, so 1, 2 and 3 are correct.
Answer
A
A
Background Concept
Enzymes are biological catalysts that speed up the metabolic reactions essential to life. The rate at which an enzyme-catalysed reaction proceeds is governed by a small set of factors: the concentration of the enzyme, the concentration of its substrate, temperature, pH, and the presence of any inhibitors. Cells do not simply let these factors fluctuate — they actively control them so that metabolism runs at the right speed, producing the right amount of product at the right time.
Three of the most important ways a cell regulates reaction rate are:
- Enzyme concentration. A cell can change how many molecules of a particular enzyme it contains. This is done by switching transcription of the corresponding gene on or off, by altering mRNA stability, or by controlling the rate at which the enzyme is broken down. More enzyme molecules mean a higher maximum rate (), because at saturating substrate every additional enzyme molecule can process substrate in parallel.
- Substrate concentration. The rate of an enzyme-catalysed reaction depends on how often the enzyme meets a substrate molecule. The Michaelis–Menten relationship shows that as rises, the rate increases (hyperbolically) until it approaches . Cells can therefore influence the rate by controlling substrate supply — for example, by changing the rate of an upstream reaction that produces the substrate, or by altering transport across the cell membrane.
- End-product inhibition (feedback inhibition). The product of a reaction (or the end product of a whole pathway) can bind to the enzyme that made it (or an earlier enzyme in the pathway) and inhibit it, usually at an allosteric site distinct from the active site. This is a non-competitive form of inhibition that prevents wasteful overproduction and keeps the cell's metabolism in balance.
All three of these are widely used in human cells, which is why the question lists them as plausible answers.
Understanding the Question
This is a multiple-choice question (Paper 1 style) testing whether the candidate recognises each of the three numbered statements as a valid mechanism by which a human cell can regulate the rate of an enzyme-catalysed reaction. The command word "may be involved" is permissive — any mechanism that genuinely operates in cells qualifies. The candidate must judge each statement independently and then pick the option that lists all and only the correct ones.
Approach
For each numbered statement, ask: "Is this something a human cell actually does to control enzyme rate?" If the answer is yes for all three, the correct option is the one that includes all three (option A: 1, 2 and 3).
Step-by-Step Reasoning
- Statement 1 — change in enzyme concentration. Human cells absolutely regulate enzyme levels. Examples include the induction of digestive enzymes in response to food, the upregulation of respiratory enzymes in response to training, and the controlled expression of liver enzymes involved in detoxification. Therefore, 1 is correct.
- Statement 2 — change in substrate concentration. The cell can alter substrate availability by regulating the reaction that produces the substrate, or by controlling membrane transport. Because reaction rate is a function of substrate concentration (up to ), varying is a valid regulatory mechanism. Therefore, 2 is correct.
- Statement 3 — inhibition by the final product of the reaction. This is the textbook definition of end-product / feedback inhibition. A classic human example is the inhibition of phosphofructokinase by ATP (and citrate) in glycolysis — when ATP is abundant, the pathway slows down. Therefore, 3 is correct.
All three statements are valid regulators in human cells, so the answer must include 1, 2 and 3.
Key Takeaways
- Cells regulate enzyme rate by controlling enzyme amount, substrate availability, and end-product inhibition, in addition to physical factors such as temperature, pH, and competitive/non-competitive inhibitors.
- A change in enzyme concentration shifts ; a change in substrate concentration changes the rate along the same Michaelis–Menten curve; end-product inhibition typically acts allosterically and is non-competitive.
- When a "which of the following" question uses the permissive word "may", any genuinely operative mechanism should be accepted.
Common Mistakes
- Rejecting statement 2 on the grounds that "substrate concentration isn't really regulation." This is a common error. Although it is the most direct and least elegant mechanism, cells genuinely use it: changing the rate of substrate supply is a form of regulation.
- Dismissing end-product inhibition as a "laboratory trick" that doesn't occur in vivo. In fact, allosteric feedback inhibition is one of the most universal and important regulatory mechanisms in metabolism.
- Conflating "end-product inhibition" with competitive inhibition by a substrate analogue. End-product inhibition in metabolism is almost always allosteric (non-competitive), not competitive.
Things to Be Careful About
- Read the command word carefully: "may be involved" is permissive — it does not require the mechanism to be the only or the primary one.
- Statement 1 refers to enzyme concentration, not activity. A change in activity (e.g. by allosteric activation) would not satisfy this statement, but a change in concentration definitely does.
- The Cambridge syllabus treats end-product inhibition as a form of non-competitive (allosteric) inhibition. If the question asked for the type of inhibition, you would say "non-competitive" or "allosteric", not "competitive".
Proteins in the cell surface membranes of human cells and mouse cells were labelled with fluorescent dyes. The human cells were labelled with a red dye and the mouse cells were labelled with a green dye.
A human cell and a mouse cell were then fused to form a hybrid cell.
At first, the different dyes remained separate. After 40 minutes, the two dyes were evenly distributed in the hybrid cell surface membrane.
What explains this observation?
Options
A All protein molecules in the cell surface membrane are fixed to structures within the cell, but phospholipid molecules move freely between them.
B Groups of protein and phospholipid molecules in the cell surface membrane are attached to each other and move together.
C Only protein molecules in the outer layer of the cell surface membrane can move freely between phospholipid molecules.
D Protein molecules in the outer layer of the cell surface membrane and those which span the bilayer can move freely between phospholipid molecules.
Working
The labelled proteins from the human (red) and mouse (green) cells become evenly distributed throughout the hybrid cell's membrane. This means the proteins — not just the phospholipids — are moving within the bilayer. Both peripheral proteins (in the outer layer) and integral/transmembrane proteins (spanning the bilayer) must be able to move freely between the phospholipid molecules.
Answer
D
D
Background Concept
The fluid mosaic model (Singer and Nicolson, 1972) describes the cell surface membrane as a fluid phospholipid bilayer in which a variety of proteins are embedded. The phospholipid molecules are constantly moving, and crucially, most membrane proteins are also able to move laterally within the plane of the bilayer. Proteins that span the bilayer (integral/transmembrane proteins) and those attached to the inner or outer surface (peripheral proteins) can all drift through the phospholipid 'sea'. This mobility is what gives the membrane its 'fluid' character and is essential for functions such as cell signalling, membrane transport, cell–cell recognition and cell movement.
Understanding the Question
The question describes the classic Frye–Edidin experiment (1970), in which membrane proteins of human cells were tagged with a red fluorescent dye and membrane proteins of mouse cells with a green fluorescent dye. The two cells were then fused. Initially each colour remained confined to half of the hybrid cell, but after about 40 minutes the red and green labels were evenly mixed across the whole membrane. The question asks what this observation tells us about how proteins and phospholipids behave in the membrane.
The command word here is what explains this observation? — we must pick the statement that correctly accounts for proteins (the labelled molecules) becoming uniformly distributed.
Approach
Identify what is being tracked in the experiment: the fluorescent labels are attached to proteins in the cell surface membrane. Therefore, the fact that the labels become evenly distributed is direct evidence that the proteins themselves are moving within the membrane, not only the phospholipids. The correct option must state that membrane proteins can move freely, including those that span the bilayer.
Step-by-Step Reasoning
- The red and green dyes are attached to membrane proteins, not phospholipids. So the redistribution of dye colour directly reflects the redistribution of proteins.
- After 40 minutes the two colours are evenly spread, so the proteins from the human and mouse halves have migrated through the membrane and mixed.
- For this to happen, the proteins must be able to move laterally within the phospholipid bilayer.
- The movement is observed across the whole membrane surface, which includes the outer leaflet of the bilayer; integral proteins that span the bilayer also redistribute, so the correct statement must cover both peripheral (outer-layer) and transmembrane proteins.
- Option A is wrong: it says proteins are fixed, but the experiment shows they move.
- Option B is wrong: if proteins and phospholipids were locked together in groups, the labelled proteins could not redistribute independently — yet they do.
- Option C is wrong: it restricts movement to outer-layer proteins and excludes transmembrane proteins, which is not supported by the observation (and contradicts the fluid mosaic model).
- Option D is correct: it states that proteins in the outer layer and those spanning the bilayer can move freely between phospholipid molecules, which exactly explains the even distribution of the two dyes.
Key Takeaways
- The fluid mosaic model describes the membrane as a fluid phospholipid bilayer in which proteins can move laterally.
- The Frye–Edidin fusion experiment is the classical evidence for protein mobility within membranes.
- Both peripheral (surface) and integral (transmembrane) proteins can move; this mobility is essential for many membrane functions.
Common Mistakes
- Choosing A because phospholipid fluidity is well known — but the experiment labels proteins, so A's claim that proteins are fixed directly contradicts the result.
- Choosing B because students remember 'molecules can move' — B claims proteins and phospholipids move together as rigid groups, which would not allow the dyes to intermingle.
- Choosing C because of a vague sense that 'outer' proteins move — the option wrongly excludes transmembrane proteins, and the experiment shows redistribution of all membrane proteins.
Things to Be Careful About
- Always identify what is being labelled in the experiment — here, proteins, not phospholipids.
- The fluid mosaic model permits lateral movement of most proteins; some are anchored (e.g. to the cytoskeleton) and so move less freely, but the question's options do not test this nuance.
- Watch for the precise wording of option D: it covers both outer-layer and transmembrane proteins, which is exactly what the data require.
Which statements about the cell surface membrane are correct?
1 Channel proteins allow water soluble ions and molecules across the membrane.
2 Glucose can pass into the cell via carrier proteins.
3 Oxygen passes freely through the membrane as it is soluble in lipids.
4 Some glycoproteins act as antigens.
Options
A 1, 2, 3 and 4
B 1, 3 and 4 only
C 1 and 2 only
D 2, 3 and 4 only
Working
Evaluate each statement against known membrane structure and function:
-
Channel proteins allow water soluble ions and molecules across the membrane — Correct. Channel proteins form hydrophilic pores through the bilayer, allowing water-soluble ions (e.g., Na⁺, K⁺, Cl⁻) and small water-soluble molecules to pass by facilitated diffusion.
-
Glucose can pass into the cell via carrier proteins — Correct. Glucose is a polar, water-soluble molecule and cannot pass directly through the phospholipid bilayer; it is transported across the membrane by carrier proteins (facilitated diffusion, e.g., GLUT transporters).
-
Oxygen passes freely through the membrane as it is soluble in lipids — Correct. O₂ is small and non-polar, so it dissolves in the phospholipid bilayer and diffuses across the membrane without the need for a protein channel or carrier.
-
Some glycoproteins act as antigens — Correct. Glycoproteins on the outer leaflet of the membrane serve as cell-surface markers; for example, the ABO blood group antigens on red blood cells are glycoproteins.
All four statements are correct, so the answer is A.
Answer
A
A
Background Concept
The cell surface membrane is described by the fluid mosaic model as a phospholipid bilayer in which proteins move laterally. The phospholipid bilayer has a hydrophobic interior (the fatty acid tails) and a hydrophilic exterior (the phosphate heads). This structure determines which substances can cross the membrane directly and which require protein assistance:
- Small, non-polar, lipid-soluble molecules (e.g., O₂, CO₂, steroid hormones) dissolve in the bilayer and pass through by simple diffusion.
- Water-soluble ions and small polar molecules (e.g., Na⁺, K⁺, Cl⁻, glucose, amino acids) cannot cross the hydrophobic core and must use membrane proteins.
Two main classes of transport protein are involved:
- Channel proteins form hydrophilic pores that allow specific ions or small water-soluble molecules through (facilitated diffusion). They can be gated (e.g., voltage-gated or ligand-gated).
- Carrier proteins bind to a specific molecule, change shape, and release it on the other side. They mediate both facilitated diffusion and active transport (e.g., the Na⁺/glucose co-transporter in the ileum).
The membrane also contains glycoproteins and glycolipids — proteins/lipids with short carbohydrate chains attached on the outer surface. These carbohydrate chains function in cell–cell recognition and act as antigens (e.g., the ABO blood group system, MHC molecules involved in immune recognition).
Understanding the Question
This is a multiple-choice question with four statements about the cell surface membrane and four answer options giving different combinations. The task is to decide which of the individual statements 1–4 are biologically correct, then select the option that lists exactly those statements.
The command word is implicit but clear: which statements are correct? — each statement must be evaluated independently on its own merits.
Approach
Go through each statement one at a time and judge it on two things: (a) the biology it describes, and (b) whether the wording is accurate enough to be credited. A statement that "sounds right" but is imprecisely worded may not earn a mark in a longer question, but in this MCQ the only criterion is whether it is biologically true.
Step-by-Step Reasoning
Statement 1 — Channel proteins allow water-soluble ions and molecules across the membrane.
This is correct. Channel proteins are integral transmembrane proteins that create a water-filled pore lined with hydrophilic R-groups. Ions such as Na⁺, K⁺, and Cl⁻, as well as small water-soluble molecules, pass through these channels down their electrochemical gradient by facilitated diffusion. Specificity comes from the diameter of the pore and the nature of the R-groups lining it.
Statement 2 — Glucose can pass into the cell via carrier proteins.
This is correct. Glucose is a polar molecule with many –OH groups; it is not lipid-soluble, so it cannot diffuse across the hydrophobic core. Glucose enters most cells (e.g., red blood cells, muscle) via GLUT carrier proteins by facilitated diffusion, and is absorbed in the small intestine against a gradient by the SGLT1 Na⁺/glucose co-transporter. The statement is general but accurate.
Statement 3 — Oxygen passes freely through the membrane as it is soluble in lipids.
This is correct. O₂ is small and non-polar and is freely soluble in the phospholipid bilayer. It crosses the membrane by simple diffusion at a rate determined by Fick's law (proportional to surface area and the partial pressure gradient, and inversely proportional to membrane thickness). No protein is required.
Statement 4 — Some glycoproteins act as antigens.
This is correct. The carbohydrate chains of membrane glycoproteins project from the outer surface and have a specific 3-D shape that the immune system can recognise as foreign (or as "self"). The ABO blood group antigens on red blood cells are the classic example — they are glycoproteins (and glycolipids) whose sugar composition differs between blood groups. MHC class I and II molecules, which present antigens to T-lymphocytes, are also glycoproteins.
Because all four statements are correct, the correct option is the one listing all of them: A (1, 2, 3 and 4).
Key Takeaways
- The phospholipid bilayer is a selective barrier: lipid-soluble, small non-polar molecules cross freely; water-soluble ions and polar molecules need protein assistance.
- Channel proteins provide a hydrophilic pore for ions and small polar molecules (facilitated diffusion).
- Carrier proteins bind and shuttle specific molecules (e.g., glucose) across the membrane.
- O₂ and CO₂ cross the membrane by simple diffusion through the bilayer.
- Glycoproteins on the outer membrane surface act as cell-recognition markers and antigens (e.g., ABO blood groups, MHC).
Common Mistakes
- Confusing channel and carrier proteins. Channel proteins form open pores; carrier proteins bind the molecule and undergo a conformational change. Glucose uses carriers, not channels.
- Assuming all membrane transport needs ATP. Facilitated diffusion through channels and carriers is passive; only active transport requires ATP.
- Thinking O₂ needs a protein because it is "important". Importance does not equal mechanism — O₂'s small size and non-polar nature mean it diffuses directly through the bilayer.
- Thinking antigens are only proteins. Carbohydrate components of glycoproteins and glycolipids can also act as antigens (this is exactly how ABO blood groups work).
Things to Be Careful About
- Read each statement on its own merits; in an MCQ, the answer is the combination that includes every true statement and excludes every false one.
- Be precise about the wording: a statement that says "ions only" or "small molecules only" for channel proteins would be too narrow, but the wording here ("water soluble ions and molecules") is acceptable.
- Remember that the question is about the cell surface (plasma) membrane, not internal membranes — although the principles are the same, the emphasis on external glycoproteins acting as antigens is specifically a feature of the plasma membrane.
The diagram shows two cylinders of agar.
The agar cylinders are placed into a solution of dye at the same time. The time taken for the dye to diffuse into the centre of each cylinder is recorded.
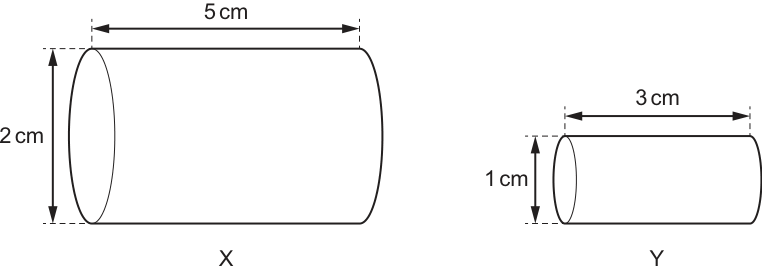
Which statement explains why the dye reaches the centre of one agar cylinder faster than the other agar cylinder?
Options
A The dye reaches the centre of X in a shorter time than the dye reaches the centre of Y because X has a larger surface area to volume ratio.
B The dye reaches the centre of X in a shorter time than the dye reaches the centre of Y because X has a larger surface area.
C The dye reaches the centre of Y in a shorter time than the dye reaches the centre of X because the dye has a shorter distance to diffuse to the centre.
D The dye reaches the centre of Y in a shorter time than the dye reaches the centre of X because Y has a smaller volume.
Working
Calculate the SA:V ratio for each cylinder.
Cylinder X (radius = 1 cm, length = 5 cm):
Cylinder Y (radius = 0.5 cm, length = 3 cm):
Y has the higher SA:V ratio. The maximum diffusion distance to the centre of Y (radius = 0.5 cm) is shorter than that to the centre of X (radius = 1 cm), so dye reaches the centre of Y first.
C
Background Concept
Diffusion is the passive net movement of particles (molecules or ions) from a region of higher concentration to a region of lower concentration. The rate of diffusion depends on several factors, but two of the most important for an object immersed in a solution are:
- The surface area available for diffusion — more surface area means more particles can cross per unit time.
- The diffusion distance — the time taken for a substance to reach the centre of an object depends on the maximum distance it must travel, which is determined by the dimensions of the object.
The surface area to volume (SA:V) ratio combines these two factors. As an object gets larger, its volume increases faster than its surface area, so its SA:V ratio decreases. A small object has a relatively large surface area for its volume, so diffusion can supply its interior efficiently. This is why single-celled organisms can rely on diffusion alone for gas exchange and nutrient uptake, whereas multicellular organisms need specialised exchange surfaces and transport systems.
For a cylinder, the maximum diffusion distance to the centre is its radius (measured from the curved surface). The smaller the radius, the shorter the distance and the faster diffusion reaches the centre.
Understanding the Question
The question describes two agar cylinders, X and Y, placed into a dye solution. Cylinder X is larger (diameter 2 cm, length 5 cm) and Cylinder Y is smaller (diameter 1 cm, length 3 cm). The time for the dye to reach the centre of each cylinder is measured. The question asks us to identify the correct biological explanation for why the dye reaches the centre of one cylinder faster than the other.
The command word is essentially "explain why", so we must identify the correct reason, not just a true statement.
Approach
To distinguish the options:
- Surface area alone is not the right explanation — a larger surface area does not automatically mean faster diffusion to the centre.
- Volume alone is not the right explanation — a smaller volume is correlated with faster diffusion, but the mechanism is the shorter diffusion distance, not the volume itself.
- SA:V ratio is the correct concept, but the option claiming X has a larger SA:V ratio is wrong — Y has the larger SA:V ratio.
- Diffusion distance (radius) is the direct cause: the dye travels a shorter distance to reach the centre of the smaller cylinder.
Calculate SA:V for both cylinders to confirm which is larger, and identify the maximum diffusion distance (the radius) for each.
Step-by-Step Reasoning
Cylinder X (radius , length ):
- Surface area
- Volume
- SA:V
- Maximum diffusion distance to centre
Cylinder Y (radius , length ):
- Surface area
- Volume
- SA:V
- Maximum diffusion distance to centre
Evaluating each option:
- A claims X has the larger SA:V ratio — incorrect, Y has the larger ratio (≈ 4.7 vs 2.4).
- B claims X has a larger surface area — true numerically (12π > 3.5π), but a larger surface area does not cause the dye to reach the centre faster; if anything, a larger surface area with a much larger volume would mean the centre is further away.
- C says dye reaches the centre of Y faster because Y has a shorter diffusion distance to the centre — correct. The radius of Y is 0.5 cm versus 1 cm for X, so dye molecules diffusing in from the curved surface only have to travel half as far.
- D claims Y is faster because Y has a smaller volume — partially true but not the mechanistic explanation. Smaller volume is a consequence of the smaller dimensions; the actual reason diffusion is faster is the shorter distance to the centre.
Key Takeaways
- Diffusion to the centre of an object depends on the maximum diffusion distance (the radius for a cylinder), not on surface area or volume alone.
- Smaller objects have higher SA:V ratios, which is why they can be supplied by diffusion alone.
- When comparing two objects, identify the direct cause (diffusion distance) rather than a correlated property (volume).
Common Mistakes
- Choosing B: A larger surface area is a true statement, but it does not explain why diffusion to the centre is faster. In fact, X has more surface area but its centre is harder to reach.
- Choosing D: A smaller volume is correlated with faster diffusion, but the actual mechanism is the shorter diffusion distance, not the volume per se.
- Choosing A: Misjudging which cylinder has the larger SA:V ratio. Always calculate rather than guess — Y is clearly smaller in every dimension.
Things to Be Careful About
- The question is asking for an explanation, not just a true statement. Options B and D are true but do not correctly explain the phenomenon.
- The SA:V ratio is a useful comparative measure, but here the diffusion distance (radius) is the more precise and direct explanation.
- For a cylinder, the maximum diffusion distance to the centre is the radius, measured from the curved surface (not the end caps).
What are roles of adult stem cells in humans?
1 repair other cells by mitosis
2 divide to replace cells in tissues
3 differentiate into a new organism
Options
A 1 and 3
B 1 only
C 2 and 3
D 2 only
Working
Adult stem cells are multipotent: they divide by mitosis to replace cells in the tissues where they reside (e.g. bone marrow, skin, gut lining). They do NOT repair other cells by mitosis directly, and they cannot differentiate into a whole new organism — only a fertilised egg/early embryonic cells are totipotent enough to do that.
- Statement 1: incorrect — adult stem cells do not 'repair other cells by mitosis'; they themselves divide to produce new cells.
- Statement 2: correct — adult stem cells divide to replace cells in tissues.
- Statement 3: incorrect — only totipotent cells (zygote/early embryo) can form a new organism; adult stem cells are multipotent and cannot.
Answer
D
D
Background Concept
Stem cells are unspecialised cells that can both self-renew (divide to produce more stem cells) and differentiate into specialised cell types. They are classified by their potency:
- Totipotent — can give rise to every cell type, including extra-embryonic tissues, and so can form a whole new organism. Only the fertilised egg (zygote) and the first few cleavage divisions are totipotent.
- Pluripotent — can give rise to most cell types of the body but not extra-embryonic tissues (e.g. embryonic stem cells from the inner cell mass of the blastocyst).
- Multipotent — can give rise to a limited range of cell types, usually restricted to one tissue or a small family of related tissues. These are the adult (somatic) stem cells found in places such as bone marrow (haematopoietic stem cells → red cells, white cells, platelets), the basal layer of the epidermis, the intestinal crypts, and muscle satellite cells.
Because adult stem cells are restricted to a small set of fates, they cannot produce an entire new individual. Their normal role is homeostatic maintenance: dividing to top up cell numbers in tissues where cells are continuously lost (blood, skin, gut lining) or repairing damage after injury.
Understanding the Question
This is a multiple-choice item asking which of three statements correctly describe the roles of adult stem cells in humans. The command is implicit: select the option that contains ONLY the true statement(s). Each statement must be evaluated on its biology, not on how it sounds.
Approach
Take each statement in turn and check it against the defining features of adult stem cells:
- Do adult stem cells repair other cells by mitosis? — They divide, but the new cells they produce are not the original stem cells; they differentiate to replace lost cells. So the wording 'repair other cells by mitosis' is misleading.
- Do adult stem cells divide to replace cells in tissues? — Yes, this is precisely their function.
- Can adult stem cells differentiate into a new organism? — No, they are only multipotent; forming a whole organism requires totipotency.
Step-by-Step Reasoning
- Statement 1 ('repair other cells by mitosis') is incorrect. Adult stem cells themselves undergo mitosis, but the products of that division differentiate into new specialised cells. The stem cells do not 'repair' other cells in a direct, mechanical sense; they supply replacements. The mark scheme treats statement 1 as wrong because of this wording.
- Statement 2 ('divide to replace cells in tissues') is correct. This is the textbook role of adult stem cells — for example, haematopoietic stem cells in red bone marrow divide and differentiate to replace the billions of short-lived blood cells that are lost each day. The same is true of stem cells in intestinal epithelium, epidermis, and many other renewing tissues.
- Statement 3 ('differentiate into a new organism') is incorrect. Producing an entire new organism requires a cell that can give rise to all body cell types AND extra-embryonic structures such as the placenta. Only the zygote and the very earliest embryonic cells have this totipotent capability. Adult stem cells are restricted to a narrow lineage (multipotent), so they cannot generate a whole organism.
Only statement 2 is correct, so the answer is D (2 only).
Key Takeaways
- Adult (somatic) stem cells are multipotent — they can produce only a limited range of cell types within their tissue of residence.
- Their physiological role is homeostatic replacement and repair of cells lost through normal turnover or injury.
- Forming an entire new organism requires totipotency, which is a property only of the zygote and earliest embryonic cells, not of adult stem cells.
Common Mistakes
- Choosing A (1 and 3) because 'mitosis' and 'repair' both sound related to stem cells — but statement 1 is poorly worded and statement 3 overstates adult stem cell potential.
- Choosing C (2 and 3) because the student remembers stem cells can 'make new things' and conflates embryonic and adult stem cell powers.
- Choosing B (1 only), accepting the misleading wording of statement 1 while missing the clearly correct statement 2.
Things to Be Careful About
- Distinguish adult from embryonic stem cells. Embryonic stem cells are pluripotent (almost all cell types) but still cannot form a whole new organism on their own — only the zygote/very early embryo is totipotent enough to do that. So statement 3 is wrong even for embryonic stem cells.
- Read the wording of statement 1 carefully: 'repair other cells by mitosis' implies the stem cell acts directly on existing cells via mitosis, which is not what happens. The stem cell itself divides to provide replacement cells.
- The mark here depends on precise definitions; the biology terms 'multipotent' vs 'totipotent' are the key to the answer.
Which statements are correct for the mitotic cell cycle?
1 DNA is replicated semi-conservatively during mitosis.
2 DNA is never changed from one generation of cells to the next generation.
3 The daughter cells at the end of a mitotic cell division have the potential to produce the same enzymes as the parent cell.
4 The same quantity of DNA is distributed to the nuclei of two new cells at the end of a mitotic cell division.
Options
A 1 and 2
B 1 and 4
C 2 and 3
D 3 and 4
Working
Statement 1 is incorrect: DNA is replicated semi-conservatively, but this occurs during the S phase of interphase, NOT during mitosis itself.
Statement 2 is incorrect: DNA can be altered by mutations (e.g., errors during replication or damage), so it is not unchanging from one cell generation to the next.
Statement 3 is correct: Mitosis produces two genetically identical daughter cells, so they carry the same genes as the parent cell and therefore have the potential to produce the same enzymes (gene expression permitting).
Statement 4 is correct: At the end of mitosis, the DNA that was doubled during S phase is divided equally between the two daughter nuclei, so each receives the same quantity of DNA.
Statements 3 and 4 are correct.
Answer
D
D
Background Concept
The mitotic cell cycle consists of two main phases: interphase (G₁, S, G₂) and mitosis (prophase, metaphase, anaphase, telophase) followed by cytokinesis.
- During the S phase of interphase, DNA is replicated semi-conservatively. Each chromosome is copied to form two sister chromatids held together at the centromere.
- During mitosis, the sister chromatids are separated and distributed to opposite poles of the cell.
- Cytokinesis then divides the cytoplasm, producing two daughter cells.
Because mitosis is a precise distribution of already-replicated chromosomes (not a re-replication), each daughter cell receives an identical copy of the parent cell's genome. This is why mitosis is the basis of growth, repair, and asexual reproduction.
Understanding the Question
This is a multiple-choice question asking which of four statements correctly describe the mitotic cell cycle. The candidates must apply knowledge of:
- when DNA replication occurs (interphase, not mitosis),
- whether DNA is unchanging across generations (mutations can occur),
- whether daughter cells retain the genetic information needed to make the same proteins,
- whether DNA is equally partitioned at the end of division.
The command word is implicit: identify which statements are correct.
Approach
Evaluate each statement independently against the known biology of the cell cycle, then select the option containing all correct statements.
Step-by-Step Reasoning
Statement 1 — DNA is replicated semi-conservatively during mitosis.
Although semi-conservative replication is the correct mechanism for DNA copying, replication occurs during the S phase of interphase, before mitosis begins. The statement wrongly places replication during mitosis. Incorrect.
Statement 2 — DNA is never changed from one generation of cells to the next.
Mutations can arise from replication errors, radiation, chemicals, or other mutagens. The word "never" makes this claim too absolute. Incorrect.
Statement 3 — The daughter cells at the end of a mitotic cell division have the potential to produce the same enzymes as the parent cell.
Mitosis produces genetically identical daughter cells with the same genome as the parent. They therefore have the same genes and thus the potential to produce the same enzymes, although actual enzyme production depends on gene expression. Correct.
Statement 4 — The same quantity of DNA is distributed to the nuclei of two new cells at the end of a mitotic cell division.
During mitosis, the sister chromatids produced in S phase are separated equally — each daughter nucleus receives an identical set of chromosomes and therefore the same quantity of DNA. Correct.
Statements 3 and 4 are correct → answer D.
Key Takeaways
- DNA replication happens in interphase (S phase), not in mitosis.
- Mitosis distributes already-replicated chromosomes equally to produce two genetically identical daughter nuclei.
- Because daughter cells inherit identical DNA, they have the same genetic potential as the parent cell (including the ability to produce the same enzymes).
- DNA can change between cell generations through mutation, so it is not strictly invariant.
Common Mistakes
- Confusing when DNA is replicated (S phase of interphase) with when it is distributed (mitosis).
- Believing that identical daughter cells always do make the same enzymes — gene expression depends on regulation, not just on the genes being present; the question wisely says "have the potential to".
- Accepting "DNA is never changed" because mutations are rare; in biology the rare-but-possible event is enough to make "never" wrong.
Things to Be Careful About
- The semi-conservative mechanism of replication is correct, but the timing (S phase, not mitosis) makes statement 1 false.
- "Potential to produce" is the safe wording in statement 3 — actual enzyme levels vary with cell type and regulation, but the genetic capability is identical.
- After mitosis, each daughter nucleus has the same DNA quantity as the parent cell originally had (the doubled DNA from S phase is split evenly).
The photomicrograph shows a stage of the cell cycle.
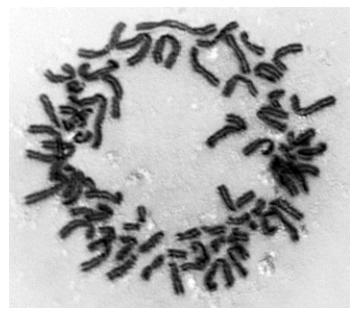
Which stage is shown in the photomicrograph?
Options
A anaphase
B interphase
C metaphase
D telophase
Working
The chromosomes are condensed and clearly visible as discrete structures, which rules out interphase (where chromatin is diffuse and a nuclear envelope is present). The chromosomes are arranged in a ring/circular pattern at the centre (equator) of the cell, forming the metaphase plate. They have not separated into two groups moving toward opposite poles (which would indicate anaphase), and there is only one group of chromosomes with no reformation of nuclear envelopes (which would indicate telophase).
Answer
C
C
Background Concept
Mitosis is a continuous process divided into four named stages, each with a diagnostic chromosome appearance:
- Prophase — chromosomes condense and become visible; the nuclear envelope breaks down; spindle forms.
- Metaphase — chromosomes, each consisting of two sister chromatids joined at the centromere, line up on the metaphase plate at the equator of the cell, attached to spindle fibres from opposite poles.
- Anaphase — the centromeres split and sister chromatids are pulled apart toward opposite poles by shortening spindle fibres.
- Telophase — chromatids arrive at opposite poles, decondense, and new nuclear envelopes form; cytokinesis follows.
Interphase is not a mitotic stage but the long non-dividing phase (G1, S, G2) preceding mitosis, during which DNA replicates but chromosomes are not visible as discrete bodies — the chromatin is diffuse within an intact nucleus.
Understanding the Question
The question presents a single photomicrograph (Fig. 23.1) and asks the candidate to identify which stage of the cell cycle it shows, choosing from anaphase, interphase, metaphase, or telophase. The decision rests on the position, arrangement, and condensation state of the chromosomes visible in the image.
Approach
Examine the image systematically:
- Are chromosomes visible as discrete, condensed bodies? If no → interphase.
- Are they lined up in a single ring/line at the cell's equator? If yes → metaphase.
- Are they in two separate clusters moving toward (or arrived at) opposite poles? If moving → anaphase; if at poles with reforming nuclei → telophase.
Step-by-Step Reasoning
The photomicrograph shows darkly stained, condensed chromosomes arranged in a circular/ring pattern around the centre of the cell, with no separation into two groups. This ring of chromosomes at the cell's equator is the classic appearance of the metaphase plate.
- Not interphase (B): chromosomes are clearly visible as individual condensed bodies, so the cell is not in interphase — during interphase the genetic material is diffuse chromatin and no discrete chromosomes can be seen.
- Not anaphase (A): in anaphase the sister chromatids have separated and are moving to opposite poles, producing two distinct clusters. Here, all the chromosomes are still in a single central ring.
- Not telophase (D): telophase would show two reforming nuclei at opposite poles with decondensing chromosomes. This image shows a single ring of condensed chromosomes.
- Metaphase (C): the central ring of condensed chromosomes at the cell's equator matches the metaphase plate exactly.
Key Takeaways
- The single most reliable diagnostic feature for metaphase is the alignment of chromosomes on the equatorial plate (metaphase plate).
- Interphase is ruled out immediately by the visibility of discrete condensed chromosomes.
- The distinction between anaphase and telophase hinges on whether chromosomes are still single (metaphase) or already separated into two groups (anaphase) that have decondensed into new nuclei (telophase).
Common Mistakes
- Confusing metaphase with anaphase because chromosomes look "spread out" — the key is to check whether they are in one ring (metaphase) or two groups (anaphase).
- Choosing interphase when the chromosomes are dark and obvious — interphase shows a smooth, uniformly stained nucleus with no individual chromosomes visible.
- Confusing the appearance with prophase, where chromosomes are condensed but scattered through the cell, not aligned on a central plate.
Things to Be Careful About
- Chromosomes in metaphase can appear as a ring (as in this image) or as a single line across the cell, depending on the orientation of the section — both are valid metaphase appearances.
- The image is a 2D section through a 3D cell, so the metaphase plate may not always look like a perfect line; a circular cluster of chromosomes at the centre is equally diagnostic.
- Always rule out interphase first by checking whether discrete chromosomes are visible — if they are, the cell is in some stage of mitosis (prophase, metaphase, anaphase or telophase), not interphase.
The diagram represents a molecule of ATP.
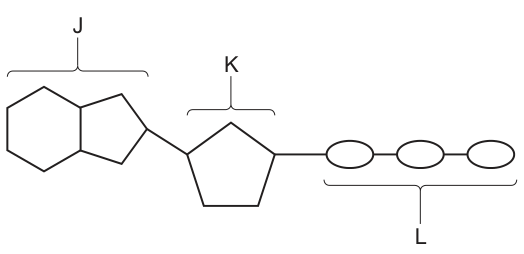
What are the components of ATP labelled J, K and L?
Options
| J | K | L | |
|---|---|---|---|
| A | adenine | deoxyribose | phosphates |
| B | adenosine | pentose | a phosphate group |
| C | adenosine | ribose | phosphorus |
| D | purine | pentose | phosphates |
Working
An ATP molecule is a nucleotide built from three parts: a nitrogenous base, a pentose sugar and a chain of phosphate groups.
- J points to the double-ring nitrogenous base. Adenine is a purine, so J = purine.
- K points to the five-carbon sugar. Ribose is a pentose sugar, so K = pentose.
- L points to the three linked phosphate groups, so L = phosphates.
The other options are wrong because ATP contains ribose (not deoxyribose), J is the base alone (not the base plus sugar, which would be adenosine), and the chain is a group of phosphate groups (not free phosphorus atoms).
Answer
D
D
Background Concept
ATP (adenosine triphosphate) is a nucleotide — the same class of molecule that builds DNA and RNA. Every nucleotide has the same three-part structure:
- A nitrogenous base — a carbon- and nitrogen-containing ring. Bases fall into two groups:
- Purines (double ring): adenine (A) and guanine (G).
- Pyrimidines (single ring): cytosine (C), thymine (T) and uracil (U).
- A pentose sugar — a 5-carbon sugar. Ribose (in ATP, RNA) has an –OH on C2; deoxyribose (in DNA) has only –H on C2.
- One or more phosphate groups bonded to the 5' carbon of the sugar. ATP has three, linked by two high-energy phosphoanhydride bonds.
In ATP specifically, the base is adenine (a purine), the sugar is ribose, and there are three phosphates. Together the base + sugar form adenosine; adding one phosphate gives adenosine monophosphate (AMP), two gives diphosphate (ADP) and three gives triphosphate (ATP).
Understanding the Question
The diagram shows the three parts of an ATP molecule with brackets labelling them J, K and L. The question asks you to match the correct biological name to each label. The command word "What are the components…" simply requires identification.
Approach
Read the diagram carefully:
- J bracket → the double-ring structure on the left = the nitrogenous base (adenine, a purine).
- K bracket → the five-sided ring in the middle = the pentose sugar (ribose).
- L bracket → the three linked ovals on the right = the chain of three phosphate groups.
Then scan the four options for the row that uses these three correct terms.
Step-by-Step Reasoning
- Option A (adenine | deoxyribose | phosphates): Adenine and phosphates are correct, but ATP contains ribose, not deoxyribose. Deoxyribose is the sugar in DNA; ribose is the sugar in ATP and RNA. Reject.
- Option B (adenosine | pentose | a phosphate group): Adenosine = base + sugar together, but J is labelling only the base, not the base+sugar unit. K is the sugar (a pentose is acceptable) and L is a chain of three phosphates, not "a phosphate group". Reject.
- Option C (adenosine | ribose | phosphorus): Same problem as B — J is the base alone, not adenosine. Also, L is a group of phosphate groups (PO₄ units bonded to each other), not free phosphorus atoms. Reject.
- Option D (purine | pentose | phosphates): Adenine is correctly classed as a purine; ribose is correctly classed as a pentose (5-carbon sugar); the three linked units are correctly called phosphates. Accept.
Key Takeaways
- ATP = adenine (a purine) + ribose (a pentose) + three phosphate groups.
- Adenine and guanine are purines (double ring); cytosine, thymine and uracil are pyrimidines (single ring).
- Ribose (in RNA/ATP) has a 2'-OH; deoxyribose (in DNA) has a 2'-H.
- "Adenosine" = base + sugar; the number of phosphates is denoted by mono-, di-, tri-.
Common Mistakes
- Calling the ribose "deoxyribose" because the names sound similar — this is the defining difference between DNA and RNA/ATP.
- Confusing "adenosine" (base + sugar) with "adenine" (base only) — the bracket in the diagram is doing the disambiguating work for you.
- Calling the phosphate chain "phosphorus" — these are phosphate groups (PO₄³⁻) bonded to each other, not elemental phosphorus atoms.
- Forgetting that "pentose" is a category (any 5-carbon sugar), not a specific sugar — ribose, deoxyribose, ribulose and xylulose are all pentoses.
Things to Be Careful About
- Read each bracket in the diagram precisely: J covers only the double ring, K only the pentagon, L only the chain of ovals. Don't let adjacent parts bleed into the same label.
- The mark scheme accepts the broader class name (purine, pentose) rather than demanding the specific molecule (adenine, ribose). Either is biologically correct, but the answer must match one of the offered options.
- In CIE mark schemes, "phosphates" (with an s) is the accepted term for the chain of three units — not "phosphorus" or "phosphate group" (singular) unless only one is being referred to.
Which statements about complementary base pairing are correct?
1 It occurs during translation.
2 Purines and pyrimidines are the same size.
3 The base pairs are of equal length.
4 Uracil forms three hydrogen bonds with adenine.
Options
A 1 and 2
B 1 and 3
C 2 and 3
D 3 and 4
Working
Check each statement:
- It occurs during translation. Codons on mRNA pair with anticodons on tRNA by complementary base pairing. ✓ Correct
- Purines and pyrimidines are the same size. Purines (A, G) have a double ring; pyrimidines (C, T, U) have a single ring — purines are larger. ✗ Incorrect
- The base pairs are of equal length. A purine (double ring) always pairs with a pyrimidine (single ring), giving every base pair the same total width. ✓ Correct
- Uracil forms three hydrogen bonds with adenine. A–U (and A–T) form two hydrogen bonds; only G–C forms three. ✗ Incorrect
Statements 1 and 3 are correct.
Answer
B
B
Background Concept
DNA and RNA are polynucleotides whose nitrogenous bases pair in a strictly complementary way. There are two families of bases:
- Purines — adenine (A) and guanine (G). They have a double-ring structure (a six-membered ring fused to a five-membered ring) and are therefore larger.
- Pyrimidines — cytosine (C), thymine (T) and uracil (U). They have a single ring and are therefore smaller.
Because a purine always pairs with a pyrimidine, the total width of every base pair is constant. This uniformity is what allows the two polynucleotide strands (in DNA) or the codon–anticodon interaction (in translation) to have a regular, uniform geometry.
The hydrogen-bonding pattern is also specific:
- A pairs with T (in DNA) or U (in RNA) using 2 hydrogen bonds.
- G pairs with C using 3 hydrogen bonds.
Understanding the Question
This MCQ asks the candidate to judge the truth of four separate statements about complementary base pairing. The mark scheme requires identifying which two are correct. The full marks are awarded only for selecting the option containing those two correct statements.
Approach
Go through each statement one by one, deciding true or false:
-
Does complementary base pairing occur in translation? Recall the central dogma: DNA → mRNA → protein. Translation uses mRNA codons, and each codon base-pairs with the anticodon of a tRNA carrying the corresponding amino acid. So yes, complementary base pairing is central to translation.
-
Are purines and pyrimidines the same size? Compare ring structures — purines are double rings, pyrimidines are single rings. They are different sizes, but together (one of each) they form a base pair of constant width.
-
Are base pairs of equal length? Yes, by the reasoning above — the larger purine plus the smaller pyrimidine always adds up to the same width. This is the structural reason the DNA double helix is uniform.
-
How many H-bonds between uracil and adenine? A–U is the RNA equivalent of A–T and forms two H-bonds, not three. G≡C is the pair that forms three H-bonds.
Step-by-Step Reasoning
- Statement 1 (true): During translation, each mRNA codon (e.g. 5′-AUG-3′) base-pairs with the complementary anticodon of a tRNA (3′-UAC-5′). This is complementary base pairing.
- Statement 2 (false): Purines and pyrimidines differ in size: purines have two fused rings, pyrimidines one. The DNA helix is uniform precisely because a small (pyrimidine) and a large (purine) always pair together.
- Statement 3 (true): Each A–T, A–U, G–C, or G≡C pair spans the same distance between the two sugar–phosphate backbones because one partner is a single ring and the other is a double ring.
- Statement 4 (false): A–U has 2 hydrogen bonds; the pair with 3 H-bonds is G–C (or G≡C in DNA).
Only statements 1 and 3 are correct, so the answer is B (1 and 3).
Key Takeaways
- Complementary base pairing happens in transcription (DNA–RNA), replication (DNA–DNA) and translation (mRNA–tRNA).
- A purine always pairs with a pyrimidine, which makes every base pair the same width — essential for the regular helical structure.
- A–T and A–U form 2 H-bonds; G–C forms 3 H-bonds. (Higher H-bond number → higher melting temperature, because more energy is needed to separate G–C-rich regions.)
Common Mistakes
- Saying purines and pyrimidines are the same size — they are not; the size difference is what makes a uniform helix possible when they pair together.
- Stating that A–U (or A–T) forms three hydrogen bonds. Many candidates confuse the H-bond count; remember A=2, G=3.
- Forgetting that base pairing occurs in translation. The codon–anticodon interaction is the textbook example of complementary base pairing outside DNA.
Things to Be Careful About
- Read the question carefully — it asks for the two correct statements, not the single most correct one.
- The number of hydrogen bonds is a high-yield recall fact and is often tested directly.
- In some questions the term "base pair" refers only to DNA, but in this syllabus the codon–anticodon interaction in translation is also described as complementary base pairing.
Which statement is correct for protein synthesis?
Options
A During translation, the strand of DNA used is the template strand.
B mRNA is formed when introns are removed from the primary transcript.
C The DNA primary transcript is modified by removing exons.
D tRNA has codons which attach to anticodons on the mRNA.
Working
- A is incorrect: during translation, the template is mRNA, not DNA. DNA is the template during transcription.
- B is correct: the primary transcript (pre-mRNA) contains both exons and introns; introns are removed (by splicing) to leave only the exons, producing the mature mRNA.
- C is incorrect: it is introns that are removed from the primary transcript, not exons. Exons are the coding sequences that are retained.
- D is incorrect: tRNA carries anticodons (not codons), and these pair with codons on the mRNA (not the other way around).
Answer
B
B
Background Concept
Protein synthesis in eukaryotes occurs in two main stages:
- Transcription — in the nucleus, one strand of DNA (the template / antisense strand) is used to synthesise a complementary strand of pre-mRNA (the primary transcript). Both coding regions (exons) and non-coding regions (introns) are initially copied into the pre-mRNA.
- Post-transcriptional modification — introns are spliced out of the primary transcript, and the exons are joined together to form the mature mRNA. This mature mRNA leaves the nucleus and attaches to a ribosome.
- Translation — the ribosome reads the mRNA in triplets called codons. Each codon is recognised by a complementary triplet (anticodon) on a tRNA molecule, which delivers the corresponding amino acid to the growing polypeptide chain.
Key term contrasts to keep straight:
- Exons = coding sequences (kept / expressed).
- Introns = non-coding sequences (removed / intervening).
- Codon = 3-base sequence on mRNA.
- Anticodon = 3-base sequence on tRNA that pairs with the codon.
Understanding the Question
The question presents four statements about protein synthesis and asks which one is correct. Each option targets a different aspect: translation template (A), mRNA processing (B and C), and tRNA structure (D). To score the mark, the student must mentally check each statement against the accepted model of gene expression.
Approach
Work through each option individually, asking:
- Is the molecule/process correctly named?
- Is the direction of information flow correct?
- Are the structural features correctly assigned?
Eliminate any option containing an error, then confirm the surviving answer is fully correct.
Step-by-Step Reasoning
-
Option A — "During translation, the strand of DNA used is the template strand."
- Translation occurs on a ribosome in the cytoplasm, and the template is mRNA, not DNA. The template DNA strand is used during transcription, not translation. → Incorrect.
-
Option B — "mRNA is formed when introns are removed from the primary transcript."
- The primary transcript (pre-mRNA) is processed by removing the non-coding introns and joining the coding exons. The resulting molecule is mature mRNA. → Correct.
-
Option C — "The DNA primary transcript is modified by removing exons."
- Two errors: (i) the primary transcript is RNA, not DNA; (ii) it is introns that are removed, while exons are retained. → Incorrect.
-
Option D — "tRNA has codons which attach to anticodons on the mRNA."
- This reverses the correct terminology. mRNA carries codons; tRNA carries anticodons, and it is the tRNA anticodons that base-pair with mRNA codons. → Incorrect.
Key Takeaways
- The primary transcript is processed by splicing out introns to produce mature mRNA; exons are kept.
- Translation uses mRNA as its template, not DNA.
- Codons are on mRNA; anticodons are on tRNA, and they pair with each other by complementary base pairing.
Common Mistakes
- Confusing introns and exons — students often forget that exons (not introns) are the parts that are expressed and so kept in the final mRNA.
- Believing that translation directly uses DNA — DNA remains in the nucleus during translation; only mRNA reaches the ribosome.
- Reversing codon/anticodon assignments — codons belong to mRNA, anticodons to tRNA.
Things to Be Careful About
- "Primary transcript" refers to the RNA molecule (pre-mRNA), not DNA — calling it a "DNA primary transcript" (as in option C) is wrong on two counts.
- Direction of base pairing is always codon (mRNA) ↔ anticodon (tRNA), never the reverse.
- The template DNA strand is only used during transcription; in translation, the mRNA is read.
A mutation occurred in this original DNA nucleotide sequence.
After the mutation occurred, the new DNA nucleotide sequence coded for the amino acids Asp, Leu, Gly and Glu.
The table shows the amino acids that are coded for by each DNA triplet.
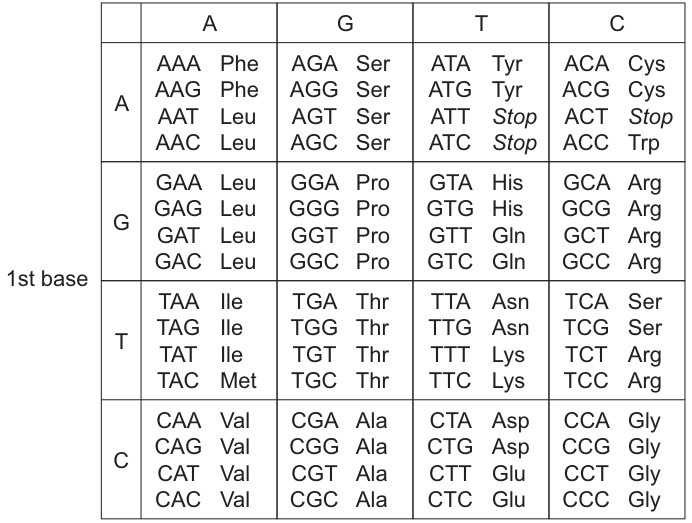
Which type of gene mutation occurred in the DNA nucleotide sequence?
Options
A deletion of one nucleotide
B insertion of one nucleotide
C insertion of two nucleotides
D substitution of one nucleotide
Working
- Decode the original sequence using the table:
(five codons, five amino acids).
-
A substitution of one nucleotide would leave the reading frame intact, so the new sequence would still contain five codons and therefore code for five amino acids. The question states that the new sequence codes for only four amino acids, so substitution (D) cannot be correct.
-
An insertion of one nucleotide would give 16 nucleotides, i.e. five full codons plus one extra base, so the sequence would still code for five amino acids. Insertion of one nucleotide (B) and insertion of two nucleotides (C) are therefore also inconsistent with a 4-amino-acid product.
-
A deletion of one nucleotide gives 14 nucleotides. Reading in triplets from the start, e.g. deleting the A at position 3:
Reading frame:
The first four codons give exactly Asp, Leu, Gly, Glu — matching the amino acids stated in the question.
Answer
A
A
Background Concept
DNA is read three bases at a time. Each triplet (codon) specifies one amino acid, and the amino acids are joined together to form a protein. A gene mutation is a change in the base sequence of a gene, and the three main types you must know are:
- Substitution – one base is swapped for another. The reading frame is preserved, so only the codon containing the changed base (and any downstream codons that happen to coincide with the new reading) is altered. The protein usually still has the same number of amino acids, although one of them may differ (a missense mutation) or translation may stop early (a nonsense mutation if a stop codon is created).
- Insertion – one or more extra bases are added. Because bases are read in threes, every codon after the insertion is shifted, producing a completely different amino acid sequence downstream (a frameshift). The protein is also usually one or more amino acids longer.
- Deletion – one or more bases are removed. This is also a frameshift mutation and has the same disruptive effect as an insertion, except the protein is shorter by the corresponding number of amino acids.
A useful first check when comparing an original and a mutated sequence is therefore the number of codons/amino acids: a substitution leaves this unchanged, whereas a frameshift (insertion or deletion) changes it.
Understanding the Question
You are given an original DNA sequence of 15 bases, grouped into five codons:
and told that, after a mutation, the new sequence codes for exactly four amino acids: Asp, Leu, Gly, Glu. The codon table provided lets you translate any DNA triplet into its amino acid. Your job is to decide which kind of mutation changes a 15-base, 5-amino-acid sequence into one that produces four specific amino acids.
Approach
- Decode the original sequence so you know what amino acids the unchanged gene produces. This anchors the comparison.
- Use the number of amino acids as a discriminator. The mutated sequence produces only four amino acids, so a substitution (which preserves the number of codons) can be ruled out immediately.
- Compare the lengths produced by each remaining option. A deletion of 1 base gives 14 bases; an insertion of 1 base gives 16 bases; an insertion of 2 bases gives 17 bases. Only the 14-base result (deletion) divides into four complete codons plus a leftover, which is consistent with a 4-amino-acid product.
- Confirm by trial — pick a likely deletion point, rewrite the sequence, and translate. If Asp–Leu–Gly–Glu appears in order, the answer is confirmed.
Step-by-Step Reasoning
Step 1 — Translate the original sequence.
Using the supplied table:
| Codon | CTA | GAA | TCC | TCT | CCC |
|---|---|---|---|---|---|
| Amino acid | Asp | Leu | Arg | Arg | Gly |
So the original codes for Asp – Leu – Arg – Arg – Gly (five amino acids).
Step 2 — Rule out substitution (D).
A single substitution changes one base but leaves the other 14 in place. The reading frame is preserved, so the new sequence still contains five codons and therefore five amino acids (one of which is altered). The question states the new sequence codes for four amino acids, so D is wrong.
Step 3 — Rule out insertion options (B and C).
- Inserting one base gives 16 bases → five codons + one leftover → five amino acids (not four).
- Inserting two bases gives 17 bases → five codons + two leftover → five amino acids (not four).
Neither matches a 4-amino-acid product, so B and C are wrong.
Step 4 — Test deletion of one base (A).
A deletion leaves 14 bases. Reading in triplets from the start, the first 12 bases form four codons. Try deleting the A at position 3 (the third base of the first codon):
Original:
After deletion: (14 bases)
Reading frame:
Translate each triplet with the table:
| Codon | CTG | AAT | CCT | CTC |
|---|---|---|---|---|
| Amino acid | Asp | Leu | Gly | Glu |
The first four codons give exactly Asp – Leu – Gly – Glu, with two trailing bases (CC) that do not form a complete codon. This matches the question's information perfectly.
(Other single-base deletions — at positions 4, 5, 6 or 7 — also give a sequence whose first four codons are Asp–Leu–Gly–Glu, confirming that deletion of one nucleotide is the only option consistent with the data.)
Key Takeaways
- A substitution changes a single base but does not alter the reading frame, so the number of amino acids is unchanged.
- An insertion or deletion is a frameshift mutation: every codon after the change is read differently, and the number of amino acids changes by the size of the insertion/deletion.
- When asked to identify a mutation, always translate the original sequence first, then compare lengths and amino acid orders of the possible mutants.
- When using a codon table, read every triplet carefully — a single missing or extra base shifts the entire downstream reading frame.
Common Mistakes
- Choosing substitution because the final amino acids look plausible. A substitution would still give five amino acids, not four, so it cannot produce a 4-amino-acid product.
- Choosing insertion of one nucleotide because the reading frame "looks right" for the first few codons. With an insertion, the new sequence contains 16 bases and will still code for five amino acids; only the first four happen to match.
- Forgetting to translate the original sequence. Without doing this, you cannot check that the new amino acids differ from the old ones, and you may pick an answer that produces a 5-amino-acid product (any insertion or any substitution).
- Reading the codon table incorrectly, e.g. confusing Asp (CTA/CTG) with Glu (CTT/CTC) — they sit in the same row and column block but differ at the 3rd base.
Things to Be Careful About
- The codon table is for DNA triplets, not mRNA codons. In this syllabus the table provided in the question is used directly, so T in DNA still pairs with A in mRNA logic — do not convert to mRNA before using the table.
- The number of amino acids is the decisive clue in this question. Use it to eliminate substitution and both insertion options before testing a deletion.
- A 14-base sequence produces four codons only if the reading starts at base 1. The ribosome always starts at the first AUG (start codon) in mRNA, but in these exam questions translation is assumed to begin at the first base of the written sequence unless told otherwise.
- Note that several different single-base deletions (positions 3, 4, 5, 6 or 7) all give Asp–Leu–Gly–Glu as the first four amino acids. The question only requires you to identify the type of mutation, not the exact position, so any one of these deletions supports the answer.
The photomicrograph shows a longitudinal section of part of a plant stem.
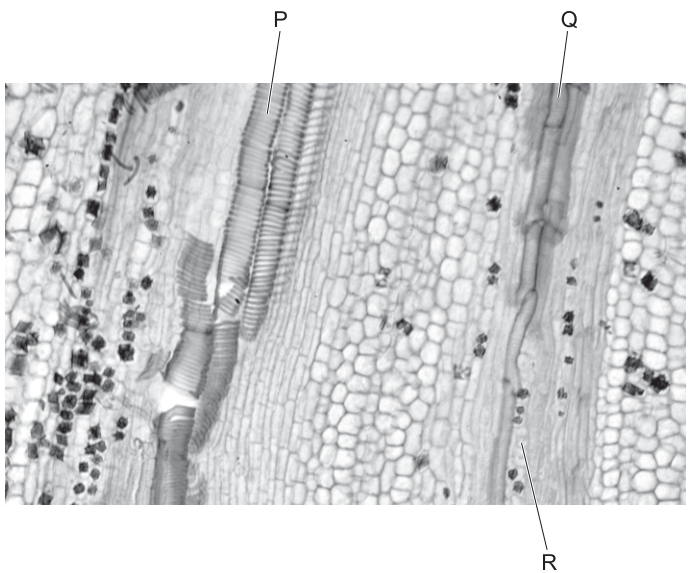
Which row correctly identifies structures P, Q and R?
Options
| P | Q | R | |
|---|---|---|---|
| A | phloem sieve tube element | companion cell | xylem vessel element |
| B | phloem sieve tube element | xylem vessel element | companion cell |
| C | xylem vessel element | phloem sieve tube element | companion cell |
| D | xylem vessel element | companion cell | phloem sieve tube element |
Working
P points to a wide, open tube whose walls show clear spiral/annular (rings) thickening — the diagnostic feature of a xylem vessel element (lignified secondary wall).
Q points to a narrower, thin-walled tube that has transverse sieve plates visible across it — characteristic of a phloem sieve tube element.
R points to a small, densely cytoplasmic cell lying alongside the sieve tube — this is a companion cell.
So: P = xylem vessel element, Q = phloem sieve tube element, R = companion cell.
Answer
C
C
Background Concept
Vascular bundles in a plant stem contain two conducting tissues — xylem and phloem — each made of several cell types with very different structures that are visible in a longitudinal section under the light microscope.
Xylem vessel elements are dead at maturity. They are wide, hollow tubes formed end-to-end by the breakdown of end walls. Their lateral walls are reinforced with lignin in characteristic patterns: spiral, annular (ring-like), reticulate or pitted. In a longitudinal section these wall thickenings appear as bright, regular bands inside a wide, empty lumen.
Phloem sieve tube elements are living cells that lose their nucleus and most organelles at maturity. They are joined end-to-end through sieve plates (perforated end walls) that look like transverse cross-lines crossing the tube. Their lateral walls are thin and unlignified. In a longitudinal section they appear as a narrower tube interrupted at intervals by the sieve plates.
Companion cells are small living cells packed with dense cytoplasm (lots of ribosomes and mitochondria) that lie alongside each sieve tube element. They retain their nucleus and provide the metabolic support that the enucleate sieve tube element cannot provide itself (loading and unloading of sucrose, ATP supply).
Understanding the Question
The photomicrograph shows a longitudinal section through a vascular bundle. Three features are labelled P, Q and R, and the candidate must match each to one of: xylem vessel element, phloem sieve tube element, or companion cell.
The image description tells us:
- P: a wide vessel showing spiral/annular thickening → xylem vessel element
- Q: a narrower tube with sieve plates → phloem sieve tube element
- R: a small dense cell next to the sieve tube → companion cell
Approach
Use the most reliable diagnostic features visible in a longitudinal section:
- Wall thickening pattern — lignified spirals or rings ⇒ xylem.
- Sieve plates — transverse perforated cross-walls ⇒ phloem sieve tube element.
- Size and position — small, dense, squeezed against a sieve tube ⇒ companion cell.
These three features, taken together, identify all the components unambiguously.
Step-by-Step Reasoning
- P is the widest tube in the field of view, and its walls show bold, regular spiral/annular bands of thickening. Only xylem vessel elements have lignified secondary wall thickenings of this type, so P = xylem vessel element.
- Q is a narrower tube with thin walls crossed at intervals by transverse lines (sieve plates). That is the hallmark of a phloem sieve tube element, so Q = phloem sieve tube element.
- R is a small cell with dense contents, sitting right next to the sieve tube. Its position and small size identify it as a companion cell, so R = companion cell.
Matching this to the options:
- A: P = phloem, Q = companion, R = xylem ✗
- B: P = phloem, Q = xylem, R = companion ✗
- C: P = xylem, Q = phloem, R = companion ✓
- D: P = xylem, Q = companion, R = phloem ✗
Key Takeaways
- Xylem vessel elements are recognised by their lignified wall thickenings (spiral, annular, reticulate or pitted) and wide, empty lumens.
- Sieve tube elements are recognised by their sieve plates — transverse perforated end walls.
- Companion cells are recognised by being small, dense and adjacent to a sieve tube element.
- Companion cells are always paired with sieve tube elements; they are never free in the tissue.
Common Mistakes
- Confusing xylem tracheids (narrower, with bordered pits and closed ends) with xylem vessel elements (wider, open, with spiral/annular thickening). The wide lumen and clear spiral/annular thickening point to a vessel element.
- Mistaking ordinary parenchyma cells for companion cells. The diagnostic feature is that the small dense cell must be in direct contact with a sieve tube element.
- Calling the sieve plate a "cell wall". It is a perforated sieve plate — the perforation is what makes the tube conduct.
Things to Be Careful About
- Lignified xylem walls stain differently (often green/red with typical stains) and look much brighter under the microscope than the thin cellulose walls of phloem — this is a useful quick cue.
- Sieve plates can look like ordinary cross-walls at low power; look carefully for the perforated "ladder" appearance, or for cytoplasmic strands passing through.
- Always read each label on the actual image — option D swaps Q and R, which is a common distractor because both structures are in the phloem.
Which statement about the pathway taken by a water molecule travelling from the soil to the xylem is correct?
Options
A A water molecule in a cortex cell that takes the symplast pathway must enter the next cortex cell by passing between two adjacent phospholipid molecules in a cell surface membrane.
B A water molecule can pass into xylem vessels either through pits or through the cell wall of the xylem vessel elements by osmosis.
C A water molecule would pass into the cytoplasm of the endodermal cell if it always takes the apoplast pathway all the way to the xylem.
D A water molecule that has left the endodermal cells can travel by either the apoplast pathway or symplast pathway.
Working
- Apoplast pathway — water moves through cell walls and intercellular spaces without crossing any cell surface membrane.
- Symplast pathway — water moves through the cytoplasm of cells, passing between cells via plasmodesmata.
- At the endodermis, the suberised Casparian strip is impermeable to water, so it blocks the apoplast route. Water in the apoplast must therefore cross the cell surface membrane of an endodermal cell and enter the symplast.
- Once past the endodermis (in the pericycle), water can re-enter the apoplast (cell walls) or continue through the symplast on its way to the xylem.
A — wrong. The symplast pathway crosses between cells via plasmodesmata, not by slipping between phospholipid molecules of a cell surface membrane. (Passing between phospholipids would describe simple diffusion/osmosis across a membrane, which is neither the apoplast nor the symplast route.)
B — wrong. Xylem vessel elements are dead and have no cell surface membrane, so osmosis (which requires a partially permeable membrane) cannot occur. Water enters xylem vessels through pits, driven by mass flow under a pressure gradient (transpiration pull and root pressure), not by osmosis.
C — wrong. The apoplast pathway, by definition, never enters the cytoplasm. Moreover, the Casparian strip prevents the apoplast pathway from continuing all the way to the xylem, so this scenario is biologically impossible.
D — correct. After crossing the endodermis, water is in the pericycle and can travel by either the apoplast or the symplast pathway into the xylem.
Answer
D
D
Background Concept
Water entering a root from the soil follows one of two main routes to reach the xylem:
- Apoplast pathway — water moves through the continuous network of cell walls and intercellular (air-filled) spaces, without crossing any cell surface membrane. The cell wall is freely permeable to water and most small solutes, so the apoplast offers a low-resistance route, but it is interrupted at the endodermis.
- Symplast pathway — water crosses the cell surface membrane and moves through the cytoplasm of cells. From one cell to the next, it passes through plasmodesmata — small cytoplasmic channels that connect adjacent cells — rather than crossing a fresh membrane each time.
The endodermis is a single ring of cells surrounding the vascular tissue. Its radial and transverse walls are impregnated with suberin in the Casparian strip, which is waterproof. This forces any water travelling in the apoplast to stop and either:
- cross the cell surface membrane of the endodermal cell and join the symplast, or
- take the symplast pathway through the endodermal cell from the start.
Past the endodermis, in the pericycle, water can rejoin the apoplast or continue in the symplast, before finally entering the dead, hollow xylem vessels through pits in their lateral walls. Movement of water from the roots up the xylem is by mass flow, driven by the pressure gradient produced by transpiration pull (and root pressure at night), not by osmosis.
Understanding the Question
The stem asks which single statement about the soil-to-xylem water pathway is correct. Each option targets a different detail of the pathway: the symplast route itself (A), how water enters xylem (B), the apoplast at the endodermis (C), and the freedom of route choice past the endodermis (D). The 1-mark MCQ format means you must select the one option that survives careful scrutiny, not just the one that "sounds right".
Approach
For each option, ask: does the biology of the apoplast/symplast pathways and the endodermis support this statement exactly as worded? Any error in mechanism (wrong route, wrong membrane, wrong driver) eliminates the option. The mark scheme rewards precision: the word osmosis in B, the phrase pass into the cytoplasm in C, and between phospholipid molecules in A are all red flags because they conflict with the definitions.
Step-by-Step Reasoning
Option A says a water molecule in the symplast "must enter the next cortex cell by passing between two adjacent phospholipid molecules in a cell surface membrane." The symplast route uses plasmodesmata — the water does not exit one cell, cross a phospholipid bilayer, and re-enter the next cell. So the description in A confuses simple diffusion across a membrane with symplastic movement. Reject A.
Option B says water can enter xylem either through pits or through the cell wall of the xylem vessel element "by osmosis". Two problems:
- Xylem vessel elements are dead and lack a cell surface membrane, so osmosis (which requires a partially permeable membrane) cannot occur.
- Water that does enter xylem through pits does so by mass flow under a pressure gradient, not osmosis.
Reject B.
Option C says a water molecule "would pass into the cytoplasm of the endodermal cell if it always takes the apoplast pathway all the way to the xylem." This contains an internal contradiction: the apoplast pathway, by definition, never crosses into the cytoplasm. Worse, it is biologically impossible for water to take the apoplast pathway all the way to the xylem, because the Casparian strip of the endodermis blocks that route. Water in the apoplast is forced to cross into the symplast at the endodermis, not the other way around. Reject C.
Option D says a water molecule that has left the endodermal cells can travel by either pathway. Once past the Casparian strip, water is in the pericycle, where the apoplast and symplast are both continuous and available. Water can therefore re-enter the apoplast (cell walls) or continue through the symplast on its way to the xylem. This is correct. Accept D.
Key Takeaways
- Apoplast = cell walls + intercellular spaces; never crosses a membrane.
- Symplast = cytoplasm + plasmodesmata; does not pass between phospholipids of a membrane to go cell-to-cell.
- Casparian strip at the endodermis blocks the apoplast and forces water to enter the symplast.
- Past the endodermis, both pathways are open again in the pericycle.
- Water enters xylem by mass flow (driven by a pressure gradient), not osmosis, because xylem vessel elements are dead and lack a plasma membrane.
Common Mistakes
- Confusing plasmodesmata (cytoplasmic connections; symplast) with movement across a cell surface membrane (apoplast would exclude this, symplast uses plasmodesmata).
- Thinking water enters xylem by osmosis because it is "moving up". Xylem vessel elements are dead; movement is by mass flow.
- Believing the apoplast pathway runs unbroken from soil to xylem. The Casparian strip breaks it at the endodermis.
- Treating "enters the cytoplasm" as a feature of the apoplast. The apoplast, by definition, never enters the cytoplasm.
Things to Be Careful About
- The precise wording of each option matters — MCQs at A-Level often hinge on a single word (e.g. "osmosis" in B, "always" in C, "must" in A).
- The symplast pathway involves cytoplasm and plasmodesmata; do not omit the plasmodesmata.
- The apoplast is blocked at the endodermis only — once past the endodermis, both pathways are open, which is what makes D correct.
- "Osmosis" requires a partially permeable membrane; cell walls and xylem vessel element walls do not meet this criterion.
Amino acids move from a phloem sieve tube element into a root cell.
What are the changes to the water potential and the volume of liquid in the phloem sieve tube element at the sink, when this event is happening?
Options
| water potential in the phloem sieve tube element | volume of liquid in the phloem sieve tube element | |
|---|---|---|
| A | becomes higher | decreases |
| B | becomes higher | increases |
| C | becomes lower | decreases |
| D | becomes lower | increases |
Working
At a sink, amino acids (assimilates) are actively unloaded from the phloem sieve tube element into the surrounding root cell. This reduces the solute concentration inside the sieve tube, so the water potential of the sieve tube element becomes higher (less negative). Water therefore leaves the sieve tube element by osmosis, down the water potential gradient into the root cell, and the volume of liquid inside the sieve tube element decreases.
Answer
A
A
Background Concept
Phloem transports assimilates (sucrose, amino acids and other organic solutes) from sources (e.g. photosynthesising leaves, storage organs being mobilised) to sinks (e.g. roots, developing fruits, growing shoots, storage tissues). The accepted mechanism is the mass flow hypothesis: at a source, solutes are actively loaded into sieve tube elements, lowering their water potential so water enters by osmosis from the xylem; this generates a positive hydrostatic pressure that pushes the sap along the sieve tube. At a sink, the reverse happens: solutes are actively unloaded, raising the water potential inside the sieve tube element so water leaves by osmosis, and the local hydrostatic pressure falls.
Water potential () has two main components relevant here: solute potential () and pressure potential (). Adding solutes lowers (more negative); removing solutes raises (less negative). Water moves down a water potential gradient from higher (less negative) to lower (more negative) by osmosis.
Understanding the Question
The scenario describes a specific moment in phloem transport: assimilates (amino acids) are leaving a sieve tube element at a sink (a root cell). We must predict the immediate consequences of that unloading event on the sieve tube element itself — specifically, how its water potential changes and what happens to the volume of liquid inside it.
The command word is implicit "what"; we are choosing between four paired combinations of change in and change in volume.
Approach
- Identify the effect of removing amino acids on the solute concentration inside the sieve tube element.
- Translate that into a change in water potential.
- Decide the direction of water movement by osmosis given the new water potential gradient.
- Conclude the resulting change in the volume of liquid inside the sieve tube element.
Step-by-Step Reasoning
- Step 1 — Unloading reduces solutes inside the sieve tube. Amino acids are actively transported out of the sieve tube element into the root cell, so the solute concentration of the sap inside the sieve tube falls.
- Step 2 — Lower solute concentration → higher (less negative) water potential. Because dissolved solutes lower , removing them makes less negative, i.e. the water potential becomes higher. (At the same time, also falls as the hydrostatic pressure that built up at the source relaxes, but the dominant change being tested here is the response to solute loss.)
- Step 3 — Water leaves the sieve tube by osmosis. With the sieve tube's now higher than that of the surrounding root cell / xylem water, water moves out of the sieve tube element down the water potential gradient, into the root cell and towards the xylem.
- Step 4 — Volume of liquid decreases. Because water is leaving the sieve tube element while solutes have been removed, the volume of liquid in the sieve tube element falls.
Combining the two changes: water potential becomes higher and volume decreases — option A.
Key Takeaways
- Sources load solutes → falls → water enters → pressure builds up.
- Sinks unload solutes → rises → water leaves → pressure drops.
- Water always moves from a region of higher (less negative) to lower (more negative) .
- This pressure difference between source and sink is what drives mass flow along the phloem.
Common Mistakes
- Confusing the direction of water potential change. A common error is to think that because solutes are leaving, the solution becomes more dilute, but then to state the becomes "lower". In fact, less solute = less negative = higher .
- Forgetting that water follows the solutes osmotically. Some students correctly identify that solutes are removed but then assume the volume of liquid in the sieve tube stays the same or increases. Water leaves the sieve tube by osmosis, so volume must fall.
- Reversing source and sink logic. If you treat the root cell as a source (where it would be loading solutes), you would pick option D. Make sure you identify which end is the source and which is the sink before answering.
Things to Be Careful About
- The question asks about the sieve tube element at the sink, not at the source. The same mechanism produces the opposite changes at a source.
- "Higher" water potential means less negative (numerically larger, e.g. from to ). It does not mean a larger magnitude of the negative value.
- Both the change and the volume change must be answered together; the answer depends on pairing the correct effect on each.
The table shows the comparison of blood pressure in three main blood vessels during diastole.
| vessel 1 | vessel 2 | vessel 3 | |
|---|---|---|---|
| blood pressure in the vessel during diastole | low | very high | high |
Which row identifies the three blood vessels?
Options
| vessel 1 | vessel 2 | vessel 3 | |
|---|---|---|---|
| A | pulmonary vein | pulmonary artery | aorta |
| B | vena cava | aorta | pulmonary vein |
| C | pulmonary vein | aorta | pulmonary artery |
| D | pulmonary artery | pulmonary vein | vena cava |
Working
During diastole the ventricles relax, but blood pressure is maintained in arteries by elastic recoil of their walls.
- Venae cavae and pulmonary veins are veins → low diastolic pressure. So vessel 1 (low) must be the pulmonary vein (or vena cava).
- The aorta is part of the systemic circulation, where the left ventricle generates the highest pressure in the body → very high diastolic pressure. So vessel 2 (very high) is the aorta.
- The pulmonary artery receives blood from the right ventricle; the right ventricle wall is thinner and generates a lower pressure than the left → high, but lower than the aorta. So vessel 3 (high) is the pulmonary artery.
Checking option C: pulmonary vein (low), aorta (very high), pulmonary artery (high) — matches.
Answer
C
C
Background Concept
Mammals have a closed double circulation: the right side of the heart pumps deoxygenated blood through the pulmonary artery to the lungs, and the left side pumps oxygenated blood through the aorta to the rest of the body. Blood returns to the right atrium via the vena cava and to the left atrium via the pulmonary veins.
Blood pressure is highest in arteries leaving the ventricles and falls as blood passes through arterioles, capillaries and veins. The pressure maintained in an artery during diastole (when the ventricle is relaxed) depends on the elasticity of its wall and the volume of blood it receives with each beat.
Understanding the Question
The table gives three vessels and three diastolic pressure descriptions: low, very high and high. The task is to match these to pulmonary vein, pulmonary artery, aorta, and vena cava. You must know the relative diastolic pressures in each vessel.
Approach
Rank the vessels by diastolic pressure:
- Veins (vena cava, pulmonary vein) — have thin walls, large lumens, no elastic recoil, and carry blood back to the heart at low pressure. → low
- Pulmonary artery — receives blood from the right ventricle, whose muscle wall is thinner than the left ventricle's, so it generates a lower systolic pressure (~25 mmHg vs ~120 mmHg). Diastolic pressure is correspondingly lower than in the aorta. → high
- Aorta — receives blood from the left ventricle (thickest, most muscular wall in the heart) and has very elastic walls that recoil during diastole, maintaining a high pressure to keep blood moving between heartbeats. → very high
So: low = pulmonary vein (or vena cava), very high = aorta, high = pulmonary artery.
Step-by-Step Reasoning
- Vessel 1 (low): only option C places a vein here (pulmonary vein). Option B also gives a low value to a vein (vena cava), but option B fails at vessel 3. Option A wrongly puts the pulmonary vein at low (correct) but option A makes vessel 2 the pulmonary artery and vessel 3 the aorta — that swap is wrong because the aorta has a higher diastolic pressure than the pulmonary artery.
- Vessel 2 (very high): must be the aorta. Only options B and C place the aorta here. Option B then puts the pulmonary vein at vessel 3 (high), which is wrong — veins cannot have a high diastolic pressure. Option C correctly puts the aorta here.
- Vessel 3 (high): must be the pulmonary artery, which is the only vessel with a diastolic pressure between that of the aorta and that of the veins. Only option C places the pulmonary artery here.
Therefore the matching is: pulmonary vein (low) — aorta (very high) — pulmonary artery (high), which is option C.
Key Takeaways
- Diastolic pressure is maintained by elastic recoil of the arterial wall; the thicker-walled systemic arteries sustain higher diastolic pressure than pulmonary arteries.
- Order of diastolic pressure: aorta > pulmonary artery > veins.
- The right ventricle generates lower pressure than the left because the pulmonary circuit is shorter and the resistance is lower.
Common Mistakes
- Confusing the pulmonary artery with the pulmonary vein: the pulmonary artery carries deoxygenated blood from the right ventricle to the lungs; the pulmonary vein carries oxygenated blood from the lungs to the left atrium. The artery has high diastolic pressure, the vein low.
- Assuming all arteries have the same pressure as the aorta. The pulmonary artery is much lower pressure because the right ventricle has a thinner wall.
- Forgetting that during diastole, the pressure in arteries is maintained by elastic recoil, not by active pumping — so the relative ordering is set by the wall properties, not the heart's current action.
Things to Be Careful About
- The pulmonary artery is the only artery in the body that carries deoxygenated blood; this often catches students out.
- The aorta has the highest diastolic pressure (~80 mmHg at rest); the pulmonary artery is high but lower (~8–10 mmHg diastolic). Veins are typically 2–5 mmHg.
- Do not assume "artery = high pressure" without comparing within arteries — the question is explicitly about ranking the three vessels.
Red blood cells may contain a molecule known as 2,3-bisphosphoglycerate (2,3-BPG).
When 2,3-BPG binds to haemoglobin, a higher partial pressure of oxygen is needed to bring about 50% saturation of haemoglobin with oxygen.
Which statements about the effect of 2,3-BPG are correct?
1 2,3-BPG in red blood cells causes the oxygen dissociation curve to shift to the right.
2 The binding of 2,3-BPG to haemoglobin reduces the Bohr effect.
3 The binding of 2,3-BPG to haemoglobin lowers the affinity of the haemoglobin for oxygen.
Options
A 1, 2 and 3
B 1 and 2 only
C 1 and 3 only
D 2 and 3 only
Working
- Statement 1: A higher is needed to give 50% saturation when 2,3-BPG is bound, so the curve shifts to the right. Correct.
- Statement 2: The Bohr effect describes how increased /lower pH reduces haemoglobin's affinity for ; 2,3-BPG does not reduce this effect (the two act in parallel to promote unloading). Incorrect.
- Statement 3: Needing a higher to reach 50% saturation means haemoglobin has a lower affinity for when 2,3-BPG is bound. Correct.
Answer
C
C
Background Concept
Haemoglobin is a tetramer of four polypeptide chains (two α and two β), each carrying a haem group with an Fe²⁺ ion that reversibly binds O₂. Its oxygen-binding behaviour is summarised by the oxygen dissociation curve, which plots the percentage saturation of haemoglobin against the partial pressure of oxygen (). The curve is sigmoid because binding of O₂ to one subunit increases the affinity of the remaining subunits (cooperative binding).
Several factors shift this curve. A rightward shift means a higher is needed to achieve the same percentage saturation — i.e. haemoglobin has a lower affinity for O₂ and releases it more readily. A leftward shift means higher affinity and reduced unloading. Important right-shifting factors in respiring tissues include:
- increased ,
- decreased pH (more H⁺, the Bohr shift),
- higher temperature,
- more 2,3-bisphosphoglycerate (2,3-BPG).
2,3-BPG is a small, negatively charged molecule produced in red blood cells from a glycolytic intermediate. It binds in the central cavity of deoxyhaemoglobin (between the two β-chains), stabilising the T (taut/deoxy) conformation. This decreases haemoglobin's overall affinity for O₂, so for any given less O₂ is bound, and the curve shifts right.
The Bohr effect is a separate, though complementary, phenomenon: in metabolically active tissues, enters red blood cells, is converted by carbonic anhydrase to , which dissociates to H⁺ and ; the H⁺ binds to haemoglobin, lowering its O₂ affinity and promoting unloading.
Understanding the Question
The stem tells us that when 2,3-BPG binds haemoglobin, a higher is needed to reach 50% saturation. This is the key fact the candidate must apply to three statements and decide which combination of correct statements matches one of the four options.
The command word is implicit in the MCQ format: evaluate each numbered statement as true or false, then pick the option that lists exactly the true ones.
Approach
For each statement, link the idea back to (a) what the oxygen dissociation curve looks like with and without 2,3-BPG and (b) the definition of the Bohr effect. The phrase "higher partial pressure of oxygen is needed to bring about 50% saturation" is equivalent to "lower affinity for O₂" and to "a rightward shift of the curve."
Step-by-Step Reasoning
Statement 1 — "2,3-BPG in red blood cells causes the oxygen dissociation curve to shift to the right."
The given information (higher for 50% saturation) is precisely the definition of a rightward shift. So 1 is correct.
Statement 2 — "The binding of 2,3-BPG to haemoglobin reduces the Bohr effect."
The Bohr effect is the reduction in O₂ affinity caused by H⁺ (and CO₂) released in respiring tissues. 2,3-BPG does not diminish this effect; both act in the same direction to promote O₂ unloading in tissues. 2,3-BPG is essentially constant regardless of the local /pH, so it cannot "reduce" the Bohr shift. So 2 is incorrect.
Statement 3 — "The binding of 2,3-BPG to haemoglobin lowers the affinity of the haemoglobin for oxygen."
A rightward shift of the dissociation curve, by definition, reflects a lower affinity of haemoglobin for O₂. The given information directly says this. So 3 is correct.
Therefore statements 1 and 3 only are correct → option C.
Key Takeaways
- 2,3-BPG binds in the central cavity of deoxyhaemoglobin and stabilises the T state, decreasing O₂ affinity and shifting the dissociation curve to the right.
- A rightward shift = higher needed to reach any given saturation = lower affinity = more O₂ released to tissues.
- The Bohr effect (H⁺/CO₂) and 2,3-BPG are distinct mechanisms that act additively, not antagonistically.
- 2,3-BPG levels rise at high altitude and in chronic hypoxia, enhancing O₂ delivery when it is most needed.
Common Mistakes
- Treating the Bohr effect and 2,3-BPG action as the same thing — they are independent ways of reducing O₂ affinity; one does not "reduce" the other.
- Confusing direction of shift with affinity: right = lower affinity, left = higher affinity.
- Assuming 2,3-BPG increases haemoglobin's affinity because it "binds" to it — binding does not always mean increased function; here it stabilises the deoxy form.
Things to Be Careful About
- The phrase "higher partial pressure of oxygen is needed to bring about 50% saturation" is the exam's way of saying "lower affinity"; do not misread it.
- 2,3-BPG binds to deoxyhaemoglobin, not the O₂-bound (R) form — this is why it specifically lowers O₂ affinity.
- Levels of 2,3-BPG are altered in conditions such as high altitude, fetal haemoglobin (HbF binds 2,3-BPG poorly, hence its higher affinity), and in stored blood (levels fall, increasing affinity and reducing O₂ delivery on transfusion).
A person has a small hole in the septum between the ventricles. This is called a ventricular septal defect (VSD). The person has no other heart defects.
What is the direction of the net flow of blood during ventricular systole in the heart of this person?
Options
A left ventricle to left atrium
B right ventricle to right atrium
C left ventricle to right ventricle
D right ventricle to left ventricle
Working
During ventricular systole, both ventricles contract simultaneously. The left ventricular wall is much thicker than the right, so it generates a much higher pressure (≈ 120 mmHg) than the right ventricle (≈ 25 mmHg).
Blood flows down a pressure gradient. With a hole in the interventricular septum, blood will be forced from the high-pressure left ventricle through the defect into the low-pressure right ventricle (a left-to-right shunt).
Answer
C
C
Background Concept
The heart is a double pump. The right side pumps deoxygenated blood to the lungs via the pulmonary circulation; the left side pumps oxygenated blood to the rest of the body via the systemic circulation. The two pumps work at very different pressures because the resistance of the systemic circulation is far greater than that of the pulmonary circulation.
To generate these different pressures, the muscular walls of the two ventricles differ in thickness:
- Left ventricle: very thick, muscular wall (≈ 8–15 mm). It must push blood through the entire systemic circulation, generating a peak systolic pressure of about 120 mmHg.
- Right ventricle: thinner wall (≈ 3–5 mm). It only needs to push blood through the low-resistance pulmonary circulation, generating a peak systolic pressure of about 25 mmHg.
During ventricular systole, the atrioventricular valves (bicuspid and tricuspid) close, so blood cannot flow back into the atria. The semilunar valves (aortic and pulmonary) are pushed open by the contracting ventricles, and blood is ejected into the aorta and pulmonary artery.
A ventricular septal defect (VSD) is a congenital hole in the wall (septum) separating the two ventricles. While the heart is contracting, this hole provides a low-resistance pathway between the two chambers.
Understanding the Question
The question describes a person with an isolated VSD — a hole in the interventricular septum, with no other defects. It asks specifically about the direction of the net flow of blood during ventricular systole, when both ventricles are actively contracting and the ventricular pressures are at their peak.
The key physics principle: blood (like any fluid) flows from regions of higher pressure to regions of lower pressure. So the answer depends entirely on which ventricle has the higher pressure at this moment in the cardiac cycle.
Approach
- Recall the relative pressures in the left and right ventricles during systole.
- Apply the pressure-gradient rule to determine flow direction through the septal hole.
- Eliminate the options that describe flows which are not through the septal defect or that go against the pressure gradient.
Step-by-Step Reasoning
Step 1 — Compare ventricular pressures.
At the peak of ventricular systole, the left ventricle generates approximately 120 mmHg of pressure, while the right ventricle generates only about 25 mmHg. The left ventricular pressure is roughly 4–5 times higher than the right.
Step 2 — Apply the pressure gradient.
With a hole in the septum providing a direct communication between the two ventricles, blood will move down the pressure gradient: from the left ventricle (high pressure) to the right ventricle (low pressure). This is called a left-to-right shunt.
Step 3 — Evaluate each option.
- A. Left ventricle → left atrium: This describes mitral regurgitation (a faulty bicuspid valve), not flow through the septum. Reject.
- B. Right ventricle → right atrium: This describes tricuspid regurgitation, again not a septal flow. Reject.
- C. Left ventricle → right ventricle: Consistent with blood flowing from high to low pressure through the septal hole. Correct.
- D. Right ventricle → left ventricle: This would require right ventricular pressure to exceed left ventricular pressure. In an isolated VSD this does not happen; it would only occur in advanced Eisenmenger syndrome, where chronic high pulmonary blood flow causes severe pulmonary hypertension, eventually reversing the shunt. The question states the person has no other defects, so this is not the case. Reject.
Key Takeaways
- The left ventricle has a thicker wall and generates a much higher systolic pressure than the right ventricle because it supplies the high-resistance systemic circulation.
- A VSD causes a left-to-right shunt during systole, with blood being driven from the high-pressure left ventricle into the low-pressure right ventricle.
- Long-standing left-to-right shunting through a VSD increases pulmonary blood flow, which can eventually cause pulmonary hypertension and, in some untreated cases, reversal of the shunt (Eisenmenger syndrome).
- The general principle: blood always flows down a pressure gradient, so knowing which chamber has the higher pressure at a given moment in the cardiac cycle predicts shunt direction.
Common Mistakes
- Choosing D (right → left): Students sometimes forget that the left ventricle generates much higher pressure, or they assume a defect "leaks" from the right side. With an isolated VSD, the right ventricle cannot exceed the left.
- Choosing A or B: These options confuse the VSD with valve regurgitation. A VSD is a hole between the ventricles, not a faulty atrioventricular valve.
- Forgetting the timing: The question specifies ventricular systole. During diastole the ventricles are relaxing and refilling, so the pressure gradient is much smaller and shunting is minimal.
Things to Be Careful About
- Always specify the timing in the cardiac cycle when discussing flow — pressure gradients reverse between systole and diastole.
- The phrase "no other heart defects" is important: it rules out scenarios such as pulmonary hypertension or transposition, which could reverse shunt direction.
- Use precise terminology: a left-to-right shunt through a VSD is not the same as flow through a patent foramen ovale or an atrial septal defect, which involve different pressure relationships.
The diagram shows a transverse section through a human bronchus.
Which labelled tissue is the cartilage?
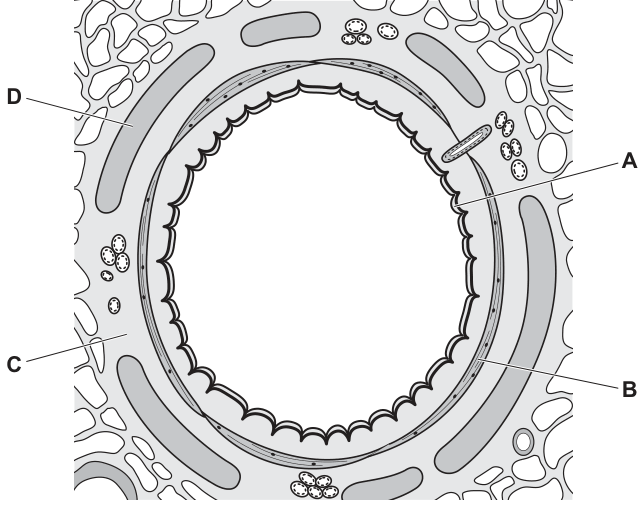
Options
A A
B B
C C
D D
Working
The wall of a bronchus is arranged in layers, from the lumen outwards:
- Ciliated epithelium (innermost lining) — label A.
- Smooth muscle — label B.
- Irregular plates of cartilage — label D.
- Outer connective tissue (adventitia) — label C.
Cartilage appears as solid, C-shaped or plate-like structures embedded in the wall of the bronchus, which is what D is pointing to.
Answer
D
D
Background Concept
The human gas exchange system branches from the trachea into two primary bronchi, which then divide repeatedly into smaller bronchi and bronchioles inside the lungs. The walls of the bronchi contain several tissue layers, each with a specific function:
- Ciliated epithelium lines the lumen. The cilia beat in a coordinated wave to move mucus (trapping dust and pathogens) upwards towards the throat. Goblet cells within this epithelium secrete the mucus.
- Smooth muscle lies just outside the epithelium. It can contract or relax to alter the diameter of the airway (bronchoconstriction / bronchodilation), regulating airflow.
- Cartilage is present as irregular, C-shaped (in the trachea and main bronchi) or plate-like (in smaller bronchi) pieces in the wall. It is a firm, supportive tissue containing chondrocytes in a matrix; its job is to hold the airway open and prevent it from collapsing during breathing when the pressure inside changes.
- Connective tissue (adventitia) forms the outermost layer and binds the bronchus to surrounding structures. It contains blood vessels, nerves and lymphatics.
Understanding the Question
The question presents a transverse section through a human bronchus with four labels (A, B, C, D) pointing to different structures. You are asked to identify which label points to the cartilage. The mark scheme confirms that the answer is D.
Approach
The strategy is to recall the order of the tissue layers in the wall of a bronchus, then match each label to the structure it points to. Cartilage is recognisable in such diagrams as a solid, C-shaped or plate-like structure embedded in the wall, lying between the smooth muscle and the outer connective tissue.
Step-by-Step Reasoning
- Start at the centre of the diagram — the open space is the lumen of the bronchus.
- The thin wavy layer immediately around the lumen (label A) is the ciliated epithelium, with its characteristic folded/wavy appearance representing cilia and mucus.
- Just outside the epithelium (label B) is a thin layer of smooth muscle.
- Embedded further out in the wall is a solid, plate-like structure (label D). This irregular, dense-looking plate is characteristic of cartilage — note its position in the wall, not at the very surface.
- The outermost layer (label C) is the connective tissue (adventitia) that anchors the bronchus to surrounding lung tissue.
Because cartilage is the solid plate-like structure in the wall (not the inner lining, not the thin muscle band, and not the outer loose tissue), label D is correct.
Key Takeaways
- The wall of a bronchus has four main layers, from inside to outside: ciliated epithelium → smooth muscle → cartilage → connective tissue.
- In a transverse section, cartilage is identified by its solid, often C-shaped or irregular plate-like appearance, sitting between the muscle and the outer connective tissue.
- Cartilage's role is structural — to keep the airway open during breathing.
Common Mistakes
- Confusing cartilage (D) with the outer connective tissue (C). The cartilage is a discrete, solid plate within the wall, whereas the connective tissue is the loose outermost layer.
- Confusing cartilage with smooth muscle (B). The muscle is a thin continuous band, not a plate.
- Picking A — the ciliated epithelium is the innermost lining, not cartilage.
Things to Be Careful About
- In a bronchus, cartilage appears as plates (not a complete C-ring as in the trachea). Recognising the plate-like profile is key.
- The cartilage sits between the smooth muscle and the outer connective tissue — use position in the wall as well as shape to identify it.
- Make sure you are reading the label that points to the solid, dense plate rather than the looser tissue outside it.
What helps to maintain a concentration gradient between blood and the air in the alveolus?
Options
A the flow of blood through the lungs
B the presence of haemoglobin in blood cells
C the single-celled alveolar walls
D the squamous epithelium of capillaries
Working
A concentration gradient drives net diffusion of gases between alveolar air and blood. For diffusion to continue rapidly, the gradient must be kept steep — i.e. the air side must keep being supplied with fresh, O₂-rich air, and the blood side must keep delivering O₂-poor (CO₂-rich) blood and carrying oxygenated blood away.
- A — Flow of blood through the lungs continuously brings deoxygenated blood to the alveoli and removes oxygenated blood, sustaining the O₂ and CO₂ gradients. ✓
- B — Haemoglobin increases the O₂-carrying capacity of blood but does not by itself maintain the gradient.
- C — A thin (single-celled) wall shortens the diffusion distance, but does not maintain a concentration difference.
- D — Squamous epithelium of capillaries also shortens the diffusion distance, not the gradient.
Answer
A
A
Background Concept
Gas exchange between the alveoli and the blood in the surrounding pulmonary capillaries follows Fick's law of diffusion:
To maximise the rate, alveoli have evolved features that increase surface area (millions of alveoli, each densely wrapped by capillaries), shorten the diffusion distance (the alveolar wall and capillary wall together are only about 1 µm thick), and — crucially — maintain a steep concentration gradient for both O₂ and CO₂.
A gradient only stays steep if something continuously removes the substance that has just diffused across and continuously replenishes the source. In the lungs, this is done by two processes working in tandem:
- Ventilation brings fresh atmospheric air (high pO₂, low pCO₂) into the alveoli and removes exhaled air.
- Blood flow (perfusion) through the pulmonary capillaries continuously delivers O₂-poor, CO₂-rich blood from the pulmonary artery and carries O₂-rich blood away via the pulmonary vein.
Without this continuous through-flow, the blood leaving the lungs would quickly equilibrate with alveolar air and the gradient — and hence net diffusion — would collapse.
Understanding the Question
The question asks what maintains a concentration gradient between alveolar air and blood. "Maintains" is the key word: it asks not what makes diffusion fast in general, but what keeps the concentration difference from disappearing as gases are exchanged. The command word is effectively "identify" — pick the option whose role is to keep the gradient steep.
Approach
For each option, ask: does this feature act to keep the two concentrations different (i.e. remove diffused gas and supply fresh source), or does it act on a different part of Fick's law (surface area, diffusion distance, or carrying capacity)? Only one option addresses the gradient term directly.
Step-by-Step Reasoning
- A — flow of blood through the lungs: Blood flow constantly replaces blood that has already equilibrated with alveolar air with fresh, deoxygenated blood returning from the body. This continually re-establishes a high CO₂ and low O₂ concentration on the blood side relative to alveolar air, sustaining the gradient. ✓
- B — presence of haemoglobin: Haemoglobin binds O₂, increasing the amount of O₂ blood can carry. This affects the quantity of gas exchanged, not the concentration difference that drives diffusion. It is, however, important for loading O₂ efficiently once diffusion has occurred.
- C — single-celled alveolar walls: A thin wall minimises the diffusion distance, the denominator in Fick's law. It is an adaptation for fast diffusion, not for keeping the gradient steep.
- D — squamous epithelium of capillaries: Also part of the thin barrier that minimises diffusion distance. Same reasoning as C — it speeds diffusion but does not maintain a concentration difference.
Only option A describes a feature that actively maintains the concentration gradient between alveolar air and blood.
Key Takeaways
- A concentration gradient must be continuously regenerated, or diffusion will slow to a halt as the two sides equilibrate.
- In the alveoli, two things regenerate the gradient: ventilation (air flow) on the alveolar side and perfusion (blood flow) on the blood side.
- Fick's law separates these roles clearly: surface area, diffusion distance and gradient are three independent adaptations — don't confuse them.
Common Mistakes
- Choosing C or D because "thin walls" sounds like the most distinctive feature of alveoli. These options affect diffusion distance, not the concentration gradient the question asks about.
- Choosing B because haemoglobin is essential to gas exchange. Haemoglobin is essential to O₂ transport in the blood, not to maintaining the concentration difference at the alveolar surface.
- Forgetting that ventilation (air movement) is the partner process; the question only lists blood flow, so the blood-side answer is the one that scores.
Things to Be Careful About
- Read the command word carefully: "maintain" a gradient ≠ "increase the rate of" diffusion.
- Fick's law terms to keep straight: area (many alveoli, capillary network), distance (thin squamous epithelium and single-celled alveolar wall), gradient (ventilation and blood flow).
- Both ventilation and blood flow are required in real physiology; the question only lists one of them, and A is the correct one among the four options given.
Which row correctly identifies the pathogens causing malaria and TB?
Options
| malaria | TB | |
|---|---|---|
| A | protoctist | virus |
| B | protoctist | bacterium |
| C | prokaryote | bacterium |
| D | prokaryote | virus |
Working
Malaria is caused by Plasmodium, a eukaryotic single-celled organism classified as a protoctist. TB is caused by Mycobacterium tuberculosis, a prokaryotic organism classified as a bacterium. Only row B pairs protoctist with bacterium.
Answer
B
B
Background Concept
Pathogens are disease-causing organisms and are classified into several broad groups based on cellular organisation:
- Protoctists are eukaryotic, single-celled organisms (e.g. Plasmodium, the cause of malaria). Eukaryotes have a true nucleus and membrane-bound organelles.
- Bacteria are prokaryotes — single-celled organisms with no true nucleus; their DNA is free in the cytoplasm. They include pathogens such as Mycobacterium tuberculosis (TB) and Vibrio cholerae (cholera).
- Viruses are non-cellular particles, consisting of a nucleic-acid core (DNA or RNA) inside a protein capsid, sometimes with an envelope. They are not living cells and can only replicate inside a host cell (e.g. HIV, the cause of AIDS).
- Prokaryote is a structural category (no nucleus), not a disease-causing group on its own. All bacteria are prokaryotes, so describing TB's pathogen as merely a "prokaryote" is imprecise compared with calling it a bacterium.
Understanding the Question
The table asks for the correct biological classification of two named diseases:
- Malaria — caused by Plasmodium spp. (transmitted by the bite of an infected female Anopheles mosquito).
- TB (tuberculosis) — caused by Mycobacterium tuberculosis (transmitted by airborne droplets from coughs/sneezes).
The command word is "identifies"; the candidate simply has to match each pathogen with the correct group.
Approach
Recall the kingdom/group of each pathogen and look for the row that pairs them correctly. Plasmodium → protoctist; Mycobacterium → bacterium. Then check which option gives this combination.
Step-by-Step Reasoning
- Plasmodium (malaria) is eukaryotic and unicellular → protoctist.
- Mycobacterium tuberculosis (TB) is a single-celled prokaryote with a peptidoglycan cell wall → bacterium.
- The combination protoctist + bacterium appears only in row B.
- Distractor analysis:
- A incorrectly calls TB's pathogen a virus (viruses cause AIDS, influenza, etc.).
- C calls malaria a prokaryote (incorrect — Plasmodium has a nucleus).
- D mis-classifies both: malaria is not a prokaryote, and TB is not a virus.
Key Takeaways
- Malaria = Plasmodium = protoctist.
- TB = Mycobacterium tuberculosis = bacterium.
- Distinguish "prokaryote" (a cellular description) from "bacterium" (the specific name of that group of pathogens).
Common Mistakes
- Writing "prokaryote" for TB's pathogen instead of "bacterium" — this loses the mark because "prokaryote" is a structural term, not the name of the pathogen's group.
- Confusing protoctists with bacteria because both are microscopic; remember protoctists are eukaryotic (have a nucleus), bacteria are not.
Things to Be Careful About
- Use the precise term the mark scheme requires: "protoctist" for Plasmodium and "bacterium" for Mycobacterium.
- A virus is never a "cell" — questions that try to slot a virus into a bacterial or protoctist cell category are testing this distinction.
What could be used to help prevent an outbreak of cholera in a town?
Options
A treatment of sewage waste
B spraying still water with insecticides to kill mosquito larvae
C increased use of antiviral medicine
D preventing the reuse of hypodermic needles
Working
Cholera is caused by the bacterium Vibrio cholerae, which is transmitted via the faecal–oral route through contaminated drinking water. Prevention therefore focuses on breaking this transmission chain by improving sanitation and water quality.
- A Treatment of sewage waste destroys V. cholerae before it can contaminate water supplies. ✓
- B Spraying insecticide targets mosquito vectors of malaria, not cholera. ✗
- C Antiviral medicines are ineffective against bacteria, and V. cholerae is a bacterium. ✗
- D Hypodermic needle hygiene prevents blood-borne pathogens such as HIV, not water-borne cholera. ✗
Answer
A
A
Background Concept
Cholera is an acute diarrhoeal disease caused by the bacterium Vibrio cholerae. The pathogen colonises the small intestine and secretes a toxin (cholera toxin, CT) that triggers the secretion of large volumes of water and electrolytes into the gut lumen, producing the characteristic profuse "rice-water" diarrhoea. The disease is transmitted by the faecal–oral route, almost always through drinking water contaminated with faeces from an infected person. It is therefore classified as a water-borne disease, and outbreaks occur where clean water supplies and sanitation are inadequate (e.g. after natural disasters or in areas of poverty).
Because the transmission chain is faeces → water → mouth, prevention targets two main points: (1) stopping the pathogen entering water in the first place, and (2) preventing people from drinking contaminated water. Sewage treatment, provision of clean piped water, hand-washing, and safe food preparation all interrupt this chain. Vaccines exist but are mainly used reactively rather than as the primary control measure in endemic areas.
Understanding the Question
The question asks which measure would help prevent an outbreak of cholera in a town. The command word is "could be used to help prevent", so we need an intervention that reduces the risk of the disease establishing or spreading in the population. We must consider what V. cholerae is (a bacterium), how it spreads (via contaminated water), and match this biology to the correct control strategy from the four options.
Approach
Step 1: Identify the pathogen type and route of transmission.
Step 2: Match each option to the disease it actually controls.
Step 3: Select the option that breaks the cholera transmission chain.
Step-by-Step Reasoning
Option A — Treatment of sewage waste. Untreated sewage carries V. cholerae shed in the faeces of infected individuals. If this sewage enters drinking-water sources, the bacterium reaches new hosts via the water supply. Properly treating sewage (primary settlement, biological filtration, chlorination) destroys V. cholerae and other pathogens before the effluent is released, so the water supply to the town remains uncontaminated. This directly interrupts the faecal–oral transmission route and is therefore a valid cholera-prevention measure. ✓
Option B — Spraying still water with insecticide to kill mosquito larvae. This is a control measure for malaria, which is transmitted by female Anopheles mosquitoes breeding in still water. Cholera is not carried by mosquitoes, so killing mosquito larvae has no effect on V. cholerae. ✗
Option C — Increased use of antiviral medicine. Vibrio cholerae is a bacterium, not a virus, so antiviral drugs (which target viral replication machinery) are useless against it. The relevant antimicrobial class is antibiotics (e.g. tetracycline, doxycycline), used mainly to shorten illness and bacterial shedding rather than as a population-level prevention. The wrong drug class is named, so this option is incorrect. ✗
Option D — Preventing the reuse of hypodermic needles. This is a control measure for blood-borne pathogens such as HIV and hepatitis B/C. Cholera is not transmitted in blood; it is transmitted by ingesting the bacterium. Sterile needle practice does nothing to interrupt the water-borne faecal–oral route. ✗
Only option A breaks the transmission route relevant to cholera.
Key Takeaways
- Cholera is caused by the bacterium Vibrio cholerae and is spread by the faecal–oral route, almost always via contaminated water.
- Prevention centres on clean water and good sanitation — sewage treatment, safe drinking-water supplies, and hygiene.
- Antiviral drugs target viruses, not bacteria; antibiotics target bacteria. Always match the antimicrobial to the pathogen type.
- Each named disease in the syllabus has a characteristic transmission route: cholera (water/food), malaria (mosquito vector), TB (airborne droplets), HIV (body fluids/blood). The control measure must match the route.
Common Mistakes
- Confusing cholera with malaria. Both are covered in the same syllabus section, and both involve water in some way, but their transmission routes are completely different (water-borne ingestion vs mosquito bite). Choosing B is a common error.
- Thinking "antiviral" means "against any infection". Antivirals are specific to viruses. Cholera needs antibiotics (and rehydration), not antivirals.
- Confusing cholera with HIV. Both are named together in the syllabus, but only HIV is blood-borne; needle hygiene is irrelevant to cholera.
- Choosing a treatment rather than a prevention measure. Even if rehydration therapy is the mainstay of cholera treatment, the question asks about preventing an outbreak, which is achieved by sanitation and clean water.
Things to Be Careful About
- Read the question wording carefully: "prevent an outbreak" points to public-health and sanitation measures, not individual drug therapy.
- Be precise about the pathogen type: bacterial → antibiotics; viral → antivirals. Misnaming this costs the mark instantly.
- Each syllabus pathogen has its own classic control measure; if a measure sounds like it belongs to a different disease, it is almost certainly the wrong option.
The graph shows the percentage of tuberculosis (TB) patients who were also known to be infected with HIV, from 2004 to 2011.
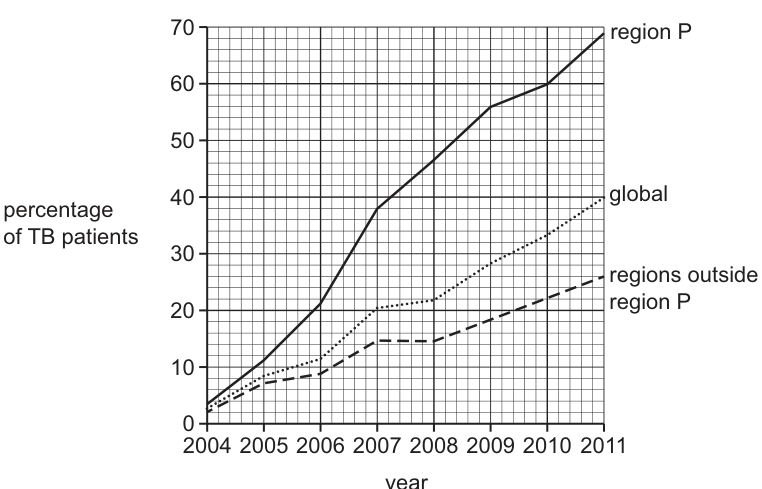
Which statement about the graph is correct?
Options
A From 2004 to 2010, the percentage of TB patients with HIV infection in region P increased from 3% to 69%.
B From 2005 to 2011, the percentage of TB patients with HIV infection increased more rapidly in region P than in regions outside region P.
C From 2006 to 2011, the percentage of TB patients with HIV infection in regions outside region P doubled.
D From 2007 to 2011, the percentage of TB patients with HIV infection globally increased from 20% to 30%.
Working
Read the values of each line at the relevant year(s) and check the claim.
- A — Region P in 2004 ≈ 3% and in 2010 ≈ 60%, not 69%. The value 69% belongs to 2011, not 2010. Incorrect.
- B — From 2005 to 2011, region P rises from ≈ 12% to ≈ 68% (a gain of ~56 percentage points), while regions outside region P rises from ≈ 8% to ≈ 26% (a gain of ~18 percentage points). Region P's gradient is much steeper. Correct.
- C — In 2006, regions outside region P ≈ 12%; doubling gives 24%, but the 2011 value is ≈ 26% (slightly more than double, not exactly double). Incorrect.
- D — Globally, 2007 ≈ 20% and 2011 ≈ 40%, not 30%. Incorrect.
Answer
B
B
Background Concept
Tuberculosis (TB) and HIV are two of the world's most important infectious diseases, and they interact strongly — HIV weakens the immune system, which makes people far more susceptible to developing active TB. Public-health data are therefore often reported as the percentage of TB patients who are also HIV-positive, broken down by region. A line graph with year on the x-axis and percentage on the y-axis is the standard way to display such a time series, and several groups (e.g. one region, the rest of the world, and a global total) can be plotted together for comparison.
When comparing several lines on the same axes, two things matter:
- The value at a specific year — read vertically up to the line and horizontally across to the y-axis.
- The rate of change — the steeper the line, the more rapidly the percentage is rising (or falling) over time. This is the gradient.
Understanding the Question
The figure shows three lines from 2004 to 2011:
- Region P (solid line) — steepest rise, ending highest at about 68% in 2011.
- Global (dotted line) — intermediate rise, ending at about 40% in 2011.
- Regions outside region P (dashed line) — shallowest rise, ending at about 26% in 2011.
Each option makes a specific numerical claim about one of the lines over a stated time period. The job is to read the graph precisely and decide which claim is supported by the data.
Approach
For each option, identify (i) which line is being discussed, (ii) which years define the period, and (iii) the value at each of those years. Then check whether the stated value or relationship is consistent with the graph. Pay particular attention to which year a stated value belongs to — it is easy to misread the endpoint.
Step-by-Step Reasoning
Option A — "From 2004 to 2010, region P increased from 3% to 69%."
- In 2004, region P is at roughly 3% — this part is correct.
- In 2010, region P is at about 60%, not 69%. The 69% figure is the 2011 value.
- The endpoint year is wrong, so A is incorrect.
Option B — "From 2005 to 2011, region P increased more rapidly than regions outside region P."
- Region P: 2005 ≈ 12%, 2011 ≈ 68% → rise of ~56 percentage points.
- Regions outside P: 2005 ≈ 8%, 2011 ≈ 26% → rise of ~18 percentage points.
- Region P's line is visibly much steeper than the dashed line for regions outside P across this period.
- The claim is supported. B is correct.
Option C — "From 2006 to 2011, regions outside region P doubled."
- In 2006, regions outside P ≈ 12%. Doubling would give 24%.
- In 2011, the dashed line is at about 26% — slightly more than double, not exactly double.
- The graph does not show an exact doubling, so C is not the best answer.
Option D — "From 2007 to 2011, the global percentage increased from 20% to 30%."
- In 2007, global ≈ 20% — this part is correct.
- In 2011, global ≈ 40%, not 30%. The 30% figure corresponds to roughly 2009–2010.
- The endpoint value is wrong, so D is incorrect.
Key Takeaways
- Always read both the year on the x-axis and the corresponding value on the y-axis when checking a numerical claim about a graph.
- "Increased more rapidly" is a gradient / slope comparison, not a single-value comparison — you need to look at the steepness of the line over the whole interval.
- "Doubled" means exactly a factor of two; if the value is slightly above or below double, the statement is not strictly correct.
- When several lines are plotted on the same axes, identify the right line (by label/style) before reading any value.
Common Mistakes
- Wrong year for the endpoint — picking the value at 2011 when the question specifies 2010 (as in option A) or 2009 when it specifies 2007 (as in option D). Always trace vertically from the named year on the x-axis, not from the right-hand end of the graph.
- Confusing the three lines — region P (solid, steepest) and regions outside P (dashed, shallowest) move in opposite visual positions on the page and are easy to swap. Read the label at the right-hand end of each line before judging the trend.
- Treating "more than doubled" as the same as "doubled" — option C is a near-miss rather than an exact statement, and the mark scheme will not accept it.
Things to Be Careful About
- This is an MCQ, so only one option is correct. If two options seem right, re-check the values more carefully — the error is almost always at one endpoint.
- When reading a line graph, use the gridlines. Each major gridline here represents 10%, and minor gridlines 1%, so a value like 26% vs 24% is distinguishable if you read carefully.
- "Increased more rapidly" requires comparison across the same time interval for both lines; the start and end years must match (here, both 2005–2011).
Four different treatments were tested in a human volunteer during a year. One of these treatments was a vaccine.
The treatments were injected into the volunteer and blood samples were taken after two weeks. The samples were analysed to obtain a cell count for four types of cell.
The results are shown in the table.
Which treatment was the vaccine?
(Assume the volunteer's baseline blood cell count was the same before each treatment.)
| cell count / cells per | ||||
|---|---|---|---|---|
| monocytes | neutrophils | plasma cells | macrophages | |
| A | 250 | 180 | 450 | 230 |
| B | 500 | 190 | 220 | 240 |
| C | 260 | 450 | 240 | 250 |
| D | 250 | 190 | 230 | 550 |
Options
A A
B B
C C
D D
Working
A vaccine introduces antigens that trigger the specific (adaptive) immune response. The key outcome of vaccination is the activation of B-lymphocytes, which differentiate into plasma cells that secrete antibodies. Therefore, a vaccinated individual will show a marked increase in plasma cells two weeks after injection, while non-specific cell types (monocytes, neutrophils, macrophages) remain near baseline.
Examining the table:
- A – plasma cells = 450 (all other cells near baseline) ✓ vaccine signature
- B – monocytes = 500 (raised; non-specific phagocyte)
- C – neutrophils = 450 (raised; non-specific phagocyte)
- D – macrophages = 550 (raised; non-specific phagocyte)
Only treatment A shows the elevated plasma cell count characteristic of an antibody-mediated specific immune response.
Answer
A
A
Background Concept
The human immune system has two broad arms: non-specific (innate) and specific (adaptive) immunity.
- Non-specific immunity is the first line of defence and is carried out by phagocytic cells such as neutrophils, monocytes (which circulate in the blood and migrate into tissues to become macrophages), and by physical/chemical barriers. These cells engulf and digest pathogens regardless of the pathogen's identity, so their numbers rise during any general infection, inflammation, or tissue damage.
- Specific immunity targets particular antigens. When a B-lymphocyte meets its specific antigen (often presented by a macrophage), it is activated, proliferates and differentiates into:
- Plasma cells – short-lived antibody factories that secrete large quantities of antibody.
- Memory cells – long-lived cells that allow a rapid secondary response on re-exposure.
A vaccine contains antigens (attenuated/killed pathogen, subunit, or toxoid) that stimulate the specific immune response without causing disease. After about two weeks, the hallmark of successful vaccination in a blood sample is a rise in plasma cells (and, later, memory cells), not a rise in non-specific phagocytes.
Understanding the Question
The question gives cell counts (per cm³) for four white blood cell types — monocytes, neutrophils, plasma cells and macrophages — measured two weeks after each of four injections. The baseline count is the same for each treatment, so the treatment that produces a clear, large rise in one particular cell type is the one whose mechanism of action preferentially expands that cell.
The question therefore tests whether the candidate can link the cellular mechanism of a vaccine to the cell type that is expected to increase.
Approach
- Recall which cell type proliferates specifically in response to vaccination.
- Scan each row of the table to see which cell type is conspicuously elevated above the ~200–250 baseline.
- Match the elevated cell to the corresponding immune response.
Step-by-Step Reasoning
- Vaccine → specific immune response → plasma cells rise (they make antibodies). Look for a row with a large plasma cell count.
- Pathogen / infection / inflammation → non-specific response → neutrophils, monocytes or macrophages rise.
- Allergy → would involve eosinophils (not in this table).
Reading each option:
- A: monocytes 250, neutrophils 180, plasma cells 450, macrophages 230. Plasma cells are the only cell clearly raised above baseline. This pattern is the signature of a specific, antibody-mediated response — a vaccine.
- B: monocytes 500, neutrophils 190, plasma cells 220, macrophages 240. Monocytes are raised, indicating a non-specific innate response, not vaccination.
- C: monocytes 260, neutrophils 450, plasma cells 240, macrophages 250. Neutrophils are raised, typical of an acute bacterial infection or inflammation.
- D: monocytes 250, neutrophils 190, plasma cells 230, macrophages 550. Macrophages are raised, again a non-specific response.
Only treatment A elevates the cell type whose proliferation is the hallmark of vaccination: the plasma cell.
Key Takeaways
- A vaccine stimulates the specific immune response, leading to proliferation of B-lymphocytes → plasma cells (antibody secretors) and memory cells.
- Non-specific phagocytes (neutrophils, monocytes, macrophages) rise during general infection or inflammation, not specifically after vaccination.
- When interpreting a cell-count table, look for the cell type whose increase matches the expected mechanism of the treatment.
Common Mistakes
- Choosing D because macrophages "present antigen" — although macrophages do help activate the specific response, the count that rises in a vaccinated individual is plasma cells, not macrophages.
- Choosing C because neutrophils are the most numerous white cell in blood; a high neutrophil count in this table indicates an acute non-specific response, not a vaccine.
- Confusing plasma cells (antibody-secreting, derived from B-lymphocytes) with blood plasma (the liquid component of blood).
Things to Be Careful About
- Two weeks is the timescale given — primary response activation of B-cells and differentiation into plasma cells fits this window.
- "Baseline the same before each treatment" means any large deviation from ~200–250 cells cm⁻³ is meaningful; do not be distracted by small fluctuations.
- Read the column headings carefully: plasma cells is a separate column from monocytes and macrophages, even though macrophages and monocytes are related.
A bacterial pathogen produces a protein that acts as a toxin. This toxin is harmful to humans. People can be vaccinated to protect them from the effects of this pathogen.
Which statement describes the sequences of events that occur in a vaccinated person to protect them from the effects of this pathogen?
Options
A Memory cells divide by mitosis and then differentiate into macrophages that engulf and digest the toxin.
B Memory cells divide by mitosis and then differentiate into plasma cells that produce antibodies to bind to the toxin.
C Macrophages divide by mitosis and then differentiate into memory cells that engulf and digest the toxin.
D Plasma cells divide by mitosis and then differentiate into memory cells that produce antibodies to bind to the toxin.
Working
In a vaccinated person, the primary response has already produced memory cells specific to the toxin's antigen. On re-exposure, these memory cells are re-stimulated and divide rapidly by mitosis; some of the daughter cells differentiate into plasma cells (and some remain as further memory cells). The plasma cells then secrete antibodies that bind to the toxin, neutralising it before it can damage the host.
- A is wrong: memory cells differentiate into plasma cells, not macrophages; macrophages are derived from monocytes, not from lymphocyte memory cells.
- C is wrong: macrophages do not divide by mitosis to give memory cells, and macrophages engulf pathogens rather than memory cells.
- D is wrong: plasma cells are already terminally differentiated antibody factories; they do not divide, and they do not give rise to memory cells — the direction is the other way round.
Answer
B
B
Background Concept
Vaccination is a form of artificial active immunity. A vaccine contains a harmless form of a pathogen (e.g. an inactivated toxin / toxoid, a killed or attenuated bacterium, or a subunit protein). Because it still carries the pathogen's antigens, it provokes the same kind of immune response as the real infection but without the disease.
The response happens in two phases:
-
Primary response (first exposure — e.g. the vaccine dose): an antigen-presenting cell such as a macrophage takes up the antigen and presents it on its surface. A helper T-cell (T(_H)) activates matching B-cells in the lymph nodes. These B-cells proliferate (clonal selection and clonal expansion) and differentiate into:
- Plasma cells — short-lived cells that mass-produce antibodies specific to the antigen; and
- Memory cells — long-lived B-cells (and T-memory cells) that remain in the body for years, sometimes for life.
-
Secondary response (subsequent exposure to the same antigen, e.g. the real pathogen later in life): the memory cells are re-stimulated, divide rapidly by mitosis, and differentiate into further plasma cells (and more memory cells). Plasma cells pour out antibodies much faster, in much greater quantity, and with higher affinity than in the primary response. As a result, the pathogen is neutralised before it can establish a serious infection — this is what gives the vaccinated person protection.
Crucial biology of each cell type:
- Memory cell: a long-lived lymphocyte produced during the primary response; on re-exposure it divides by mitosis.
- Plasma cell: a short-lived, terminally differentiated B-cell; its sole job is to secrete antibodies; it does not divide.
- Macrophage: a phagocytic cell derived from monocytes in the bone marrow; it engulfs and digests pathogens, and acts as an antigen-presenting cell. Macrophages do not arise from memory cells, and memory cells do not differentiate into macrophages.
Understanding the Question
The stem tells us a bacterial pathogen produces a protein toxin harmful to humans, and that people are vaccinated. We are asked which option correctly describes the sequence of events in a vaccinated (i.e. already primed) person on encountering the toxin — in other words, the secondary response to a toxin that the body has been vaccinated against. The command word describes means we need the option that correctly states which cell divides, what it differentiates into, and what the resulting cell does to the toxin.
Approach
For each option, check three things in order:
- Does the named starting cell correctly divide by mitosis on re-exposure?
- Does it correctly differentiate into the named second cell type?
- Does that second cell type do the stated job to the toxin?
Only one option is biologically correct end-to-end.
Step-by-Step Reasoning
Option A — "Memory cells divide by mitosis and then differentiate into macrophages that engulf and digest the toxin."
- Step 1 is correct: memory cells do divide by mitosis on re-exposure.
- Step 2 is wrong: the daughter cells differentiate into plasma cells (and more memory cells), not macrophages. Macrophages come from bone-marrow monocytes; they are part of the innate, not adaptive, response.
- This option is incorrect.
Option B — "Memory cells divide by mitosis and then differentiate into plasma cells that produce antibodies to bind to the toxin."
- Step 1 is correct: on encountering the antigen, memory B-cells are re-stimulated and divide by mitosis.
- Step 2 is correct: the daughter cells differentiate into plasma cells.
- Step 3 is correct: plasma cells secrete antibodies that bind to the toxin, neutralising it.
- This option is the textbook description of the secondary humoral response and is correct.
Option C — "Macrophages divide by mitosis and then differentiate into memory cells that engulf and digest the toxin."
- Step 1 is wrong: macrophages are differentiated phagocytes and do not normally divide to give memory cells. Memory cells arise from activated B-lymphocytes.
- Step 3 is also wrong: memory cells do not engulf anything; they recognise antigens via surface receptors and respond by dividing, not by phagocytosis.
- This option is incorrect.
Option D — "Plasma cells divide by mitosis and then differentiate into memory cells that produce antibodies to bind to the toxin."
- Step 1 is wrong: plasma cells are terminally differentiated and do not divide.
- The direction of differentiation is also reversed: memory cells are produced first, and they later give rise to plasma cells, not the other way around.
- This option is incorrect.
Only option B is consistent with what happens during the secondary immune response in a vaccinated person.
Key Takeaways
- Vaccination produces memory cells (long-lived B- and T-lymphocytes) without causing disease.
- On re-exposure, memory cells divide by mitosis and differentiate into plasma cells (and more memory cells).
- Plasma cells secrete antibodies that bind the toxin/pathogen, neutralising it — this is the faster, stronger secondary response.
- Plasma cells do not divide; macrophages do not arise from memory cells; and memory cells do not engulf pathogens — these are the trap misconceptions the options exploit.
Common Mistakes
- Saying memory cells "differentiate into macrophages" — confusing the lymphocyte lineage with the monocyte/macrophage lineage (innate vs adaptive immunity).
- Saying plasma cells divide — plasma cells are short-lived, terminally differentiated antibody factories; the dividing cell is the memory cell / activated B-cell.
- Saying macrophages engulf the toxin on the specific (re-exposure) response — macrophages contribute in the innate and antigen-presenting role, but the specific, fast-acting protection that vaccination confers comes from antibody secretion by plasma cells.
- Reversing the direction of the lineage: it is memory cell → plasma cell, never the other way round.
Things to Be Careful About
- The toxin is itself the antigen here — antibodies against the toxoid component of the vaccine will neutralise the toxin directly. There is no need to involve phagocytosis of the toxin for the answer to be correct.
- "Bind to" is the precise wording the mark scheme accepts for antibody action; "destroy" or "kill" the toxin is too vague (toxins are non-living molecules, not cells) and would not score.
- "Differentiate into" implies a one-way lineage change; do not read it as "stimulate" or "activate".
Your score so far
Answer a question to start scoring
Your marks add up here as you work through the paper.