Biology 9700/37 — May/June 2025
Cambridge AS Level · Advanced Practical Skills · worked solutions for every part, with the mark scheme
Topics Analysis, Conclusions and Evaluation · Manipulation, Measurement and Observation · Presentation of Data and Observations · Use of the Light Microscope
When plant tissue is placed into a solution of sodium chloride, water moves between the sodium chloride solution and the cells in the plant tissue.
You will investigate the effect of surface area of plant tissue on the movement of water between a sodium chloride solution and the cells in a sample of plant tissue.
You are provided with the materials shown in Table 1.1.
Table 1.1
| labelled | contents | hazard | volume / |
|---|---|---|---|
| P | 5 cylinders of plant tissue in distilled water | none | — |
| S | sodium chloride solution | none | 200 |
It is recommended that you wear suitable eye protection.
You will need to:
- cut cylinders of plant tissue into different lengths
- soak different lengths of plant tissue in sodium chloride solution for 20 minutes
- measure the final length of the plant tissue.
Carry out step 1 to step 12.
step 1 Using the forceps, put the cylinders of plant tissue onto the white tile.
step 2 Cut each cylinder of plant tissue to length.
The cylinders of plant tissue all have the same diameter, as shown in Fig. 1.1. The radius is calculated by dividing the diameter by 2.
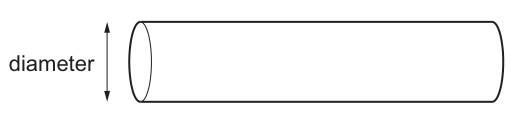
Measure the diameter of one cylinder of plant tissue and calculate the radius, .
diameter = ______
r = ______
Answer
diameter = 6 mm
r = 3 mm
diameter = 6 mm; r = 3 mm
Background Concept
The cross-section of a cylinder is a circle. A circle has two important measurements: the diameter (the distance across the circle passing through its centre) and the radius (the distance from the centre to the edge). They are related by the simple equation . In this experiment the diameter and radius are both needed in millimetres so that the surface area can be calculated in (a)(iii) and the result is consistent with the cylinder length of 40 mm given in step 2.
Understanding the Question
You have cut five cylinders of plant tissue to 40 mm length in step 2. The question asks you to measure the diameter of one of those cylinders and then calculate its radius. The diameter is shown in Fig. 1.1 as the vertical dimension of the circular end of the cylinder. The radius is needed for the surface area calculation that follows in (a)(iii).
Approach
Place a ruler with millimetre markings across the circular face of the cylinder, from one edge through the centre to the other edge. Read the diameter to the nearest mm. Then halve this value to get the radius. Record both numbers with the unit mm.
Step-by-Step Reasoning
- Lay the cylinder on a flat surface with one circular end facing you, or hold the cylinder against a ruler so the circular end is in view.
- Place the ruler so that it passes through the centre of the circle, measuring from one edge to the other.
- Read the diameter to the nearest mm — a representative value is 6 mm.
- Halve the diameter: .
- Write both the diameter and the radius on the answer line, each with the unit mm.
The radius you calculate here is used again in (a)(iii) when you work out the total surface area of the cylinders, so an accurate measurement matters.
Key Takeaways
- The radius is exactly half the diameter.
- mm is the appropriate unit because the cylinder length is in mm and the area will be in mm².
- The radius is a derived value: measure the diameter first, then halve it.
Common Mistakes
- Forgetting to halve the diameter and writing the radius as the same number as the diameter.
- Mixing units — for example writing the diameter in cm but the radius in mm.
- Measuring the length of the cylinder by mistake instead of the diameter across the end.
Things to Be Careful About
- Plant tissue cylinders are not always perfectly uniform; measure the widest part of the circular face.
- The ruler should be aligned across the centre; a chord (a line that does not pass through the centre) gives a value smaller than the true diameter.
- The candidate's actual measured value will be carried through to (a)(iii), so any reading error propagates into the surface area calculation.
To investigate the effect of surface area, you will use one whole cylinder of plant tissue and cut the other cylinders into a different number of pieces.
step 3 Label five beakers with the number of pieces of plant tissue () as shown in Table 1.2.
Table 1.2
| beaker labelled | number of pieces of plant tissue () | length () of each small piece / |
|---|---|---|
| 1 | 1 | 40 |
| 2 | 2 | 20 |
| 4 | 4 | 10 |
| 8 | 8 | 5 |
| 16 | 16 | 2.5 |
step 4 Put one whole cylinder of plant tissue into the beaker labelled 1.
step 5 Cut each of the other four cylinders of plant tissue into the number of pieces shown in Table 1.2 and put them into the appropriately labelled beaker.
In step 6 you will use a syringe to measure the volume of sodium chloride solution, S, you will put into each beaker.
State the volume of S that you will put into each beaker and give a reason for the volume that you have stated.
volume of S = ______
reason ______
Answer
volume of S = 20 cm³
reason: so that all the pieces of plant tissue are completely submerged in the sodium chloride solution
20 cm³; so that all the pieces of plant tissue are completely submerged
Background Concept
In a well-designed experiment only one variable is changed (the independent variable) and everything else is kept the same. The volume of sodium chloride solution added to each beaker is one such standardised variable. It must be large enough that every cylinder — including the longest single piece in beaker 1 (40 mm) and the sixteen 2.5 mm pieces in beaker 16 — is fully bathed in the solution, because the water movement you are studying (osmosis between the cells and the NaCl solution) can only occur where the tissue is in contact with the solution.
Understanding the Question
Step 6 instructs you to put the volume of S you have just chosen into each of the five beakers. The question asks you to state a sensible volume (with a unit) and to give a reason why that volume is appropriate. The same volume must go into all five beakers, so the choice is dictated by the beaker that contains the most pieces (beaker 16, sixteen pieces of 2.5 mm).
Approach
Decide on a single volume of S that is large enough to cover every piece of plant tissue in every beaker after the pieces have been added. A typical value used in this CIE task is 20 cm³. Then state a reason that links the volume to immersion of the tissue, e.g. so that all the pieces of plant tissue are completely submerged.
Step-by-Step Reasoning
- The longest single cylinder in beaker 1 is 40 mm; the 16 pieces in beaker 16 are each 2.5 mm but together they take up a similar total volume of plant tissue.
- The pieces must be fully in contact with the NaCl solution, otherwise only part of the surface would be available for water exchange and the results between beakers would not be comparable.
- A volume around 20 cm³ is sufficient to cover the plant tissue in each beaker without diluting the NaCl significantly or wasting solution.
- State the chosen volume on the answer line, then write the reason that links it to immersion.
Key Takeaways
- The volume of solution is a controlled variable — it must be the same in every beaker.
- The volume must be sufficient to immerse all the tissue.
- A justification helps the examiner see that you understand the experimental design.
Common Mistakes
- Giving a volume that is too small (e.g. 5 cm³) which would not cover the tissue in beaker 16.
- Writing only a vague reason such as 'to be fair' or 'so it works' without linking it to immersion or coverage.
- Forgetting the unit (cm³).
Things to Be Careful About
- The cylinders of tissue will displace some of the solution, so the chosen volume should be enough to cover them after they are added.
- The eye-protection note in the stem is a sensible precaution when handling solutions, even though the NaCl itself is not classed as hazardous.
step 6 Put the volume of S you stated in (a)(ii) into each of the beakers.
step 7 Start timing and wait for 20 minutes.
Use this time to continue with other parts of Question 1.
Fig. 1.2 shows an example of how to calculate the total surface area of plant tissue placed in each beaker.
EXAMPLE: a cylinder with a length of
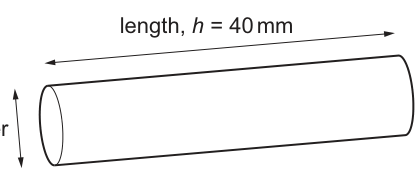
surface area of cylinder =
=
where:
The total surface area depends on the number of pieces, .
Total surface area = surface area of one cylinder number of pieces
=
Complete Table 1.3 by calculating the total surface area of the whole piece of plant tissue (1) and the total surface area for the plant tissue cut into 16 pieces. Use the formulae shown in Fig. 1.2.
Show your working in Table 1.3.
Table 1.3
| / | surface area of one piece / | total surface area / | |
|---|---|---|---|
| 1 | 40 | ||
| 16 | 2.5 |
Working
Using the radius measured in (a)(i) (representative value ) and the formula with :
For , :
For , :
Answer
| / mm | surface area of one piece / mm² | total surface area / mm² | |
|---|---|---|---|
| 1 | 40 | 810.12 | 810.12 |
| 16 | 2.5 | 103.62 | 1657.92 |
(Numerical values depend on the radius measured in (a)(i); here mm is used as a representative example.)
n = 1: 810.12 mm²; n = 16: 1657.92 mm² (with r = 3 mm)
Background Concept
The surface area of a cylinder is the sum of the two circular ends plus the curved lateral surface:
The term is the combined area of the two circular ends (each has area ). The term is the lateral surface — the circumference 'unrolled' along the length . When several identical cylinders are present, the total surface area is the surface area of one cylinder multiplied by the number of pieces . The question fixes for you.
Understanding the Question
The stem in Fig. 1.2 gives the formula and shows how to use it for a cylinder of length 40 mm. You are asked to complete Table 1.3 for the two cases (the whole cylinder, mm) and (sixteen pieces, each mm). For each row you must write both the surface area of one piece and the total surface area, and you must show your working in the table.
Approach
Use the radius you measured in (a)(i) (representative example: mm). Substitute , and into the formula to get the surface area of one piece, then multiply by to get the total surface area. Show each step clearly so the examiner can follow the calculation.
Step-by-Step Reasoning
For , mm:
- .
- .
- .
- .
For , mm:
- (same as before — it does not depend on ).
- .
- .
- .
Notice that the total surface area is much larger for even though each individual piece is shorter: this is the key point the question is setting up for the rest of part (a).
Key Takeaways
- Surface area scales linearly with (the lateral contribution) but the term is fixed for a given radius.
- Total surface area scales with — cutting a cylinder into more pieces increases the total surface area.
- Always quote the unit (mm²) with the answer.
Common Mistakes
- Forgetting to square in the term.
- Forgetting to multiply by for the total surface area.
- Rounding to 3 instead of using 3.14 as the question instructs.
- Mixing up the formula with the volume formula .
Things to Be Careful About
- The numerical answer depends on the radius you measured in (a)(i). If you measured a different diameter, the surface area values will be different — substitute your own measured .
- The total surface area column is the surface area of one piece multiplied by , not the sum of separate areas added together (although the result is the same).
Describe what happens to the total surface area when one whole cylinder of plant tissue is cut into 16 smaller pieces.
Answer
The total surface area increases.
The total surface area increases.
Background Concept
When one cylinder is cut into many smaller cylinders, the total surface area changes because each new cut creates two new circular ends. The more pieces you cut the cylinder into, the more cuts you make and the more new circular surfaces you expose. The total volume of plant tissue stays the same (you are not adding or removing any material), so the surface area to volume ratio also rises.
Understanding the Question
In (a)(iii) you calculated the total surface area of the whole cylinder (, mm) and of the same tissue cut into 16 pieces (, mm). The question asks you to state what has happened to the total surface area when you compare the two cases.
Approach
Compare the total surface area for with the total surface area for from Table 1.3. The total surface area is larger in the case, so it has increased.
Step-by-Step Reasoning
- For : total surface area (using mm as a representative example).
- For : total surface area (using the same ).
- , so the total surface area has increased — roughly doubled — when the cylinder is cut into 16 pieces.
- The reason is the new circular ends exposed at each cut, and the shorter length of each piece giving a smaller lateral contribution but more pieces in total.
Key Takeaways
- Cutting a cylinder into more pieces increases the total surface area (because more cut ends are exposed).
- The total volume of plant tissue does not change.
Common Mistakes
- Stating that the surface area decreases — it does not; the cut ends add new area.
- Confusing total surface area with the surface area of one piece (one piece is smaller in the case, but the total is larger).
Things to Be Careful About
- The 'total surface area' is the surface area of all pieces combined, not the surface area of a single piece.
step 8 After the 20 minutes (step 7), pour the sodium chloride solution from around the cylinder of plant tissue in beaker 1 into the container labelled For waste. Put the plant tissue onto the white tile.
step 9 Measure the length of the cylinder of plant tissue. Record this length in (a)(v).
step 10 Repeat step 8 for beaker 2.
step 11 Place the cylinders of plant tissue end-to-end so that they are touching. Measure their total length, as shown in Fig. 1.3. Record this length in (a)(v).
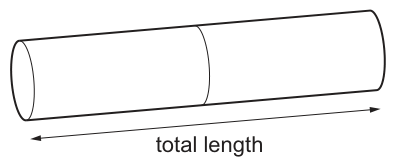
step 12 Repeat step 10 and step 11 using the plant tissue in beaker 4, beaker 8 and beaker 16.
Record your results in an appropriate table.
Answer
| number of pieces of plant tissue () | total length / mm |
|---|---|
| 1 | 39 |
| 2 | 38 |
| 4 | 36 |
| 8 | 33 |
| 16 | 28 |
(Values shown are representative — the candidate's own measurements will vary but should show the same trend: the higher the number of pieces, the shorter the total length of the plant tissue after soaking in NaCl solution.)
See working: results table with number of pieces (n) and total length (mm); total length decreases as n increases.
Background Concept
A results table in a CIE Paper 3 investigation must follow a few conventions to earn the available marks:
- The independent variable (what you deliberately changed — here, the number of pieces of plant tissue ) goes in the leftmost column, with a heading that names it and includes units if necessary.
- The dependent variable (what you measured — here, the total length of the tissue after 20 min in NaCl) goes to the right, with a heading that includes its quantity and unit.
- Every row should contain a measured value (or a mean of repeats).
- The values should be written to a consistent precision (here, whole mm as the mark scheme requires).
- The values should be ordered in a way that makes the trend obvious.
Understanding the Question
After 20 minutes in the NaCl solution, you pour off the solution and measure the length of the plant tissue. For beaker 1 (one whole cylinder) you measure the single cylinder directly. For beakers 2, 4, 8 and 16 you place the pieces end-to-end as shown in Fig. 1.3 and measure their total length. The question asks you to record all five measurements in an appropriate table.
Approach
Draw a two-column table. The left column is the number of pieces (the independent variable). The right column is the total length of the plant tissue in mm (the dependent variable). Fill in the values for . The values should show the expected trend: more pieces (more surface area in contact with the NaCl) → more water loss → shorter total length.
Step-by-Step Reasoning
- The independent variable is the number of pieces ; its heading should be on the left.
- The dependent variable is the total length of the plant tissue after soaking; its heading should be on the right and include the unit (mm or cm).
- Pour off the NaCl solution (into the 'For waste' container) and place the pieces on the white tile. The solution outside the cells is very salty, so any water that has left the cells has gone into this solution.
- Measure the total length using a ruler with mm divisions. For beaker 1 this is just the single cylinder; for the others, line the pieces up end-to-end and measure the combined length.
- Record the length to the nearest whole mm.
- Representative values (with a real NaCl solution and 20 min soaking) might be: mm, mm, mm, mm, mm. The pattern is that total length decreases as increases, because more pieces means more surface area exposed to the hypertonic NaCl and therefore more water loss from the cells.
Key Takeaways
- The IV heading goes to the left of the DV heading.
- Units are written in the heading, not next to every number.
- The trend (more pieces → shorter length) is what the question is testing.
Common Mistakes
- Putting the DV heading on the left (the IV must be on the left).
- Forgetting the unit in the heading.
- Recording values that do not show the expected trend (e.g. random values) — this usually means an error in the practical.
- Recording values with decimals (e.g. 38.5 mm) when whole mm are required.
Things to Be Careful About
- When lining up the pieces end-to-end in step 11, the gaps between pieces and the curved ends of the cylinders introduce small errors — this is what (a)(viii) tests.
- The length of the pieces is what changes, not the diameter (NaCl does not affect the diameter much in 20 min, because the cells are constrained laterally by their cell walls).
Answer
As the total surface area of the plant tissue increases, the total length of the plant tissue decreases.
As the total surface area increases, the total length of the plant tissue decreases.
Background Concept
A 'trend' in a results table is a one-sentence summary of how the dependent variable changes as the independent variable changes. The mark scheme for this question requires you to refer to the total surface area, not just the number of pieces, because that is the actual physical quantity that changes when you cut the cylinder.
Understanding the Question
You have just recorded your results in (a)(v). The question now asks you to describe the trend in those results, specifically with reference to the total surface area. The expected pattern is that total length goes down as total surface area goes up.
Approach
Read your own results table and write a single descriptive sentence that links the change in total surface area to the change in total length. Use the 'as ... increases, ... decreases' structure.
Step-by-Step Reasoning
- From Table 1.3 and your results table, the total surface area goes from about 810 mm² () to about 1658 mm² ().
- The corresponding total lengths go from about 39 mm down to about 28 mm.
- Therefore the trend is: as total surface area increases, total length decreases.
- A suitable one-sentence answer: 'As the total surface area of the plant tissue increases, the total length of the plant tissue decreases.'
Key Takeaways
- A trend statement should mention both variables and the direction of change.
- The mark scheme requires the reference to 'total surface area' (not just 'number of pieces').
Common Mistakes
- Writing 'as n increases, length decreases' — this is not quite the wording the question asks for; the question wants 'surface area'.
- Stating a quantitative relationship (e.g. 'length halves') when the question only asks for a description.
- Describing an incorrect trend (e.g. length increases with surface area) — this would suggest a practical error.
Things to Be Careful About
- The trend should match your own results. If your results are anomalous, the mark scheme still credits a 'correct description according to the candidates' results' — so describe what you actually see.
Answer
Any two from:
- Cutting the plant tissue into more pieces increases the (total) surface area in contact with the sodium chloride solution.
- This also increases the surface area to volume ratio.
- There is a shorter (diffusion) distance to the cells in the middle of the plant tissue cylinder, so water reaches or leaves them more quickly.
Increased surface area in contact with NaCl solution / increased SA:V ratio / shorter diffusion distance to the cells in the middle of the cylinder (any two).
Background Concept
Osmosis is the net movement of water molecules across a partially permeable membrane from a region of higher water potential to a region of lower water potential. In this experiment the plant cells have a higher water potential than the surrounding NaCl solution (which has a very negative water potential), so water leaves the cells by osmosis. The cells lose turgor and the tissue shrinks (becomes shorter and slightly less firm).
The rate at which water can leave the tissue depends on:
- The surface area of tissue exposed to the solution — more surface, more sites for water to leave simultaneously.
- The surface area to volume ratio — the same volume of tissue with more surface exchanges water faster.
- The distance the water has to travel through the tissue to reach the cells in the middle of the cylinder — a shorter distance means water can leave (or enter) the central cells more quickly.
Understanding the Question
You have just described the trend in (a)(vi): more total surface area → less total length. The question now asks you to explain WHY this happens. The mark scheme gives three creditable points and asks for any two.
Approach
Connect the change in geometry (more pieces → more total surface area and a higher SA:V ratio) to the biology of osmosis. Mention either the larger area of contact, the higher SA:V ratio, or the shorter diffusion distance to the cells in the middle of the tissue.
Step-by-Step Reasoning
- The plant cells are losing water by osmosis because the NaCl solution outside has a lower (more negative) water potential than the cell sap.
- When you cut the cylinder into more pieces, you expose more of the tissue to the NaCl solution, so the (total) surface area in contact with the solution increases.
- The same volume of tissue now has a larger surface area, so the surface area to volume ratio also increases.
- Each piece is shorter, so the diffusion distance from the cut end to the cells in the middle of the piece is much smaller. Water can reach (or leave) the central cells more quickly.
- Any of these two points (or all three) explains why the more pieces lose water more quickly and end up shorter after the 20 min soak.
Key Takeaways
- The rate of an exchange process across a surface depends on surface area, SA:V ratio and diffusion distance.
- Cutting a sample into smaller pieces is a standard way to speed up exchange with the surrounding solution.
- An 'explain' question needs the link between observation and mechanism, not just the observation.
Common Mistakes
- Saying 'more pieces means more water loss' without the mechanistic reason (surface area, SA:V ratio or diffusion distance).
- Writing 'the cells are smaller' — the cells are the same size, only the cylinder is cut into pieces.
- Stating that the NaCl 'enters' the cells — NaCl ions enter only very slowly; it is the water that leaves the cells by osmosis.
Things to Be Careful About
- The mark scheme requires you to pick any TWO of the three listed points, not all three (although all three would not be penalised). Be specific: 'in contact with the sodium chloride solution' for the surface area point; 'to the cells in the middle of the cylinder' for the diffusion distance point.
State one source of error in this investigation when measuring the dependent variable in step 11 and step 12.
Answer
It is difficult to line up the cylinders exactly end-to-end because there will be small gaps between the cut ends and the pieces may not be perfectly straight, leading to a measured length that is slightly different from the true total length.
Difficult to line up the cylinders exactly end-to-end (gaps between pieces / pieces not straight).
Background Concept
A 'source of error' in a practical is a specific difficulty with the procedure that makes the measured value different from the true value. It is not the same as a 'mistake' (a blunder) and it is not the same as a 'limitation' (a feature of the design). A good source of error names the step where the problem occurs, what makes the measurement inaccurate, and how that inaccuracy arises.
Understanding the Question
The question specifically asks about measuring the dependent variable in step 11 and step 12. In those steps you place the pieces of plant tissue end-to-end on the white tile (as shown in Fig. 1.3) and measure the total length. The mark scheme credits the idea that lining up the cylinders exactly is hard because there are gaps between the cut ends and the pieces are not perfectly straight.
Approach
Identify the practical difficulty in step 11/12: the pieces are round, they don't sit perfectly flat, there are small gaps between the cut ends, and the pieces are not perfectly straight. Any of these makes the measured total length slightly different from the true total length.
Step-by-Step Reasoning
- After pouring off the NaCl solution, the pieces of plant tissue are placed on a white tile.
- They need to be lined up end-to-end so that they touch, and then the total length from one end to the other is measured.
- The pieces are cylinders, so their cut ends are circular — when two pieces are placed end-to-end, the contact is only at one point, leaving a small gap.
- Some pieces may be slightly curved (the cylinders are not perfectly straight), which adds to the inaccuracy.
- The result is a measured total length that may be slightly longer than the true total length (because the gaps and curvature add extra distance), introducing a systematic error into the length measurement.
Key Takeaways
- A source of error must be specific to the step being examined (here, step 11/12) — generic answers like 'human error' are not credited.
- The mark scheme for CIE Paper 3 values answers that pinpoint the actual practical difficulty.
Common Mistakes
- Saying 'human error' or 'parallax error' without linking it to the lining-up problem.
- Saying 'the ruler is not accurate' — this is a limitation of the equipment, not a source of error in the procedure.
- Identifying an error in a different step (e.g. measuring the diameter, or cutting the cylinders) — the question is about step 11/12 specifically.
Things to Be Careful About
- The question says 'one' source of error; do not list several.
- Avoid 'the pieces are different sizes' — the pieces were all cut to the same length in step 5; the issue is how they line up, not their original length.
Suggest how you could modify this procedure to investigate the effect of temperature on the movement of water between the sodium chloride solution and the cells in the plant tissue.
Answer
- Use the same surface area / one (fixed) length of plant tissue (e.g. one whole cylinder of 40 mm) in each trial.
- Use five different temperatures (e.g. 20 °C, 30 °C, 40 °C, 50 °C, 60 °C) for the NaCl solution, achieved by placing the beakers in a water bath at each temperature.
Use the same surface area / one length of plant tissue; use five different temperatures.
Background Concept
To change the independent variable of an investigation you vary only that variable and keep every other relevant variable constant. In the original experiment the independent variable is the surface area of plant tissue (changed by cutting the cylinder into more pieces); here the question asks you to change the independent variable to temperature, so surface area (and the length of the tissue) must be kept constant. Using a water bath is the standard way to control the temperature of a solution in a school or college laboratory.
Understanding the Question
The question asks you to suggest how to modify the procedure so that the investigation tests the effect of temperature (instead of surface area) on the movement of water between the NaCl solution and the cells. The mark scheme requires two points: (1) keep the surface area / length the same, and (2) use five different temperatures.
Approach
Decide which variable to keep constant (surface area — use one length of plant tissue in every trial) and which to vary (temperature — pick five values, evenly spaced over a sensible range, e.g. 20 °C to 60 °C in 10 °C steps).
Step-by-Step Reasoning
- The new independent variable is temperature, so the NaCl solution in each beaker must be at a different temperature. Use a water bath to bring each beaker (containing the tissue and the NaCl) to the desired temperature before starting the 20 min soak.
- The surface area of plant tissue must be the same in every beaker, otherwise it would also affect the rate of water movement. Use one cylinder of plant tissue in every beaker, or cut several cylinders to the same length and use the same number of pieces in each beaker.
- Pick a range of five temperatures, e.g. 20 °C, 30 °C, 40 °C, 50 °C and 60 °C. The range should be wide enough to show an effect but not so hot that the tissue is damaged (above about 60 °C plant cells start to die and proteins denature, confounding the result).
- Keep every other variable the same: the concentration of NaCl solution, the volume of solution, the soaking time (20 min) and the way the length is measured.
Key Takeaways
- A modification for a new IV means: vary the new IV, control everything else.
- Five values is the CIE-recommended minimum number of values for the IV (to allow a trend to be seen).
- A water bath is the standard way to control temperature.
Common Mistakes
- Forgetting to keep the surface area constant — if you also change the number of pieces, you cannot tell whether any change in length is due to temperature or to surface area.
- Using only two or three temperatures — fewer than five values is not enough to see a trend.
- Using temperatures so high that the tissue is cooked (e.g. 80 °C or 100 °C) — this kills the cells and is not a valid test of osmosis.
Things to Be Careful About
- The eye-protection recommendation still applies when handling solutions, even if temperature is now the focus.
- The 20 min soaking time should be kept the same, so the only difference between beakers is the temperature.
A student investigated the effect of different concentrations of sodium chloride solution on red blood cells.
The student:
- counted the number of whole red blood cells in six samples of blood
- put each sample into a different concentration of sodium chloride solution for 10 minutes
- counted the number of whole red blood cells remaining in each concentration
- calculated the number of red blood cells remaining as a percentage of the number of red blood cells in each sample at the start.
The results are shown in Table 1.4.
Table 1.4
| percentage concentration of sodium chloride | percentage number of whole red blood cells remaining |
|---|---|
| 0.00 | 0.0 |
| 0.40 | 3.0 |
| 0.50 | 10.0 |
| 0.65 | 46.0 |
| 0.80 | 96.0 |
| 0.90 | 100.0 |
Plot a graph of the data shown in Table 1.4 on the grid in Fig. 1.4.
Use a sharp pencil.
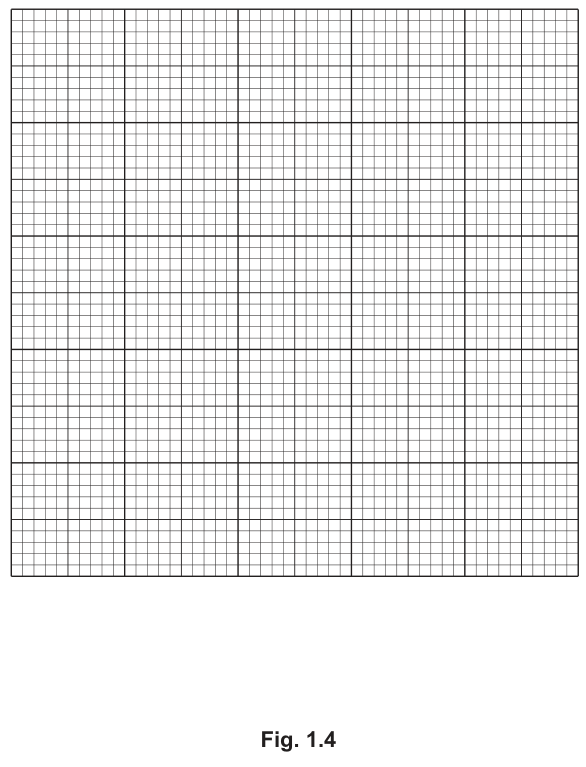
Answer
A graph with the following features:
- x-axis: 'percentage concentration of sodium chloride / %' with even scale; labels at 0, 0.2, 0.4, 0.6, 0.8, 1.0
- y-axis: 'percentage number of whole red blood cells remaining / %' with even scale; labels at 0, 20, 40, 60, 80, 100
- Six points plotted as small dots in circles: (0.00, 0), (0.40, 3), (0.50, 10), (0.65, 46), (0.80, 96), (0.90, 100)
- The six points joined with a thin straight line passing through all of them, producing an S-shaped (sigmoidal) curve
See working: graph plotted on Fig. 1.4 with the six points joined by a thin line.
Background Concept
A CIE Paper 3 graph on a provided grid must follow strict conventions to earn the four marks available:
- The independent variable goes on the x-axis (horizontal) and the dependent variable on the y-axis (vertical). Both axes must be labelled with the quantity and the unit (separated by a solidus, e.g. 'percentage concentration of sodium chloride / %').
- The scale on each axis must be even (e.g. 0.2 per 2 cm on the x-axis, 20 per 2 cm on the y-axis) and use at least half the grid. Major labels must appear at least every 2 cm.
- Each data point is plotted as a small dot inside a circle (⊚) or as a small cross (×). Pencil must be sharp so the marks are accurate.
- The points are joined with a thin line (or a smooth curve) passing through all of them — not a line of best fit, because every data point is meaningful here.
Understanding the Question
The question gives six pairs of values in Table 1.4 (concentration of NaCl on the x-axis, percentage of whole red blood cells remaining on the y-axis) and asks you to plot them on the grid in Fig. 1.4 using a sharp pencil. The marks are for the four conventions listed above.
Approach
Decide on the scales first. For the x-axis, the data range is 0.00 to 0.90; a scale of 0.2 per 2 cm (i.e. 0.1 per cm) with labels at 0, 0.2, 0.4, 0.6, 0.8, 1.0 fits the data. For the y-axis, the data range is 0 to 100; a scale of 20 per 2 cm (i.e. 10 per cm) with labels at 0, 20, 40, 60, 80, 100 fits the data. Then plot each of the six points as a small dot in a circle, and join them with a thin straight line.
Step-by-Step Reasoning
- x-axis label: 'percentage concentration of sodium chloride / %'.
- y-axis label: 'percentage number of whole red blood cells remaining / %'.
- x-axis scale: 0.1 per cm (0.2 per 2 cm), with major labels at 0, 0.2, 0.4, 0.6, 0.8, 1.0.
- y-axis scale: 10 per cm (20 per 2 cm), with major labels at 0, 20, 40, 60, 80, 100.
- Plot each of the six points accurately:
- (0.00, 0) at the origin.
- (0.40, 3) — 3 is very close to the x-axis.
- (0.50, 10) — exactly on the y = 10 gridline.
- (0.65, 46) — between the y = 40 and y = 60 gridlines.
- (0.80, 96) — just below the y = 100 gridline.
- (0.90, 100) — on the y = 100 gridline.
- Join the six points with a thin straight line. The line should pass through every point exactly.
The resulting curve is S-shaped (sigmoidal): flat at low concentrations (where the cells burst and none remain whole), then steeply rising through the mid-range (where some cells survive and some burst), and then flat again at high concentrations (where all the cells survive intact because the solution is approximately isotonic with the cytoplasm).
Key Takeaways
- CIE graph marks are for: correct axes and labels, correct scale, correct plotting, and correct line.
- Use a sharp pencil; a small dot in a circle is the standard point symbol.
- Join the points with a thin line (or smooth curve) that passes through all of them.
Common Mistakes
- Forgetting the unit on an axis label.
- Using a non-even scale (e.g. 0, 0.5, 0.75 on the x-axis).
- Using a scale that is too small (e.g. 0 to 0.1 on the x-axis), so most of the grid is wasted.
- Plotting the points as large dots that hide their exact position.
- Drawing a line of best fit (this is wrong here — the points must be joined directly).
Things to Be Careful About
- The grid in Fig. 1.4 is fixed; the scale must be chosen to fit both the data and the available grid.
- Sharp pencil, thin line, and small point symbols are the CIE expectations.
State the concentration of sodium chloride solution that has the same water potential as the red blood cells.
sodium chloride concentration = ______
Answer
sodium chloride concentration = 0.9%
0.9%
Background Concept
The water potential of a solution is the potential energy of water in that solution, measured in kPa. Pure water has a water potential of 0 kPa; dissolved solutes make the water potential more negative. When a red blood cell is placed in a solution, water moves by osmosis from the region of higher (less negative) water potential to the region of lower (more negative) water potential. The water potential of the cell is therefore the same as the water potential of a solution in which the cell neither gains nor loses water — its length and volume stay the same.
Understanding the Question
The question asks for the concentration of NaCl solution that has the same water potential as the red blood cells. From Table 1.4, the percentage of whole red blood cells remaining is 100.0 at a concentration of 0.90% NaCl — i.e. every cell is still whole, meaning no net water movement in or out, so the water potential of the cell and the solution are equal.
Approach
Find the row in Table 1.4 (or the point on the graph) where the percentage of whole red blood cells remaining is 100.0; the corresponding NaCl concentration is the answer.
Step-by-Step Reasoning
- In Table 1.4, look down the 'percentage number of whole red blood cells remaining' column.
- The value 100.0 is in the last row.
- The corresponding NaCl concentration in that row is 0.90%.
- Therefore, the NaCl concentration with the same water potential as the red blood cells is 0.9%.
(Equivalently, on the graph, the curve plateaus at 100% from 0.90% onwards; the first point at 100% is 0.90%.)
Key Takeaways
- The water potential of a cell equals that of an isotonic solution in which the cell neither gains nor loses water.
- 0.9% NaCl is the standard 'physiological saline' used in medicine for the same reason.
Common Mistakes
- Writing '0.65%' or '0.80%' — these concentrations have water potentials lower than the cell, so the cells gain water and burst.
- Writing '0.4%' — this has a water potential higher than the cell, so the cells burst.
Things to Be Careful About
- The answer is 0.9%, not 0.90% or 0.9 % with a space; any correct way of writing the value with the % sign is accepted.
With reference to water potential, explain the effect of sodium chloride solution on red blood cells.
Answer
0.4% sodium chloride solution has a higher (less negative) water potential than the red blood cells, so water enters the cells by osmosis. As a result, the cells swell and burst (lyse / haemolyse), which is why only 3% of cells remain whole.
0.4% NaCl has a higher water potential than the RBCs, so water enters the cells by osmosis and they burst.
Background Concept
Osmosis is the net movement of water molecules across a partially permeable membrane (the red blood cell surface membrane) from a region of higher water potential to a region of lower water potential. A 0.4% NaCl solution is very dilute, so it has a water potential close to 0 kPa — much higher (less negative) than the water potential of the red blood cell cytoplasm. Animal cells (such as red blood cells) lack a cell wall, so they cannot resist the inflow of water; they swell and the surface membrane ruptures (the cell 'bursts' or lyses / haemolyses).
Understanding the Question
The question asks you to explain, with reference to water potential, the effect of 0.4% NaCl solution on red blood cells. The mark scheme requires three linked ideas: (1) 0.4% NaCl has a higher water potential than the cells, (2) water enters the cells, and (3) the cells burst.
Approach
Compare the water potential of 0.4% NaCl to the water potential of the cells (which equals the water potential of 0.9% NaCl, from (b)(ii)). State the direction of net water movement and the consequence for the cells.
Step-by-Step Reasoning
- 0.9% NaCl is isotonic with the red blood cells (from (b)(ii)), so the cell water potential is equal to the water potential of 0.9% NaCl.
- 0.4% NaCl is more dilute than 0.9% NaCl, so its water potential is higher (less negative) than .
- Water therefore moves down the water potential gradient: from the 0.4% NaCl solution into the cells by osmosis.
- The cells swell and burst because they have no cell wall to resist the increase in volume. This is called haemolysis.
- The data in Table 1.4 shows only 3.0% of cells remain whole at 0.4% NaCl, confirming that almost all the cells have burst.
Key Takeaways
- A solution more dilute than the cell is hypotonic; water enters the cell.
- A solution more concentrated than the cell is hypertonic; water leaves the cell.
- Animal cells (without a cell wall) burst in a hypotonic solution; plant cells (with a cell wall) become turgid but do not burst.
Common Mistakes
- Saying the cells 'shrink' — they would shrink in a hypertonic solution, not a hypotonic one.
- Saying 'the NaCl enters the cells' — the NaCl ions enter only very slowly; it is the water that moves by osmosis.
- Stating only 'the cells burst' without giving the water-potential reason (the mark scheme requires the water-potential comparison).
Things to Be Careful About
- The question is a 1-mark 'explain', so the mark scheme requires ALL THREE of: higher water potential, water enters, cells burst. Missing any one of them loses the mark.
- Use the precise term 'water potential' rather than 'concentration'.
L1 is a slide of a stained transverse section through a plant organ.
Draw a large plan diagram of a region of the organ on L1 to include the epidermis and two vascular bundles. Use a sharp pencil.
Use one ruled label line and label to identify the phloem.
Answer
A large plan diagram of a region of the plant organ on L1, drawn with a sharp pencil, showing:
- The epidermis drawn as two parallel lines close together running around the outside of the region.
- Two vascular bundles drawn within the ground tissue, each divided into three areas (e.g. an outer phloem region, an inner xylem region, and a cambium or sclerenchyma cap between them).
- The ground tissue filling the space between the epidermis and the vascular bundles.
- No individual cells are drawn — only the outlines of the tissues.
- A ruled label line ending in the label phloem pointing to the phloem region of one vascular bundle.
- The diagram uses most of the available space and shows the correct relative proportions of the tissue layers.
See diagram
Background Concept
A plan diagram is a low-magnification drawing of a specimen that summarises the arrangement of the different tissues but does not show individual cells. It is the standard way to record the overall organisation of a plant organ (root, stem or leaf) for a biology practical.
By convention:
- The outer epidermis is drawn as two thin parallel lines, representing the outer and inner surfaces of the epidermal cells, with a small gap between them.
- Vascular tissue is shown as distinct regions within the ground tissue. In a young dicot stem each vascular bundle typically contains a phloem region (small thin-walled cells, outside), a xylem region (larger vessels, inside), and a vascular cambium (and often a sclerenchyma cap) between or around them — hence the three regions the mark scheme asks for.
- The ground tissue (cortex or pith) is drawn as an undifferentiated region between the epidermis and the vascular bundles.
- A plan diagram must be drawn with a sharp pencil so that lines are thin, continuous and clear. No shading is used.
Understanding the Question
You are given a stained transverse section of a plant organ on slide L1. The question asks you to draw a large plan diagram of a region that includes the epidermis and two vascular bundles, and to label the phloem. The drawing is marked against five criteria that test plan-diagram conventions and your ability to identify the phloem.
Approach
- Look at L1 under the microscope. Identify the main tissues: the epidermis around the outside, the ground tissue filling the bulk of the section, and the vascular bundles. Note the overall shape of the organ and the position of the vascular bundles.
- Choose a region containing two vascular bundles. Estimate the relative thickness of the epidermis, the ground tissue and the vascular bundles.
- Lightly sketch the outline, then draw the final version with a sharp pencil, applying plan-diagram conventions: no cells, double-line epidermis, three regions in each vascular bundle.
- Add a ruled label line and the word 'phloem'.
Step-by-Step Reasoning
- Mark 1 — uses most of the available space: A small diagram loses this mark. Spread the drawing out so the tissues are clearly visible and their proportions can be compared with the specimen.
- Mark 2 — correct number of tissues AND no cells: Only the three tissue types mentioned (epidermis, vascular bundle, ground tissue) should be shown. No cell walls, no nuclei, no individual cells inside the ground tissue — those belong in a high-power cell drawing, not a plan diagram.
- Mark 3 — epidermis as two lines close together: A single layer of cells is represented, in plan-diagram convention, by two thin parallel lines (outer and inner cell surfaces) with a small gap between them.
- Mark 4 — at least one vascular bundle divided into three areas: A dicot vascular bundle has phloem, xylem and a third region (cambium or sclerenchyma cap). Drawing three distinct regions inside at least one bundle shows the examiner that you can recognise this organisation.
- Mark 5 — ruled label line and label to identify the phloem: A label line is a single straight horizontal line drawn with a ruler, ending in a clear label. The line should end exactly on the phloem region of the bundle, with the word 'phloem' written neatly to one side.
Key Takeaways
- A plan diagram is a low-magnification summary of tissue arrangement, drawn without cells.
- Conventions: sharp pencil, thin continuous lines, no shading, no cells, double-line epidermis, ruled label lines.
- A typical dicot stem vascular bundle has three recognisable regions: phloem, xylem, and a cambium or sclerenchyma cap.
Common Mistakes
- Drawing individual cells inside the ground tissue (that is a high-power cell drawing, not a plan diagram).
- Drawing the epidermis as a single thick line instead of two parallel lines.
- Drawing the vascular bundle as a single uniform region instead of three distinct areas.
- Drawing the label line freehand instead of with a ruler, or pointing the label line to the wrong region of the bundle.
- Making the diagram too small and losing the 'most of the available space' mark.
Things to Be Careful About
- Use a sharp pencil so the lines are crisp and the diagram can be cleanly erased if needed.
- The relative thickness of the tissues in the diagram must reflect the specimen — the epidermis is a thin layer, the vascular bundles are compact, and the ground tissue fills the rest.
- The label line should end exactly on the phloem, with the word 'phloem' written neatly to one side.
- Do not shade any tissue in a plan diagram — shading is not used at this magnification.
Observe the xylem on the section of the plant organ on L1.
Select a line of four adjacent xylem vessel elements.
Each xylem vessel element must touch at least one of the other xylem vessel elements.
- Make a large drawing of this line of four xylem vessel elements.
- Use one ruled label line and label to identify the lumen.
Answer
A large high-power drawing of four adjacent xylem vessel elements arranged in a line, drawn with a sharp pencil, showing:
- Four xylem vessel elements drawn in a line, each touching at least one of the others.
- Cell walls drawn as two lines (not a single thick line).
- At least two vessel elements with more than four sides (i.e. five, six or seven sides) — polygonal, not rectangular.
- No shading anywhere in the drawing.
- Continuous, thin, sharp lines throughout.
- A ruled label line ending in the label lumen pointing to the hollow centre of one vessel element.
See diagram
Background Concept
A high-power cell drawing is a detailed drawing of a small number of cells as seen under the high-power objective of the microscope. It is the standard way to record the structure of individual cells. By convention:
- Cell walls are drawn as two parallel lines (not a single thick line), because a plant cell wall has two surfaces separated by the middle lamella.
- The shapes of the cells reflect what is seen — in this case mature xylem vessel elements are dead, hollow tubes with thickened lignified walls and a polygonal cross-section (often five- to seven-sided) because they are packed tightly together.
- No shading is used; only clear outlines.
- A label line is a single, straight, horizontal line drawn with a ruler, ending in a clear label.
- The lumen of a vessel element is its hollow interior (the space where water is conducted after the cell contents have died away).
Understanding the Question
You are asked to select a line of four adjacent xylem vessel elements in the section on L1, where each vessel element touches at least one of the others, and to make a large drawing of them. You then label the lumen. The drawing is marked against five criteria that test high-power cell drawing conventions.
Approach
- Examine L1 under the microscope. Locate the xylem regions of the vascular bundles and identify individual xylem vessel elements. Xylem vessels are usually the largest, thickest-walled cells in the bundle and have wide, empty (hollow) centres.
- Find a line of four adjacent vessel elements where each one touches at least one other (i.e. the cells share walls and are next to each other in a row, not separated by intervening parenchyma cells).
- Draw the four cells large and clear, applying high-power cell drawing conventions.
- Add a ruled label line and the word 'lumen'.
Step-by-Step Reasoning
- Mark 1 — lines continuous, thin and sharp, no shading: Use a sharp pencil. Do not sketch, do not use felt pen, and do not shade any part of the drawing (the vessels are hollow and empty, so there is nothing to shade).
- Mark 2 — a line of four xylem vessel elements, each touching at least one other: Choose four vessel elements that are next to each other in a row. 'Touching' means they share a wall — they are not separated by intervening parenchyma cells.
- Mark 3 — cell wall drawn as two lines: Each shared wall is a pair of parallel lines (one from each cell). Even the outer walls of the end cells should be drawn as two lines.
- Mark 4 — at least two vessel elements with more than four sides: Mature xylem vessel elements are polygonal in cross-section, often five- to seven-sided, because they are tightly packed against their neighbours. Avoid drawing them as simple rectangles or squares.
- Mark 5 — label line and label to identify the lumen: A label line is drawn with a ruler, ending exactly on the empty interior of one vessel element, with the label 'lumen' written at the end of the line.
Key Takeaways
- A high-power cell drawing shows individual cells with double-line walls.
- Xylem vessel elements are polygonal (more than four sides) in cross-section and have a wide, empty lumen.
- Drawing conventions: sharp pencil, continuous thin lines, no shading, ruled label lines.
Common Mistakes
- Drawing the cells as rectangles or squares (xylem vessels are polygonal because they are tightly packed against their neighbours).
- Drawing cell walls as a single thick line instead of two lines.
- Shading the inside of the vessel elements (they are hollow — there is nothing to shade).
- Drawing the cells too small or selecting cells that are not actually adjacent / not touching.
- Drawing the label line freehand instead of with a ruler, or pointing it to the wall instead of the lumen.
Things to Be Careful About
- The four vessel elements must form a line — they must be arranged in a row so that each one (or at least the middle ones) touches two others.
- Each cell touches at least one other — do not pick a group of four where one is isolated from the rest by parenchyma.
- The 'lumen' label must point to the empty interior of the cell, not to the wall.
- The drawing should be large — the cells should fill most of the available space so the structures are easy to see.
Fig. 2.1 is a diagram of a stage micrometer scale that is being used to calibrate an eyepiece graticule.
One division, on either the stage micrometer scale or the eyepiece graticule, is the distance between two adjacent lines.
The length of one division on this stage micrometer is .
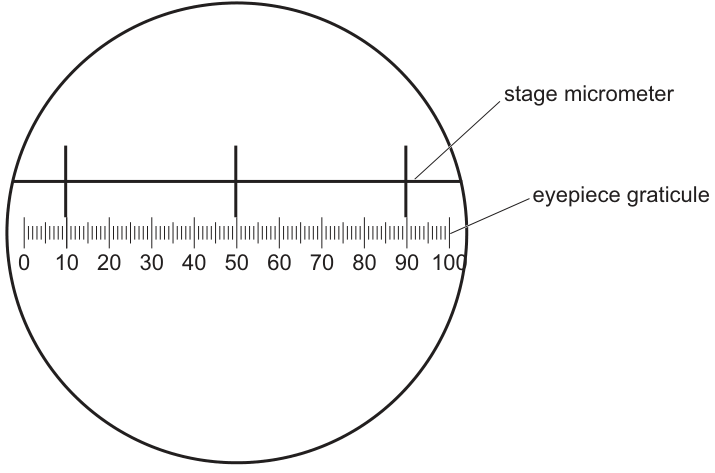
Use Fig. 2.1 to calculate the actual length of one eyepiece graticule unit.
Show your working and give your answer in micrometres ().
actual length = ______
Working
From Fig. 2.1, 40 eyepiece graticule units align with 1 stage micrometer division.
1 stage micrometer division =
1 eyepiece graticule unit =
Answer
2.5 µm
Background Concept
An eyepiece graticule is a small scale (usually 100 divisions) etched into the eyepiece of a microscope. Because the apparent size of an object under the microscope depends on the magnification, the graticule must be calibrated before it can be used to measure actual sizes. Calibration is done by aligning the graticule with a stage micrometer, which is a slide with a scale of known length (in this case 0.1 mm per division).
Once calibrated, the number of graticule divisions spanned by a structure can be multiplied by the actual length of one division to give the structure's actual size.
Understanding the Question
Fig. 2.1 shows the stage micrometer scale (top) and the eyepiece graticule scale (bottom) superimposed, with both scales starting at 0. You are told that one stage micrometer division = 0.1 mm and must calculate the actual length of one eyepiece graticule unit in micrometres.
The marks reward the working (showing the division of 100 by 40) and the final answer (2.5 µm).
Approach
- From Fig. 2.1, count how many eyepiece graticule divisions fit into one stage micrometer division (the smallest tick interval on the stage micrometer scale).
- Convert the length of one stage micrometer division to micrometres (1 mm = 1000 µm, so 0.1 mm = 100 µm).
- Divide that length by the number of eyepiece divisions to get the actual length of one eyepiece division.
Step-by-Step Reasoning
- In Fig. 2.1, the eyepiece graticule is finer than the stage micrometer. 40 eyepiece graticule divisions fit inside one stage micrometer division (i.e. in 0.1 mm).
- 0.1 mm = 100 µm (because 1 mm = 1000 µm).
- 1 eyepiece graticule unit = 100 µm ÷ 40 = 2.5 µm.
This is the value you will use in part (b)(ii) to convert the graticule reading of structure T into an actual length.
Key Takeaways
- An eyepiece graticule is calibrated against a stage micrometer of known length.
- Calibration gives a conversion factor: actual length per graticule unit.
- Remember to convert mm to µm when required: 1 mm = 1000 µm.
Common Mistakes
- Forgetting to convert 0.1 mm into µm (writing 0.1 µm or 100 mm).
- Dividing the wrong way (e.g. dividing 40 by 100 instead of 100 by 40).
- Reading the wrong number of eyepiece units per stage division from Fig. 2.1.
Things to Be Careful About
- Make sure the conversion uses 1 mm = 1000 µm, so 0.1 mm = 100 µm.
- Use the smallest tick interval on the stage micrometer as 'one division' (the labels 0, 10, 20... mark groups of divisions, not individual ones).
- Keep full precision in the working — the mark scheme gives the answer 2.5 µm but your working must show the steps.
Fig. 2.2 is a photomicrograph of a stained transverse section of the same plant organ as the section on L1 but from a different plant.
This was taken using the same microscope and eyepiece graticule as in Fig. 2.1.
The eyepiece graticule scale has been placed across one of the larger sections of vascular tissue, labelled T in Fig. 2.2.
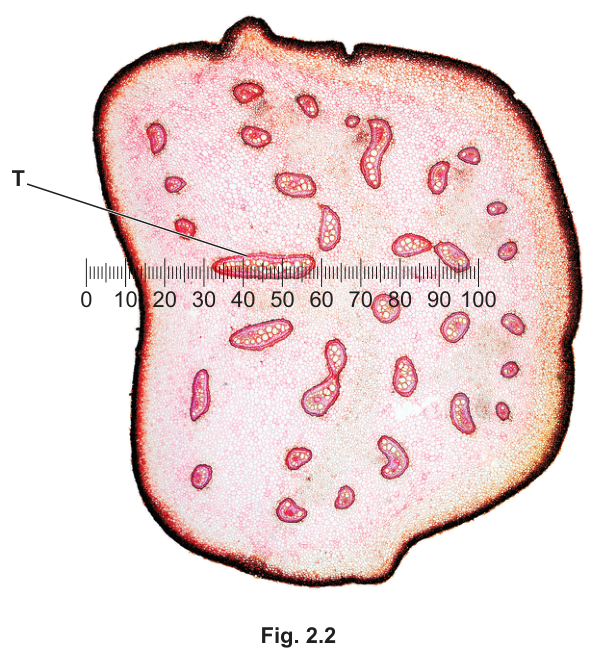
Use the calibration of the eyepiece graticule unit from (b)(i) to calculate the actual length of the section of vascular tissue T in Fig. 2.2.
Show your working and use appropriate units.
actual length of the vascular tissue T = ______
Working
From Fig. 2.2, the section of vascular tissue T spans 40 eyepiece graticule units along the graticule (e.g. from about the 30 mark to the 70 mark on the 0–100 scale).
1 eyepiece graticule unit = (from (b)(i))
Actual length of T =
Answer
100 µm
Background Concept
Once the eyepiece graticule has been calibrated, the actual size of any structure under the same microscope is obtained by multiplying the number of graticule divisions it spans by the calibration factor (the actual length of one division).
This is a simple, repeatable way to measure specimen dimensions without having to take a separate photomicrograph with a scale bar.
Understanding the Question
Fig. 2.2 is a photomicrograph of a similar (but different) transverse section of the same plant organ as on L1, taken using the same microscope and eyepiece graticule as in Fig. 2.1. The graticule scale has been placed across a section of vascular tissue labelled T. You must use the calibration from (b)(i) (2.5 µm per graticule unit) to find the actual length of T.
Approach
- Read from Fig. 2.2 the number of eyepiece graticule units that T spans along the graticule.
- Multiply that number by the calibration factor from (b)(i) (2.5 µm per unit).
- State the answer with the correct unit.
Step-by-Step Reasoning
- T spans 40 eyepiece graticule units along the scale shown in Fig. 2.2.
- 1 eyepiece graticule unit = 2.5 µm (from (b)(i)).
- Actual length of T = 40 × 2.5 µm = 100 µm.
The two marks are awarded for: (1) stating the correct number of graticule units along T, and (2) multiplying this number by 2.5 µm. If your reading of the graticule is slightly different, the second mark can still be awarded for the correct multiplication (error carried forward).
Key Takeaways
- Once a graticule is calibrated, measurement = graticule units × calibration factor.
- Always use the same microscope and graticule for the calibration and the measurement, otherwise the calibration no longer applies.
- Always quote the answer with the correct unit (µm here, since the calibration was in µm).
Common Mistakes
- Using a different calibration (e.g. the calibration from a different microscope or objective lens).
- Reading the number of graticule units incorrectly — make sure you read along the line of T, not along the whole scale.
- Forgetting the unit (writing '100' without 'µm').
- Converting units incorrectly (e.g. treating 2.5 µm as 2.5 mm).
Things to Be Careful About
- The exact number of graticule units will depend on how you read Fig. 2.2 — give a clear answer and quote it in the working.
- The two marks are independent: an incorrect reading can still earn the second mark if the multiplication is done correctly (error carried forward).
- Always include the unit in the final answer.
Fig. 2.3 is the same photomicrograph as that shown in Fig. 2.2.
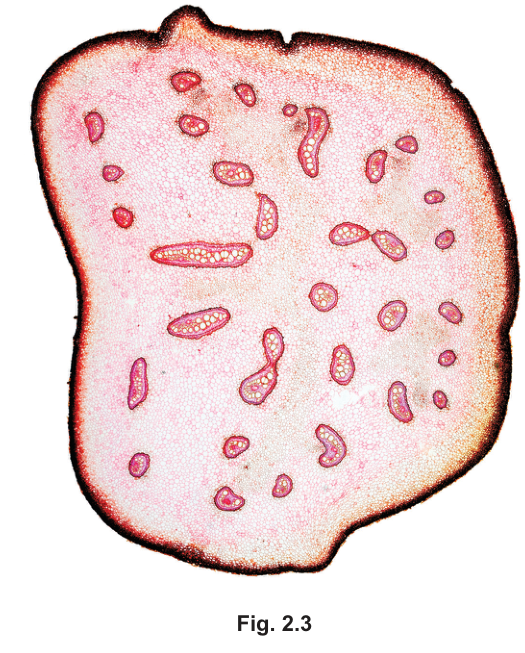
Identify three observable differences, other than colour, between the section on L1 and the section in Fig. 2.3.
Record these three observable differences in Table 2.1.
Table 2.1
| feature | L1 | Fig. 2.3 |
|---|---|---|
Answer
| feature | L1 | Fig. 2.3 |
|---|---|---|
| shape of organ | round | rectangular / irregular |
| position of vascular bundles | in a ring near the epidermis | scattered throughout the ground tissue |
| sizes of the vascular bundles | all a similar size | a mixture of large and small sizes |
See table
Background Concept
Comparing two specimens means recording only what you can see under the microscope (or in a photomicrograph) — shape, position, size, arrangement, distribution. It does not mean giving a vague description or stating a feature only one of the two has. Each difference should be expressed as a clear contrast between the two specimens.
For plant organs, useful observable features include:
- the overall shape of the organ (round, rectangular, irregular);
- the position of the vascular bundles (e.g. in a ring near the epidermis, scattered, central);
- the sizes of the vascular bundles (uniform vs. mixed);
- the arrangement of xylem vessels inside the bundles (in lines, scattered);
- the presence or absence of features such as a pith, a cortex, or a cuticle.
Understanding the Question
You are given a stained transverse section of a plant organ on slide L1 (which you look at under the microscope) and a photomicrograph of a different section of the same type of organ in Fig. 2.3. You must identify three observable differences (other than colour) between the two and record them in Table 2.1.
The mark scheme allows any three from a small list; you do not need to find all four.
Approach
- Look at L1 under the microscope and observe the shape of the organ, the position and sizes of the vascular bundles, and the arrangement of the xylem vessels inside them.
- Look at Fig. 2.3 and observe the same features.
- For each feature, write a short, clear contrast in the table, e.g. 'round' vs 'rectangular'.
Step-by-Step Reasoning
Three observable differences (other than colour) between L1 and Fig. 2.3:
- Shape of the organ: L1 is round; Fig. 2.3 is rectangular / irregular (slightly flattened in places).
- Position of the vascular bundles: In L1 the vascular bundles are arranged in a ring near the epidermis; in Fig. 2.3 they are scattered throughout the ground tissue.
- Sizes of the vascular bundles: In L1 all the vascular bundles are about the same size; in Fig. 2.3 there is a mixture of large and small bundles.
(An additional valid difference would be the arrangement of xylem vessels: in L1 they are in lines, in Fig. 2.3 they are scattered within the bundle.)
Key Takeaways
- When comparing two specimens, record observable features only — no inference about function or identity unless it is directly visible.
- Express each difference as a clear contrast in the table.
- 'Other than colour' is specified, so colour is not credited.
Common Mistakes
- Vague statements such as 'they look different' (no observable feature given).
- Stating a feature of only one of the two specimens (the table requires a contrast in both columns).
- Mentioning 'colour' (the question explicitly excludes colour).
- Confusing the position of the vascular bundles (in a ring vs scattered) with their size (similar vs mixed) — these are two different contrasts.
Things to Be Careful About
- Each row of the table must contain a clear contrast — e.g. 'round' vs 'rectangular', not 'round' vs 'different'.
- The differences must be observable in both specimens, not inferred (e.g. don't say 'Fig. 2.3 is a monocot stem' — instead say 'the vascular bundles are scattered').
- Only the three best differences are credited; do not list more than three unless the question allows it.
Identify the plant organ on L1 and in Fig. 2.3.
State how one observable feature helped you to identify the plant organ.
plant organ ______
______
Answer
Plant organ: stem
Observable feature: the vascular bundles are arranged in a ring near the epidermis (in L1), which is characteristic of a (dicotyledonous) stem.
stem; vascular bundles in a ring near the epidermis
Background Concept
A transverse section of a young dicotyledonous stem has a number of recognisable features:
- the vascular bundles are arranged in a single ring near the outside of the stem, just inside the epidermis;
- each vascular bundle has phloem on the outside, xylem on the inside, and a vascular cambium between them;
- the ground tissue is divided into a narrow cortex (outside the ring) and a large central pith (inside the ring);
- the outline of the section is generally rounded.
By contrast, a dicot root has the xylem in the centre forming an 'X' shape with the phloem between the arms, and a monocot stem has the vascular bundles scattered throughout the ground tissue (as in Fig. 2.3). In all cases the organ is still a stem — only the type of stem (dicot vs monocot) differs.
Understanding the Question
You are asked to identify the plant organ on L1 and in Fig. 2.3 and to state one observable feature that helped you identify it. The mark is awarded only if you give the correct organ and a correct observable feature that supports the identification.
Approach
- Look at the position of the vascular bundles: in L1 they are in a ring near the epidermis — that is the classic arrangement of a young dicot stem.
- In Fig. 2.3 the vascular bundles are scattered, suggesting a monocot stem — but the question is about identifying the organ (stem vs root), not the type of stem, so 'stem' is the correct answer for both.
- Pick one observable feature (e.g. vascular bundles in a ring near the epidermis, on L1) to support the identification.
Step-by-Step Reasoning
- The organ is a stem because:
- the vascular bundles are arranged around the outside of the section (not in the centre as they would be in a root);
- each vascular bundle has phloem and xylem side by side (in a root the xylem is central and star-shaped).
- The single best observable feature is that the vascular bundles are in a ring near the epidermis (on L1), which is the diagnostic arrangement of a young dicotyledonous stem.
Key Takeaways
- Stems and roots can be distinguished by the position of the vascular tissue: in stems the bundles are around the outside; in roots the xylem is central.
- Identification marks require both the name of the organ and an observable feature that supports it.
Common Mistakes
- Writing 'root' (the arrangement of vascular bundles in a ring is characteristic of a stem, not a root).
- Writing 'monocot stem' / 'dicot stem' — the question only asks for the organ (stem), not the type.
- Giving a feature that cannot be observed (e.g. 'it has a vascular cambium' — that is an inference, not a directly observable feature under the microscope).
Things to Be Careful About
- The feature you give must be observable in the specimen (e.g. 'vascular bundles in a ring', 'phloem on the outside of the xylem').
- Do not give a functional description (e.g. 'transports water') — that is not observable.
- Make sure the feature is on the row labelled for L1 (the question accepts features from either specimen, but the mark scheme's example is taken from L1).