Biology 9700/34 — May/June 2025
Cambridge AS Level · Advanced Practical Skills · worked solutions for every part, with the mark scheme
Topics Manipulation, Measurement and Observation · Presentation of Data and Observations · Analysis, Conclusions and Evaluation
Catalase is an enzyme found in yeast cells. It catalyses the breakdown of hydrogen peroxide to produce water and oxygen, as shown in Fig. 1.1.
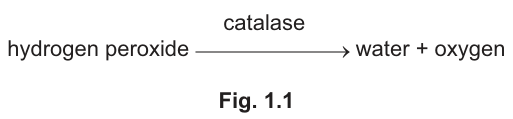
Fig. 1.1
You will investigate the effect of copper sulfate on the progress of this reaction. You will do this by stopping the reaction after 5 minutes and measuring the concentration of hydrogen peroxide remaining.
Potassium manganate(VII) is used to measure the concentration of hydrogen peroxide.
You are provided with the materials shown in Table 1.1.
Table 1.1
| labelled | contents | hazard | volume / |
|---|---|---|---|
| Y | yeast suspension | none | 20 |
| H | hydrogen peroxide solution | irritant | 20 |
| C | 1.0% copper sulfate solution | irritant | 30 |
| A | dilute sulfuric acid | irritant | 30 |
| P | potassium manganate(VII) solution | harmful | 30 |
| W | distilled water | none | 150 |
If any solution comes into contact with your skin, wash off immediately under cold water.
You should wear suitable eye protection.
It is recommended that you wear gloves when using A and P.
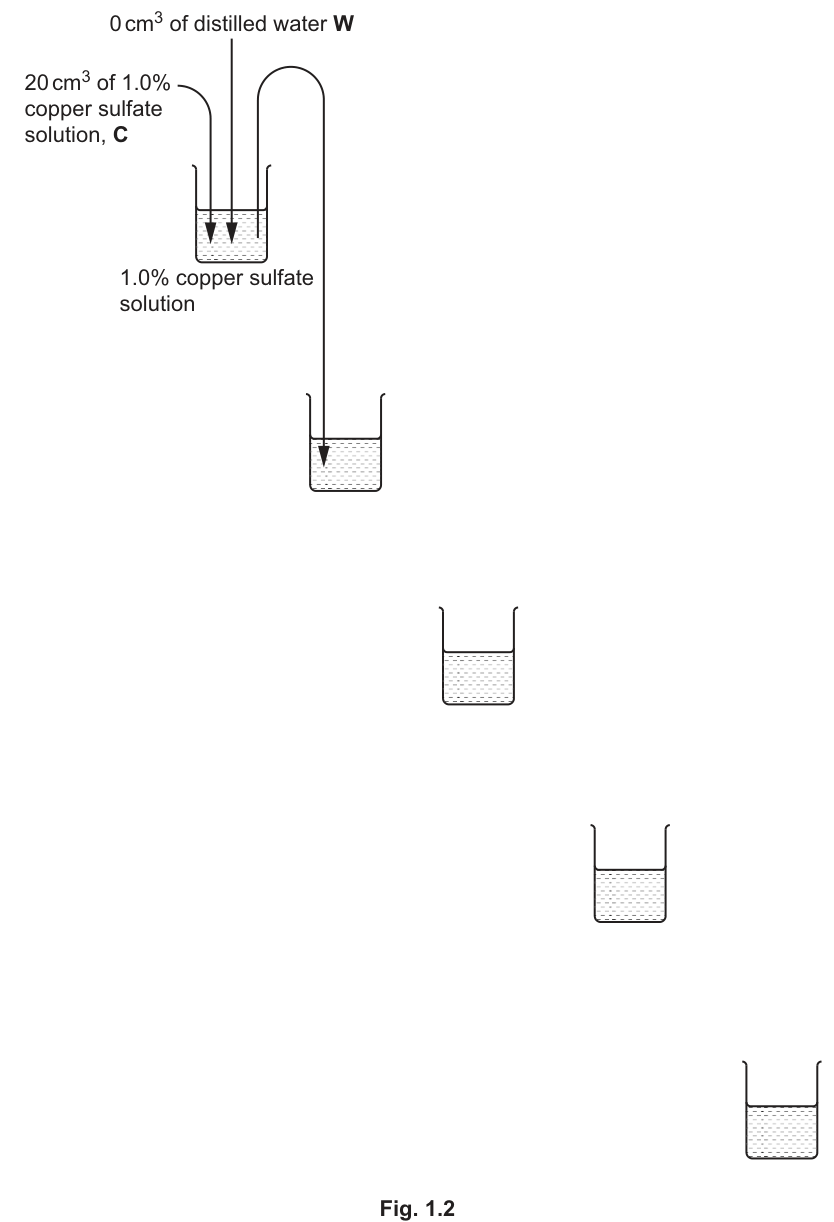
You will need to carry out a serial dilution of the 1.0% copper sulfate solution, C, to reduce the concentration by half between each successive dilution.
You will need to prepare four concentrations of copper sulfate solution in addition to the 1.0% copper sulfate solution, C.
After the serial dilution is completed, you need to have of each concentration available to use.
Complete Fig. 1.2 to show how you will prepare your serial dilution.
Each beaker should have:
- a labelled arrow to show the volume of copper sulfate solution transferred
- a labelled arrow to show the volume of distilled water, W, added
- a label under each beaker to show the concentration of the copper sulfate solution.
Answer
Complete Fig. 1.2 by adding the following labels:
- Beaker 1 (already filled): 1.0% copper sulfate, of W added (already shown).
- Beaker 2: transfer of copper sulfate solution from beaker 1; add of W; concentration = 0.5%.
- Beaker 3: transfer from beaker 2; add of W; concentration = 0.25%.
- Beaker 4: transfer from beaker 3; add of W; concentration = 0.125%.
- Beaker 5: transfer from beaker 4; add of W; concentration = 0.0625%.
0.5%, 0.25%, 0.125%, 0.0625%, each made by transferring of the previous concentration and adding of W.
Background Concept
A serial dilution is a stepwise dilution of a stock solution in which the concentration is reduced by the same factor at each step, and each new solution is made from the previous one. This produces a range of known concentrations spanning several orders of magnitude from a single stock. When the concentration is reduced by half between each step it is a 1:2 (twofold) serial dilution.
The new concentration is given by
For a halving, equal volumes of stock and diluent are mixed, so the amount of solute stays the same but the total volume doubles and the concentration halves.
Understanding the Question
This part of the question requires the candidate to complete Fig. 1.2 by adding labels to the four empty beakers. Each must be labelled with: the volume of copper sulfate solution transferred from the previous beaker, the volume of distilled water (W) added, and the final concentration. The starting beaker (1.0%) is already shown.
The question specifies that the concentration is to be halved between each successive dilution and that, after the serial dilution is completed, the candidate must have of each concentration available to use.
Approach
The simplest strategy that produces more than of each concentration and halves the concentration at each step is to transfer of the previous concentration into a new beaker and add of distilled water, giving of a solution at half the previous concentration. Apply this to all four remaining beakers, halving the concentration each time.
Step-by-Step Reasoning
- Beaker 1 contains of 1.0% copper sulfate and no water is added (already labelled in Fig. 1.2).
- Beaker 2: from beaker 1 plus of W gives
- Beaker 3: from beaker 2 plus of W gives
- Beaker 4: from beaker 3 plus of W gives
- Beaker 5: from beaker 4 plus of W gives
Each beaker now contains of solution — more than the required for the experiment.
Key Takeaways
- A serial dilution is the correct technique to produce a series of known concentrations from one stock solution.
- The dilution factor at each step is set by the ratio of the volume transferred to the total volume after diluent is added.
- Halving requires equal volumes of stock and diluent.
Common Mistakes
- Halving by subtracting 0.5% each time (e.g. writing 0.5%, 0%, −0.5%) instead of dividing by 2.
- Using unequal transfer and diluent volumes (e.g. 5 cm³ and 5 cm³ is acceptable if done consistently, but mixing transfer and diluent volumes breaks the serial pattern).
- Forgetting to label all four empty beakers, or only labelling the concentrations and not the volumes on the arrows.
Things to Be Careful About
- The mark scheme expects all four concentration labels (0.5%, 0.25%, 0.125%, 0.0625%) to be in the correct sequence under the correct beakers.
- Both the transfer arrow and the water arrow should be present and labelled on each beaker, not just on the first one.
- A common error is to label the water arrow going into the previous beaker rather than into the new beaker; the water is added to the new beaker before the solution is mixed.
Carry out step 1 to step 7.
step 1 Prepare the concentrations of copper sulfate solution as shown in Fig. 1.2.
step 2 Label test-tubes with the concentrations prepared in step 1.
step 3 Put of the 1.0% copper sulfate solution into the appropriately labelled test-tube.
step 4 Put of each of the other concentrations of copper sulfate solution, as prepared in step 1, into the appropriately labelled test-tube.
step 5 Stir the yeast suspension, Y, and put of Y into each test-tube. Shake the test-tubes gently to mix. Wait for 2 minutes.
step 6 Put of hydrogen peroxide solution, H, into each test-tube. Shake gently to mix. Wait for 5 minutes.
step 7 After 5 minutes, put of sulfuric acid, A, into each test-tube. Shake gently to mix.
The addition of sulfuric acid stops the breakdown of hydrogen peroxide.
You will now compare the concentration of hydrogen peroxide remaining in each test-tube using potassium manganate(VII) solution, P.
- When a drop of P is added to hydrogen peroxide solution, you will see a pink colour that quickly turns colourless as P reacts with the hydrogen peroxide.
- You will continue adding P, one drop at a time, until the end-point is reached.
- The end-point is when the pink colour stays for at least 5 seconds.
- You will count the number of drops to reach the end-point.
- The greater the concentration of hydrogen peroxide, the more drops of P are needed to reach the end-point.
Carry out step 8 to step 14.
step 8 Fill the syringe labelled P with solution P.
step 9 Wipe the outside of the syringe with a paper towel.
step 10 Hold the syringe labelled P over the test-tube containing the lowest concentration of copper sulfate solution. Release one drop of P into the test-tube.
step 11 Shake the test-tube to mix. Observe the colour to see if the end-point is reached. The end-point is when the pink colour stays for at least 5 seconds.
step 12 Repeat step 10 and step 11, counting the total number of drops released until the end-point is reached. You may need to refill the syringe with P.
step 13 Record in (a)(ii) the number of drops of P added. If the end-point has not been reached with 30 drops, record the result as 'more than 30'.
step 14 Repeat step 8 to step 13 with each of the other concentrations of copper sulfate solution prepared in step 1.
Record your results in an appropriate table.
Answer
Table of results (representative — actual values are student-dependent):
| concentration of copper sulfate / % | number of drops of P |
|---|---|
| 1.00 | 25 |
| 0.50 | 20 |
| 0.25 | 15 |
| 0.125 | 10 |
| 0.0625 | 5 |
Expected trend: as the concentration of copper sulfate increases, the number of drops of P needed to reach the end-point increases (i.e. more hydrogen peroxide remains).
Table with concentration of copper sulfate / % as the independent variable (left column) and number of drops of P as the dependent variable; the values rise as the concentration of copper sulfate rises.
Background Concept
The independent variable is the one the experimenter deliberately changes (here, the concentration of copper sulfate). The dependent variable is the one measured in response (here, the number of drops of potassium manganate(VII), P, needed to reach the end-point). In a results table, conventions require:
- the independent variable to be in the left-hand column;
- the dependent variable in the column to its right;
- both column headings to include the quantity being measured and its unit;
- all readings to be recorded to a sensible precision (here, whole drops).
Copper(II) ions are enzyme inhibitors — they bind to thiol (–SH) and amine groups on the enzyme, distorting the active site and reducing catalytic activity. The higher the copper sulfate concentration, the more catalase is inhibited and the less hydrogen peroxide is broken down, so the higher the concentration of hydrogen peroxide remaining after 5 minutes. More hydrogen peroxide means more drops of P are needed to reach the end-point, because each drop of P reacts with (and is decolourised by) a fixed amount of hydrogen peroxide.
Understanding the Question
The candidate has already performed the experiment in step 1 to step 14, titrating each of the five copper sulfate concentrations against the remaining hydrogen peroxide with P and counting the drops to the end-point. They must now record these results in an appropriate table. Because the candidate's actual numbers are not given here, the table below uses a representative set that illustrates the expected trend.
Approach
- Identify the independent variable: concentration of copper sulfate (varied by the serial dilution).
- Identify the dependent variable: number of drops of P (the response).
- Draw a two-column table with the independent variable on the left and the dependent variable on the right; include the unit in each heading.
- Record all five copper sulfate concentrations (1.00, 0.50, 0.25, 0.125, 0.0625%) and the corresponding number of drops.
- Make sure values are whole numbers — partial drops are not counted.
Step-by-Step Reasoning
- The mark scheme awards marks for: (1) an IV heading (concentration of copper sulfate / %) placed to the left of the DV heading, (2) a DV heading (number of drops of P), (3) a value for each of the five concentrations, (4) the expected trend (number of drops rises with copper sulfate concentration), and (5) results recorded as whole numbers.
- Representative results showing the expected trend:
- 1.00% → ~25 drops (most hydrogen peroxide left, most P needed)
- 0.50% → ~20 drops
- 0.25% → ~15 drops
- 0.125% → ~10 drops
- 0.0625% → ~5 drops (least inhibition, most catalase activity, least H₂O₂ left)
- The trend must be monotonically increasing as the copper sulfate concentration rises.
Key Takeaways
- Always include the quantity and unit in a column heading.
- The independent variable goes on the left, dependent on the right.
- The trend is the biologist's first qualitative interpretation of the data and is rewarded separately from the raw numbers.
Common Mistakes
- Putting the unit only on the values (e.g. writing '1.00%' as the heading) instead of in the heading itself.
- Reversing the columns (DV on the left, IV on the right).
- Recording 'more than 30' as a number rather than as written text, or recording half-drops.
- Showing no clear trend (results scattered randomly) — a sign that the procedure or recording was inaccurate.
Things to Be Careful About
- The mark scheme requires the unit in the heading (e.g. '%' or 'percentage' for the concentration; just 'drops' is acceptable for the DV, though 'number of drops of P' is preferred).
- Headings should be unambiguous: 'concentration of copper sulfate / %' is clearer than just 'CuSO₄'.
- If a particular tube genuinely requires more than 30 drops before the end-point, the result is recorded as 'more than 30' (text, not a number).
Describe the effect of changing the concentration of copper sulfate solution on the concentration of hydrogen peroxide remaining in the test-tubes.
Answer
The higher the concentration of copper sulfate, the higher the concentration of hydrogen peroxide remaining in the test-tubes.
The higher the concentration of copper sulfate, the higher the concentration of hydrogen peroxide remaining.
Background Concept
Copper(II) ions are a non-competitive (and at higher concentrations, often described as a general) enzyme inhibitor. They bind to groups outside the active site, changing the enzyme's tertiary structure and distorting the active site so that substrate (hydrogen peroxide) can no longer bind effectively. As a result, the rate at which catalase breaks down hydrogen peroxide falls as the copper sulfate concentration rises. After a fixed reaction time of 5 minutes (step 6), less hydrogen peroxide has been consumed in tubes with more copper sulfate, so more hydrogen peroxide remains.
Understanding the Question
This part asks the candidate to describe — in one sentence — how the concentration of hydrogen peroxide remaining changes as the concentration of copper sulfate changes. The answer must come from the candidate's own results in (a)(ii).
Approach
Read across the table from the lowest copper sulfate concentration to the highest, and observe the trend in the corresponding number of drops of P (which is proportional to the hydrogen peroxide remaining). State the relationship as a positive correlation in the form 'as X increases, Y increases'.
Step-by-Step Reasoning
- From the results in (a)(ii), the number of drops of P rises as the copper sulfate concentration rises.
- Because the number of drops is directly proportional to the hydrogen peroxide concentration (each drop of P reacts with a fixed amount of H₂O₂), the concentration of hydrogen peroxide remaining also rises with the copper sulfate concentration.
- The mark-scheme wording is 'the higher the concentration of copper sulfate, the higher the concentration of hydrogen peroxide' — a single direction-of-effect statement, no quantification required.
Key Takeaways
- Copper(II) ions inhibit catalase.
- A 'describe the effect' question requires a trend statement, not a mechanism (the mechanism would be a 'suggest' or 'explain' answer).
Common Mistakes
- Reversing the direction (saying 'more copper sulfate → less hydrogen peroxide remaining', which is incorrect here because copper sulfate is the inhibitor, not the activator).
- Adding a mechanism in a 'describe' question, which is unnecessary and may not score unless phrased carefully.
- Saying 'amount' instead of 'concentration' — the mark scheme is strict about this.
Things to Be Careful About
- 'Concentration' is the required term; 'amount' is not accepted in the mark scheme for this kind of question.
Answer
Any one from:
- The size of the drops released from the syringe varies.
- It is difficult to release P drop by drop (drops may come out in pairs or splashes).
- It is difficult to observe when the pink colour first stays for at least 5 seconds (the end-point is subjective).
The size of drops varies / it is difficult to release P drop by drop / it is difficult to judge when the pink colour persists for 5 s.
Background Concept
A 'source of error' is a feature of the procedure that introduces uncertainty into a measured value, making the result less reproducible. In a drop-counting titration like this one, the dominant sources of error are human and instrumental: the drops delivered by a syringe are not all the same volume, the syringe may not release a clean single drop, and the visual end-point (the moment the pink colour persists for ≥5 s) is judged by eye.
Understanding the Question
The question asks the candidate to describe one source of error specifically in step 10 to step 12 of the procedure — that is, the part where the candidate dispenses P drop by drop into the test-tube and judges the end-point.
Approach
Think about each physical action in step 10–12 and ask 'where could this go wrong?':
- Squeezing the syringe: drops may be of unequal size, or two drops may come out at once.
- Shaking the tube: mixing may be incomplete.
- Watching the colour: the pink tinge may be hard to see, or the 5-second persistence may be misjudged.
Choose the single most credible one.
Step-by-Step Reasoning
The mark scheme accepts any one of:
- Size of drops varies — different drops from the syringe contain different volumes of P, so the count is not a true measure of the amount of P added.
- Difficulty of releasing P drop by drop — the candidate may accidentally release two or more drops at a time, leading to an underestimate of the count.
- Difficulty of observing the pink colour — the end-point is judged by eye and depends on the lighting, the candidate's eyesight, and the contrast with the background.
Any one of these scores the mark.
Key Takeaways
- In a titration, the two main sources of error are (1) imprecise delivery of the titrant and (2) subjective judgement of the end-point.
- A 'source of error' is not the same as a 'systematic error' in this context — it is any factor that makes the reading less reliable.
Common Mistakes
- Giving a vague answer like 'human error' or 'the experiment is not accurate' — these are not specific and score nothing.
- Describing a source of error in a different step (e.g. contamination in step 5) when the question is restricted to step 10–12.
- Confusing 'source of error' with 'improvement'; the question only asks for the error.
Things to Be Careful About
- The error must be specific to the drop-counting stage, not a general complaint about the experiment.
- Each answer should be phrased so the source of the error is clear (e.g. 'size of drops varies' rather than 'the drops are wrong').
River water can sometimes be contaminated with copper sulfate from factories.
You will use the procedure described in step 5 to step 12 to estimate the concentration of copper sulfate in a sample of river water, R.
You are provided with the materials shown in Table 1.2.
Table 1.2
| labelled | contents | hazard | volume / |
|---|---|---|---|
| R | sample of river water with unknown concentration of copper sulfate | irritant | 20 |
step 15 Label a test-tube R. Put of R into the test-tube.
step 16 Repeat step 5 to step 12. Record the number of drops of P needed to reach the end-point in (a)(v).
State the number of drops needed to reach the end-point for sample R.
number of drops = ______
Answer
number of drops = (representative value, e.g. 17 — actual reading is student-dependent)
Record the result as a whole number, or as 'more than 30' if the end-point is not reached within 30 drops.
Whole number of drops recorded by the candidate (e.g. 17) or 'more than 30' if the end-point is not reached.
Background Concept
In a drop-counting titration, the number of drops of titrant needed to reach the end-point is proportional to the amount of substance being titrated. The river water sample R contains an unknown concentration of copper sulfate, and the same procedure (steps 5–12) is used to find how many drops of P are needed. The reading is then compared with the calibration produced in (a)(ii) to estimate the concentration in R (this is the role of (a)(vi)).
Understanding the Question
The question instructs the candidate to repeat the experimental procedure using a sample of river water (R) of unknown copper sulfate concentration, and to record the number of drops of P needed to reach the end-point. The candidate writes this number in the space provided.
Approach
Carry out step 5 to step 12 with R in place of the prepared copper sulfate solutions, and count carefully. The result is whatever the candidate observes in their own experiment — there is no single correct value.
Step-by-Step Reasoning
- Step 15: put of R into a labelled test-tube.
- Step 16: repeat the procedure from step 5 (add of yeast, wait 2 min, add of hydrogen peroxide, wait 5 min, add of sulfuric acid to stop the reaction) and then step 10–12 (add drops of P one at a time until the pink colour persists for ≥5 s).
- Record the number of drops as a whole number. If the end-point is not reached after 30 drops, record 'more than 30' instead of a number.
- The mark scheme awards the mark simply for recording a whole number (or the phrase 'more than 30').
Key Takeaways
- The drop-count is the raw data needed to estimate the unknown copper sulfate concentration in (a)(vi).
- The result is a single integer (or 'more than 30'), not a range or average — the procedure is run only once on R.
Common Mistakes
- Writing a non-integer (e.g. 17.5) or a range (e.g. 15–20) instead of a single whole number.
- Failing to write anything, or writing '?'.
Things to Be Careful About
- If the candidate genuinely cannot reach the end-point within 30 drops, the mark scheme explicitly accepts 'more than 30' as the answer.
Use your results in (a)(ii) and (a)(v) to estimate the concentration of copper sulfate in the sample of river water, R.
concentration of copper sulfate = ______
Answer
Compare the number of drops recorded for R in (a)(v) with the candidate's results in (a)(ii). The concentration of copper sulfate in R is the value that corresponds to the same number of drops of P.
(For example, if R required 17 drops, this lies between 0.50% (20 drops) and 0.25% (15 drops), so the concentration of copper sulfate in R is approximately 0.4%.)
The candidate's estimate, e.g. approximately 0.4% (or whatever value matches the candidate's own data).
Background Concept
A calibration is a set of data linking a known input (here, copper sulfate concentration) to a measured response (here, number of drops of P). Once a calibration is established, an unknown sample can be measured against it: the response for the unknown is read off and the corresponding input value is taken as the estimate of the unknown.
In this experiment, more copper sulfate → more inhibition of catalase → more H₂O₂ remaining → more drops of P needed. So the number of drops is a monotonically increasing function of copper sulfate concentration, and any drop count can be matched to a concentration by interpolation.
Understanding the Question
The candidate is asked to use their own results from (a)(ii) and (a)(v) to estimate the concentration of copper sulfate in the river water sample R.
Approach
- Read the number of drops recorded for R in (a)(v).
- Find the same number of drops (or the nearest value) in the table from (a)(ii) and read off the corresponding copper sulfate concentration.
- If the value falls between two recorded concentrations, interpolate.
Step-by-Step Reasoning
- The relationship between copper sulfate concentration and number of drops is positive and approximately linear over part of the range.
- For example, if (a)(ii) gives 1.00% → 25 drops, 0.50% → 20 drops, 0.25% → 15 drops, 0.125% → 10 drops, 0.0625% → 5 drops, and (a)(v) gives 17 drops for R, then 17 drops lies between 0.50% (20 drops) and 0.25% (15 drops). By linear interpolation, the concentration of R is approximately
- The exact value depends on the candidate's own data, so the answer must be read from the candidate's own table.
Key Takeaways
- A simple calibration lets you estimate an unknown from a single measurement.
- The estimate is only as reliable as the calibration; if the candidate's drop counts are inconsistent, the estimate is unreliable.
- Interpolation between two adjacent calibration points is more reliable than extrapolation beyond the range.
Common Mistakes
- Picking the closest single concentration and giving that as the answer, ignoring the fact that the value may lie between two recorded points.
- Reporting the answer as '0.5%' or '0.25%' without reference to the candidate's own data.
- Quoting a concentration outside the calibrated range (extrapolation) without acknowledging the uncertainty.
Things to Be Careful About
- The mark scheme awards the mark for using the candidate's own results in (a)(ii) — the answer must be consistent with the candidate's data, not a textbook value.
- The answer should be quoted to the same precision as the calibration (e.g. two significant figures, or to the nearest 0.01%).
Some scientists investigated a possible treatment for controlling blood sugar levels in humans. The scientists measured the effect of an inhibitor found in green tea on the activity of the enzyme sucrase. This enzyme hydrolyses sucrose into glucose and fructose.
The results are shown in Table 1.3.
Table 1.3
| concentration of inhibitor / | percentage inhibition of sucrase |
|---|---|
| 0.50 | 8.0 |
| 1.00 | 27.5 |
| 1.50 | 44.5 |
| 2.00 | 51.0 |
| 2.50 | 52.5 |

Answer
Axes and scale:
- x-axis: concentration of inhibitor / , scale to , labelled at , , , , and (each apart).
- y-axis: percentage inhibition of sucrase, scale to , labelled at , , , , , and (each apart).
Plotted points (small dots inside small circles, or fine crosses):
Join the points with a thin line passing through all five points (a smooth curve, rising steeply at first and then plateauing).
Graph with axes labelled 'concentration of inhibitor / mg cm⁻³' (x) and 'percentage inhibition of sucrase' (y); all five points plotted and joined with a thin line.
Background Concept
When the independent variable is a continuous, measured quantity (concentration of an inhibitor), the appropriate graph is a scatter graph with the points joined by a line. A line graph communicates two things at once: each plotted point is the actual measurement, and the line shows the overall trend. Conventions for an exam-standard line graph are:
- both axes labelled with the quantity and the unit;
- each scale using at least half the grid;
- sensible intervals (e.g. 0.5 on the x-axis, 10 on the y-axis) so that points are easy to read;
- points plotted accurately as small dots inside small circles (or fine crosses) so the exact position is unambiguous;
- a thin, continuous line (straight or smooth curve) joining the points.
Understanding the Question
The candidate is given Table 1.3 (concentration of inhibitor vs. percentage inhibition of sucrase) and asked to plot the data on the grid in Fig. 1.3 and join the points with a line. The graph will be used in (b)(ii) to find the inhibitor concentration that gives 24% inhibition, so accuracy of plotting and labelling is important.
Approach
- Decide which variable goes on which axis. The independent variable (concentration of inhibitor) goes on the x-axis; the dependent variable (percentage inhibition) goes on the y-axis.
- Choose scales that use at least half the grid in both directions and allow easy reading of the data.
- Label the axes with quantity and unit.
- Plot the five points accurately.
- Join them with a thin line that passes through all points (the data are smooth, so a curve is appropriate, not a scatter plot with no line).
Step-by-Step Reasoning
- x-axis: data range to . A scale of to with intervals of uses the full data range. Each on the scale occupies on the grid (so = ). Mark the value every : , , , , , .
- y-axis: data range to %. A scale of to with intervals of uses most of the grid. Each on the scale occupies on the grid. Mark the value every : , , , , , , .
- Plotting (read each point off the table):
- → (low x, low y, near the bottom-left).
- → (between 25 and 30 on the y-axis, half-way up the lower part).
- → (between 40 and 50, just below 45).
- → (just above 50).
- → (just above 50, only slightly higher than the previous point — the curve has plateaued).
- Line: join the points with a thin, continuous line. Because the points rise steeply and then level off, the line is a smooth curve, not a straight one.
Key Takeaways
- A line graph is appropriate when the independent variable is continuous and the data are smooth.
- A well-chosen scale uses at least half the grid and has round, easy-to-read intervals.
- Accuracy of plotting matters because the graph is used to read off values in the next part.
Common Mistakes
- Using an awkward scale (e.g. 0 to 3 on the x-axis with intervals of 0.3, which makes the points hard to read) — the mark scheme requires intervals of at least every 2 cm.
- Swapping the axes (percentage inhibition on the x-axis, concentration on the y-axis).
- Plotting the points with large filled dots or fuzzy marks — the position is then ambiguous and the mark is lost.
- Forgetting to join the points with a line, or joining them with a thick marker that obscures the data.
Things to Be Careful About
- Use a sharp pencil so that points are small and the line is thin.
- Each axis must be labelled with the quantity and unit (e.g. 'concentration of inhibitor / mg cm⁻³', not just 'inhibitor concentration').
- The intervals on each scale must be such that at least every other major gridline is labelled (i.e. at least one label every 2 cm).
Draw two lines on your graph in Fig. 1.3 to show the concentration of inhibitor that causes 24% inhibition of sucrase.
Answer
On the graph in Fig. 1.3:
- From 24% on the y-axis, draw a horizontal line across to the curve.
- From the point where this horizontal line meets the curve, draw a vertical line down to the x-axis.
- Read the value on the x-axis at this point.
(Reading from the candidate's graph: approximately .)
Approximately (read from the candidate's graph using horizontal and vertical intercepts).
Background Concept
To find an unknown x-value corresponding to a known y-value on a graph, draw a horizontal line from the y-value to the curve, then drop a vertical line from the intersection down to the x-axis. The point where the vertical line meets the x-axis is the x-value that produces the given y-value. This is essentially reading the graph 'backwards' (interpolation) — the same operation as drawing a line of best fit and reading off a value, but using a specific horizontal level.
Understanding the Question
The candidate is asked to use their completed graph from (b)(i) to find the concentration of inhibitor that produces 24% inhibition of sucrase. The instruction is to draw two lines on the graph to show this.
Approach
- Mark 24% on the y-axis (just below the 25% mark, between 20 and 30).
- Draw a horizontal line rightwards from this point until it meets the curve.
- From the meeting point, draw a vertical line downwards until it meets the x-axis.
- Read the value on the x-axis.
Step-by-Step Reasoning
- The curve in (b)(i) passes through (0.50, 8.0) and (1.00, 27.5). 24% lies between these two points, so the corresponding inhibitor concentration lies between and , closer to than to .
- By linear interpolation:
- On the candidate's graph the read-off should give a value close to . The mark scheme awards the mark for showing both intercepts: one horizontal line from the y-axis to the curve, and one vertical line from the curve down to the x-axis. The numerical answer depends on the candidate's own line and is not required for the mark — but the read-off value is reported in (b)(ii) for context.
Key Takeaways
- 'Draw two lines' on a graph means a horizontal line at the given y-value to the curve, then a vertical line down to the x-axis.
- The numerical answer is whatever the candidate reads off their own graph; small differences from the expected value are acceptable as long as the lines are drawn correctly.
Common Mistakes
- Drawing only one line (e.g. only the horizontal one) — the mark scheme requires both.
- Drawing the vertical line to the wrong x-axis value (e.g. dropping it from the y-axis rather than from the curve).
- Not labelling the answer on the x-axis.
Things to Be Careful About
- Use a sharp pencil and a ruler for the two lines so they are clearly visible.
- The lines should meet the curve at a single point — not cross it, not stop short of it.
Answer
Binding / structural idea (one mark):
- The inhibitor binds to the active site of the enzyme (or to an allosteric site).
- This changes the shape of the active site.
Functional consequence (one mark):
- The substrate (sucrose) can no longer bind to the active site, so the formation of enzyme–substrate complexes is prevented (or reduced).
Inhibitor binds to the active site (or allosteric site), changing its shape so sucrose can no longer bind, reducing the number of enzyme–substrate complexes.
Background Concept
Enzyme inhibitors are molecules that reduce the activity of an enzyme. There are two main classes:
- Competitive inhibitors bind to the active site, directly competing with the substrate.
- Non-competitive (allosteric) inhibitors bind to a different site, changing the shape of the active site so that the substrate can no longer bind effectively.
In both cases, the number of productive enzyme–substrate complexes formed per unit time falls, and so the rate of reaction falls.
Understanding the Question
The candidate is asked to suggest how the inhibitor found in green tea reduces the activity of sucrase. This is an open question — the candidate is not told whether the inhibitor is competitive or non-competitive — but any plausible mechanism that links the inhibitor to the active site and to the reduction in enzyme–substrate complexes scores the marks.
Approach
The mark scheme accepts any one of the following structural ideas:
- the inhibitor binds to the active site, OR
- the inhibitor binds to an allosteric site.
And any one of the following functional consequences:
- the substrate can no longer bind, OR
- the number of enzyme–substrate complexes is reduced.
Step-by-Step Reasoning
- The inhibitor is a foreign molecule that interacts with the enzyme (sucrase). The simplest explanation is that it binds to the active site, blocking access to the substrate (sucrose).
- Alternatively, it could bind elsewhere on the enzyme and change the tertiary structure, distorting the active site so that sucrose no longer fits.
- In either case, the substrate cannot form a productive enzyme–substrate complex, so the rate of hydrolysis of sucrose falls.
- Either structural idea is acceptable; either functional consequence is acceptable. Two marks total — one for structure, one for consequence.
Key Takeaways
- 'Suggest' questions do not require proof, only a plausible mechanism.
- The two marks correspond to two distinct ideas: a binding/shape idea, and a functional consequence for the substrate.
- 'Active site' is the key phrase — vague descriptions like 'the enzyme is blocked' do not earn the mark.
Common Mistakes
- Saying only that 'the enzyme is denatured' — this is incorrect here because the inhibitor is not changing the primary sequence or fully unfolding the enzyme; it is specifically interfering with the active site.
- Stating only the consequence ('substrate cannot bind') without the structural reason ('binds to the active site').
- Stating only the structure without the consequence.
Things to Be Careful About
- The mark scheme requires both halves: where the inhibitor binds (or what it changes) AND what effect this has on the substrate / enzyme–substrate complexes.
- The term 'active site' is the key term — use it precisely.
The scientists calculated the percentage inhibition of sucrase by measuring the concentration of reducing sugars in the solution after 5 minutes.
Describe how the scientists could determine the concentration of reducing sugars in the solution.
Answer
- Prepare a series of solutions of known concentrations of a reducing sugar (e.g. glucose).
- Add Benedict's solution to each known concentration and to the sample; heat to at least (e.g. in a water bath).
- Compare the time taken for the colour change (or the intensity of the final colour) in the sample to those of the known concentrations; the concentration of reducing sugar in the sample is the one that gives the closest match.
Prepare known concentrations of reducing sugar, test each (and the sample) with Benedict's solution at ≥80 °C, and compare the time / colour to the standards.
Background Concept
Benedict's test detects reducing sugars. A reducing sugar has a free aldehyde or ketone group that can reduce the blue copper(II) ions in Benedict's reagent to a red/orange precipitate of copper(I) oxide. The colour produced is correlated with the concentration of reducing sugar: more reducing sugar → more precipitate → a more orange/red end colour.
Benedict's reagent only works above about , so the mixture must be heated, typically in a water bath.
To make the test quantitative (i.e. to determine the concentration rather than just whether a reducing sugar is present), the colour produced by the sample is compared with the colours produced by a series of standards of known concentration, prepared in advance. This is a simple colorimetric calibration.
Understanding the Question
The question is set in the context of the experiment described in (b), where the scientists measured the percentage inhibition of sucrase by measuring the concentration of reducing sugars in the solution after 5 minutes. The question asks the candidate to describe how the scientists could determine the concentration of reducing sugars in the solution.
The mark scheme awards three marks for three ideas:
- Preparing a series of known concentrations of reducing sugar.
- Testing these (and the sample) with Benedict's solution and heating to at least .
- Comparing the result for the sample to the standards, either by the time taken to change colour or by the final colour intensity.
Approach
The classic way to make the Benedict's test quantitative is to use a set of standards. The candidate should describe the three steps: prepare standards, run the test on standards and sample under identical conditions, then compare.
Step-by-Step Reasoning
- Standards: prepare, for example, five or six solutions of glucose at known concentrations spanning the expected range of the sample (e.g. , , , , and ).
- Benedict's test: add a fixed volume of Benedict's reagent to a fixed volume of each standard and to the sample, place all tubes in a water bath at (or boiling) for a fixed time, and record either (a) the time taken for the first appearance of the orange/red colour, or (b) the intensity of the final colour (which can be quantified with a colorimeter if available, or judged by eye against the standards).
- Comparison: identify the standard whose time (or colour intensity) most closely matches the sample. The concentration of reducing sugar in the sample is taken to be that of the matching standard.
The mark scheme explicitly allows either the time-to-colour-change or the final-colour comparison. The heating temperature must be at least to drive the Benedict's reaction.
Key Takeaways
- The Benedict's test can be made quantitative by using a calibration set of standards.
- The comparison can be by time or by colour intensity — both are accepted.
- All tubes (standards and samples) must be treated identically so that the comparison is valid.
Common Mistakes
- Saying only 'do a Benedict's test' without mentioning the standards or the comparison.
- Failing to mention heating to at least (a common omission, because candidates forget that Benedict's needs heat to work).
- Describing a method that uses a single standard rather than a series of standards — this does not allow interpolation and is much less accurate.
- Confusing Benedict's (reducing sugars) with the iodine test (starch) or with Biuret (protein).
Things to Be Careful About
- The question is about the reducing sugars produced by the enzyme, so the sugar is glucose (and fructose, which is also a reducing sugar but is usually ignored in this test).
- A 'calibration curve' is the more sophisticated version of this approach: plot the colour intensity (or time) against the standard concentration, and read off the concentration of the sample from the curve. The mark scheme's wording is flexible enough to accept either approach.
- The minimum heating temperature is (or 'boiling'); simply leaving the tubes at room temperature is incorrect.
M1 is a slide of a stained transverse section through a leaf.
Draw a large plan diagram of the region of the leaf on M1 indicated by the shaded area in Fig. 2.1. Use a sharp pencil.
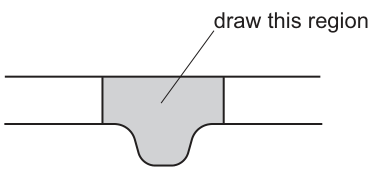
Use one ruled label line and label to identify the lower epidermis.
No worked solution for this part yet — the official mark scheme is linked at the top of the page.
Observe the xylem vessel elements in the leaf on M1.
Select a line of four adjacent xylem vessel elements.
Each xylem vessel element must touch at least one other xylem vessel element.
- Make a large drawing of this line of four xylem vessel elements.
- Use one ruled label line and label to identify the wall of one xylem vessel element.
No worked solution for this part yet — the official mark scheme is linked at the top of the page.
Fig. 2.2 shows a photomicrograph of a transverse section through a different leaf from that on M1.
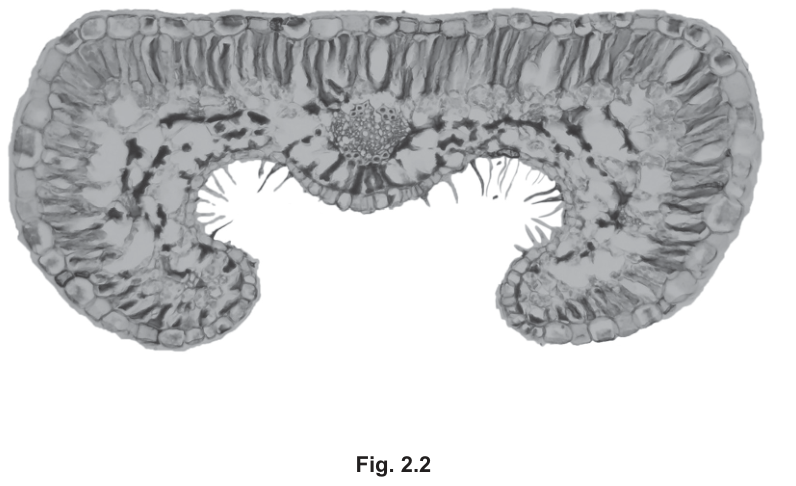
Identify three observable differences, other than colour, between the section on M1 and the section in Fig. 2.2.
Record these three observable differences in Table 2.1.
Table 2.1
| feature | M1 | Fig. 2.2 |
|---|---|---|
No worked solution for this part yet — the official mark scheme is linked at the top of the page.
Fig. 2.3 is the same photomicrograph as that shown in Fig. 2.2.
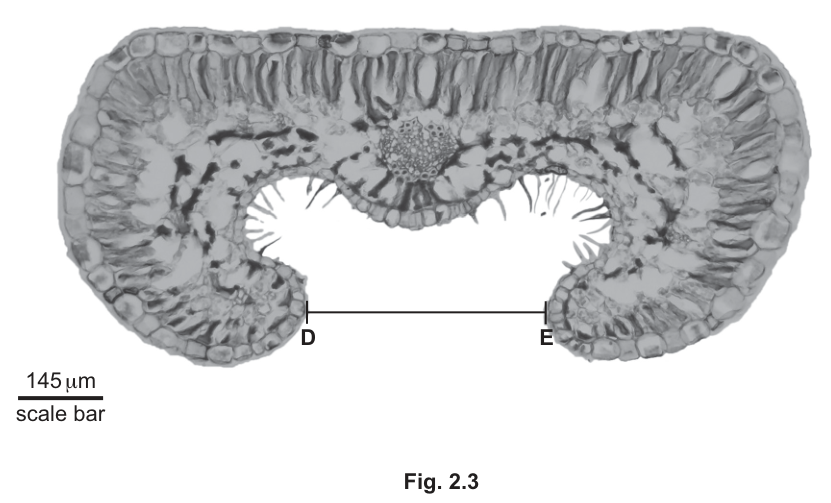
Use the scale bar on Fig. 2.3 and the line D–E to calculate the actual length of the gap between the ends of the leaf.
Show your working, including units and give your answer in micrometres (µm).
actual length of gap = ______
No worked solution for this part yet — the official mark scheme is linked at the top of the page.