Biology 9700/33 — May/June 2025
Cambridge AS Level · Advanced Practical Skills · worked solutions for every part, with the mark scheme
Topics Manipulation, Measurement and Observation · Presentation of Data and Observations · Analysis, Conclusions and Evaluation · Use of the Light Microscope
When plant tissue is placed into a solution of sodium chloride, water moves between the sodium chloride solution and the cells in the plant tissue.
You will investigate the effect of surface area of plant tissue on the movement of water between a sodium chloride solution and the cells in a sample of plant tissue.
You are provided with the materials shown in Table 1.1.
Table 1.1
| labelled | contents | hazard | volume / |
|---|---|---|---|
| P | 5 cylinders of plant tissue in distilled water | none | – |
| S | sodium chloride solution | none | 200 |
It is recommended that you wear suitable eye protection.
You will need to:
- cut cylinders of plant tissue into different lengths
- soak different lengths of plant tissue in sodium chloride solution for 20 minutes
- measure the final length of the plant tissue.
Carry out step 1 to step 12.
- step 1 Using the forceps, put the cylinders of plant tissue onto the white tile.
- step 2 Cut each cylinder of plant tissue to length.
The cylinders of plant tissue all have the same diameter, as shown in Fig. 1.1. The radius is calculated by dividing the diameter by 2.
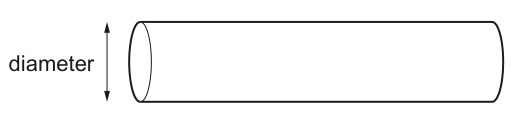
Measure the diameter of one cylinder of plant tissue and calculate the radius, .
= ______
= ______
Answer
(representative value; candidate's own measurement)
diameter = 5 mm; r = 2.5 mm
Background Concept
The plant tissue cylinders used in this investigation are produced by pushing a cork borer through a piece of potato (or other suitable tissue). Each cylinder therefore has a fixed diameter (the distance across the circular cross-section) and a chosen length (the distance along the cylinder's axis). To work out the surface area of a cylinder we need its radius (), which is simply half the diameter:
The radius will be used later, in part (a)(iii), to calculate the surface area of one cylinder using the formula given in Fig. 1.2.
Understanding the Question
This part asks you to make a single measurement (the diameter of the cylinder) and to use it to find the radius. The measurement must be quoted with a sensible unit (mm or cm) and the radius must follow directly from the diameter. There is no one correct value — it depends on the actual cylinder you have been given — but whatever diameter you record, the radius must be exactly half of it.
Approach
- Place one cylinder on the white tile and use a ruler (read to the nearest mm) to measure across the circular end.
- Record the diameter with its unit (mm is most convenient here).
- Divide the diameter by 2 to obtain the radius, and record this with the same unit.
Step-by-Step Reasoning
A typical cork borer used in CIE practicals gives a cylinder of about in diameter. A candidate reading this on a mm ruler would record:
Halving this gives the radius:
Both the diameter and the radius must be stated with the same unit; if you measure in cm, the radius should also be in cm.
Key Takeaways
- The radius is half the diameter, regardless of the actual size of the cylinder.
- The unit you choose for the diameter (mm is conventional here) must be used consistently for the radius.
- The value of obtained here will be used directly in (a)(iii) when calculating the surface area, so any error here propagates through the rest of the question.
Common Mistakes
- Forgetting to include a unit on the diameter or the radius.
- Dividing the wrong way (e.g. doubling the radius to get the diameter).
- Recording the radius to a different number of decimal places than the diameter was measured to (it should be exactly half, not rounded independently).
Things to Be Careful About
- Use a mm ruler, not a cm-only ruler, so you can read to the nearest mm.
- Measure across the widest part of the circular end — the cylinder is short relative to its diameter, so the measurement is easy to misread.
- Carry this radius value forward into (a)(iii) without re-measuring.
To investigate the effect of surface area, you will use one whole cylinder of plant tissue and cut the other cylinders into a different number of pieces.
- step 3 Label five beakers with the number of pieces of plant tissue () as shown in Table 1.2.
Table 1.2
| beaker labelled | number of pieces of plant tissue () | length () of each small piece / |
|---|---|---|
| 1 | 1 | 40 |
| 2 | 2 | 20 |
| 4 | 4 | 10 |
| 8 | 8 | 5 |
| 16 | 16 | 2.5 |
- step 4 Put one whole cylinder of plant tissue into the beaker labelled 1.
- step 5 Cut each of the other four cylinders of plant tissue into the number of pieces shown in Table 1.2 and put them into the appropriately labelled beaker.
In step 6 you will use a syringe to measure the volume of sodium chloride solution, S, you will put into each beaker.
State the volume of S that you will put into each beaker and give a reason for the volume that you have stated.
= ______
reason: ______
Answer
Reason: so that all the cylinders of plant tissue in every beaker are completely submerged (covered by the sodium chloride solution).
20 cm³; so the cylinders of plant tissue are completely submerged
Background Concept
In any experiment where a tissue sample is placed in a solution, the volume of solution must be large enough to ensure that every part of the tissue is in contact with the solution and to give a large enough reservoir of solute so that the concentration around the tissue does not change appreciably as water moves in or out. If part of a cylinder sticks out above the surface, only the submerged portion experiences the experimental conditions — that would be a confounding variable.
Understanding the Question
You are using a syringe to measure out a single volume of sodium chloride solution, S, that you will add to each of the five beakers. The volume you choose must be the same in every beaker (so that volume is not itself a variable) and it must be sufficient to cover the plant tissue in every beaker, including the one containing 16 tiny pieces (beaker 16).
Approach
Pick a volume that:
- is large enough to cover all the tissue in every beaker (especially the single 40 mm cylinder in beaker 1 and the 16 small pieces in beaker 16),
- is small enough to be measured accurately with the syringe provided,
- and is the same in each beaker so that volume is not a variable.
A typical choice with a or syringe is (or if a syringe is available).
Step-by-Step Reasoning
The beakers all have to hold the same volume so that the only variable being changed is the number of pieces (and hence the total surface area). The single 40 mm cylinder in beaker 1 is the longest piece of tissue, so the volume must be sufficient to cover it. Twenty of solution in a standard or beaker gives a depth of at least above the tissue, easily covering all the cylinders including the one. Using a syringe allows you to deliver the same volume accurately to every beaker, so the volume is standardised.
Key Takeaways
- Any controlled variable in an experiment must be kept the same across all treatments — the volume of solution here is one such variable.
- The volume must be enough to cover the tissue so that the entire surface of every cylinder is in contact with the NaCl solution.
- The reason is what earns the mark, not the exact number — any reasonable volume with the correct justification scores.
Common Mistakes
- Stating a volume but giving a vague reason (e.g. "to make the experiment fair" — too vague; "so the cylinders are covered" is the accepted wording).
- Choosing a volume that is too small to submerge the tissue, or so large that it cannot be measured with the syringe available.
- Using a different volume in different beakers, which would make volume an unwanted variable.
Things to Be Careful About
- A syringe could deliver in two separate squirts, but that introduces timing/measurement variation — better to use a single delivery if possible.
- The reason should explicitly mention submersion or complete covering of the cylinders.
step 6 Put the volume of S you stated in (a)(ii) into each of the beakers.
step 7 Start timing and wait for 20 minutes.
Use this time to continue with other parts of Question 1.
Fig. 1.2 shows an example of how to calculate the total surface area of plant tissue placed in each beaker.
EXAMPLE: a cylinder with a length of
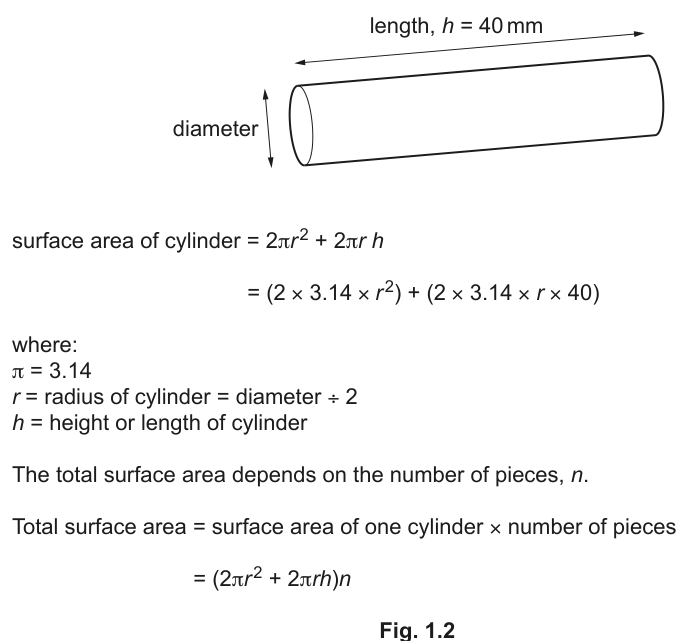
Complete Table 1.3 by calculating the total surface area of the whole piece of plant tissue (1) and the total surface area for the plant tissue cut into 16 pieces. Use the formulae shown in Fig. 1.2.
Show your working in Table 1.3.
Table 1.3
| / | surface area of one piece / | total surface area / | |
|---|---|---|---|
| 1 | 40 | ||
| 16 | 2.5 |
Working
Using from (a)(i) and :
For , :
For , :
Answer
| surface area of one piece / | total surface area / | ||
|---|---|---|---|
| 1 | 40 | ||
| 16 | 2.5 |
n=1: total surface area = 667.25 mm²; n=16: total surface area = 1256 mm² (using r = 2.5 mm)
Background Concept
The surface area of a cylinder has two contributions: the two circular ends ( in total) and the curved side (, the circumference multiplied by the length). Adding these gives:
When identical cylinders are used, the total surface area is simply times the surface area of one cylinder. Because cutting a cylinder into equal pieces also changes the length of each piece, the surface area of one piece and the number of pieces both change, and the effect on the total is not obvious from looking at the formula alone — it must be calculated.
Understanding the Question
You are given a formula in Fig. 1.2 and asked to use it to fill in two rows of Table 1.3:
- one row for , (the whole cylinder),
- one row for , (the cylinder cut into 16 equal pieces).
You must show your working in the table itself for both the surface area of one piece and the total surface area. Your answer will use the radius you measured in (a)(i); a representative value of (from a diameter of ) is used below.
Approach
For each row:
- Substitute and into with .
- Evaluate the two terms and add them to get the surface area of one piece.
- Multiply the surface area of one piece by to get the total surface area.
Show each calculation in the appropriate cell of the table.
Step-by-Step Reasoning
Using and :
When , :
Total surface area = .
When , :
Total surface area = .
So although each individual piece is much smaller than the original cylinder, there are 16 of them and the total surface area is roughly double that of the single 40 mm cylinder. This is the key biological insight: cutting tissue into smaller pieces increases its total surface area exposed to the surrounding solution.
Key Takeaways
- The formula gives the surface area of one cylinder; the total is this value multiplied by .
- Cutting a cylinder into smaller pieces increases the total surface area, even though the volume stays the same (this is the basis of the experiment).
- The working must be visible in the table, not just a final number.
Common Mistakes
- Forgetting to multiply by for the total surface area.
- Using the wrong value of (e.g. using for the row instead of ).
- Squaring the wrong number in (it is that is squared, not as a whole).
- Omitting the working in the table, which is explicitly required by the mark scheme.
- Mixing up the units (the formula gives an answer in because and are in mm; do not write unless you converted first).
Things to Be Careful About
- The radius you measured in (a)(i) is carried forward here; use that exact value (e.g. if , ).
- The value of to use is given as in Fig. 1.2 — do not use the calculator's key (the question wants a consistent working value).
- Show each step in the table cells as the mark scheme requires; the working is part of the answer.
Describe what happens to the total surface area when one whole cylinder of plant tissue is cut into 16 smaller pieces.
Answer
The total surface area increases when the whole cylinder is cut into 16 smaller pieces.
increases
Background Concept
When a solid object is divided into smaller pieces, the total external surface exposed to the surroundings increases even though the total volume of material stays the same. This is a general geometric fact: the smaller the piece, the larger its surface area to volume ratio, and the more cuts you make, the more new surfaces you create. In biology this is critical because many processes (diffusion, osmosis, heat loss, evaporation) depend on the surface area available.
Understanding the Question
This part asks you to compare the two total surface areas you have just calculated in (a)(iii):
- (one whole cylinder): total surface area = (representative)
- (16 small pieces): total surface area = (representative)
You are asked to state, in one or two words, what happens to the total surface area as a result of cutting.
Approach
Compare the two numerical values: the value for is larger than the value for . State this as a single-word trend.
Step-by-Step Reasoning
The total surface area for () is greater than that for () — approximately double. The trend is therefore an increase. The volume of plant material is unchanged (it is still one whole cylinder's worth of tissue, just cut up), but more surface is exposed to the solution.
Key Takeaways
- Cutting a solid into smaller pieces increases its total surface area (and hence its surface area to volume ratio).
- This is the key independent variable in the experiment: the more pieces, the larger the total surface area exposed to the sodium chloride solution.
Common Mistakes
- Saying the total surface area "stays the same" because the volume of tissue is the same — the volume is the same, but the surface area is not.
- Describing the change as "decreases" (the opposite of what happens).
- Giving a numerical comparison without using the word that describes the trend (the mark scheme awards the trend word).
Things to Be Careful About
- This part is independent of the actual numerical values you obtained — even with a different measured radius, the trend is always an increase.
- Keep the answer to a single short word or phrase; the mark is for stating the direction of change.
step 8 After the 20 minutes (step 7), pour the sodium chloride solution from around the cylinder of plant tissue in beaker 1 into the container labelled For waste. Put the plant tissue onto the white tile.
step 9 Measure the length of the cylinder of plant tissue. Record this length in (a)(v).
step 10 Repeat step 8 for beaker 2.
step 11 Place the cylinders of plant tissue end-to-end so that they are touching. Measure their total length, as shown in Fig. 1.3. Record this length in (a)(v).
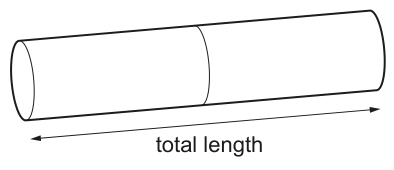
step 12 Repeat step 10 and step 11 using the plant tissue in beaker 4, beaker 8 and beaker 16.
Record your results in an appropriate table.
Answer
| number of pieces of plant tissue () | total length / |
|---|---|
| 1 | 39 |
| 2 | 38 |
| 4 | 36 |
| 8 | 34 |
| 16 | 32 |
(Representative candidate data showing the expected trend: as the number of pieces increases, the total length decreases. Actual values are student-dependent. Results are recorded to the nearest whole mm.)
See working — table of results (values are student-dependent but must show the expected trend of decreasing total length as n increases)
Background Concept
A well-drawn results table in a biology practical must have:
- a heading for every column, including the quantity and a unit (e.g. "total length / mm");
- the independent variable to the left of the dependent variable;
- a row for every treatment;
- values recorded to a precision consistent with the measuring instrument (here, to the nearest whole mm because the ruler reads mm);
- a clear, expected trend (here, the total length should fall as rises, because more pieces means more surface area and therefore more water loss to the concentrated NaCl solution).
The 5 beakers correspond to and pieces. After 20 minutes in NaCl (a strongly hypertonic solution), the plant cells lose water by osmosis and the tissue shrinks. The more pieces there are, the greater the total surface area in contact with the solution, and the more water is lost overall — so the total length should fall as rises.
Understanding the Question
After the 20-minute soak, the candidate measures the total length of the tissue in each beaker:
- beaker 1 (): measure the single 40 mm cylinder directly;
- beakers 2, 4, 8 and 16: place the pieces end-to-end and measure the total length (as shown in Fig. 1.3).
These results must be recorded in a table with the correct conventions.
Approach
- Decide on the two column headings: number of pieces (the IV) and total length (the DV).
- Make sure the IV column is on the left of the DV column.
- Include the unit in the DV heading only (the IV is a count, so no unit is needed).
- Fill in the five rows of data, reading each length to the nearest mm.
- Check that the trend across the rows is sensible (length should fall as rises).
Step-by-Step Reasoning
Because the 20-minute soak takes place in NaCl — a solution with a much lower (more negative) water potential than the plant cells — water leaves the cells by osmosis. The cells become flaccid, the tissue as a whole loses turgor, and the cylinders shrink slightly in length.
The single cylinder () has the smallest surface area exposed to the solution, so it loses the least water overall and remains closest to its original length. As increases, the total surface area exposed rises (as calculated in (a)(iii) and (a)(iv)), so more water is lost and the total length falls. The expected trend is therefore: length decreases as the number of pieces increases.
Representative values that follow this trend and would score the marks:
| total length / mm | |
|---|---|
| 1 | 39 |
| 2 | 38 |
| 4 | 36 |
| 8 | 34 |
| 16 | 32 |
The IV heading ("number of pieces of plant tissue ()") is on the left; the DV heading ("total length / mm") is on the right and includes its unit. All five values are present, recorded in whole mm, and they decrease as increases.
Key Takeaways
- In any results table the IV goes to the left of the DV, and every measured quantity must have a unit in its heading.
- The expected biological trend is that more pieces (more total surface area) means more water loss and therefore a shorter total length after soaking in a hypertonic solution.
- The candidate's own results may differ in absolute value, but the trend must be the same.
Common Mistakes
- Putting the dependent variable to the left of the independent variable.
- Writing the unit separately in each cell of the table (e.g. "39 mm") instead of once in the heading.
- Recording values with unnecessary decimal places (e.g. "38.5 mm") when the ruler only reads to the nearest mm.
- Omitting a row or recording the values in the wrong order.
- Recording a trend that contradicts the biology (e.g. the length increasing with more pieces).
Things to Be Careful About
- Use the same ruler throughout to avoid systematic error between beakers.
- For the multi-piece beakers, line the cylinders up as carefully as possible (see (a)(viii) for the limitation of this step).
- The exact values will depend on the tissue and the soaking time; the mark scheme is looking for the trend and the conventions, not a specific number.
Answer
As the total surface area of the plant tissue increases (i.e. as the number of pieces increases), the total length of the plant tissue decreases.
as the total surface area increases, the total length decreases
Background Concept
A trend in a results table is the way one variable changes as another is changed. The two variables here are:
- the total surface area of the plant tissue (which rises as rises — see (a)(iii) and (a)(iv));
- the total length of the plant tissue after soaking (which the candidate has just measured).
The mark scheme wants a statement that links these two variables: as one goes up, what happens to the other?
Understanding the Question
This part asks you to describe the trend in your own results, in terms of total surface area and total length. Because the actual length values are student-dependent, the description must be consistent with the candidate's own table — but the expected biological trend is unambiguous.
Approach
Look at the values in the second column of the results table from (a)(v). Note whether they rise, fall or stay the same as you move down the table (i.e. as — and therefore total surface area — increases). Write a single sentence that names both variables and the direction of change.
Step-by-Step Reasoning
From the calculations in (a)(iii), the total surface area rises from at to at . From the results in (a)(v), the total length falls (e.g. from 39 mm at to 32 mm at in the representative data). The trend is therefore: as total surface area increases, total length decreases.
Key Takeaways
- A trend is a one-line description that names the two variables and the direction of change in one of them.
- The trend is consistent with the underlying biology: more surface area means more osmosis per unit time, so more water loss and more shrinkage.
Common Mistakes
- Describing the trend in terms of "number of pieces" rather than "total surface area" — the question specifically asks for a reference to surface area.
- Stating the trend in the wrong direction (e.g. "as surface area increases, length increases") — this is biologically incorrect for this experiment.
- Being vague: "the results show a pattern" or "there is a relationship" do not score; the direction must be stated.
Things to Be Careful About
- Describe the trend in the candidate's own results, not the idealised answer — the mark scheme is "according to the candidates' results".
- Reference total surface area, not just "surface area" or "number of pieces", to score the mark.
Answer
Any two from:
- As the number of pieces increases, the total surface area in contact with the sodium chloride solution increases.
- Cutting the tissue into smaller pieces increases the surface area to volume ratio.
- There is a shorter diffusion distance for water between the sodium chloride solution and the cells in the middle of each piece of tissue.
Therefore more water leaves the cells by osmosis in the 20-minute soak, and the tissue shrinks more, giving a shorter total length.
increased total surface area in contact with the solution; increased surface area to volume ratio / shorter diffusion distance to cells in the middle of each piece
Background Concept
Three linked ideas explain why a more subdivided tissue loses water faster:
- Total surface area: more pieces means more cylinder surfaces exposed to the solution. The more surface in contact with the NaCl, the faster water can leave the cells by osmosis.
- Surface area to volume ratio: a smaller cylinder has a higher SA:V ratio than a large one, so for a given volume of tissue, more cell membrane is in contact with the solution. This is a general rule — small objects have high SA:V ratios, large objects have low ones.
- Diffusion distance: in a long, thick cylinder, water has to travel further to reach the cells in the very middle. Cutting the cylinder into short pieces means every cell is close to a surface, so the path water must take (or water vapour must take out) is short.
All three are alternative ways of saying the same thing: cutting tissue into smaller pieces speeds up exchange with the surroundings. In this experiment, that means a faster net loss of water to the hypertonic NaCl solution, and a greater shrinkage of the tissue in the 20 minutes.
Understanding the Question
You have just described the trend in (a)(vi). The question now asks you to explain it biologically — to say why total length falls as total surface area rises. The mark scheme allows any two of the three ideas above.
Approach
Pick the two clearest points. The simplest and most often credited are:
- the increase in total surface area in contact with the solution, and
- the shorter diffusion distance to the cells in the middle of the smaller pieces.
Use the term "osmosis" or "diffusion distance" to make the biology explicit; do not just say "the water moves out faster".
Step-by-Step Reasoning
When one cylinder is cut into 16 small pieces, two things change at once:
- the total surface area in contact with the solution roughly doubles (calculated in (a)(iii));
- the distance from the outside surface to the centre of each piece is much smaller, so water reaches the innermost cells more quickly.
Both changes increase the rate at which water leaves the cells by osmosis into the NaCl (which has a much lower, more negative water potential than the cells). Over the fixed 20-minute soaking time, more water leaves the cells of the 16-piece sample, so the cells become more flaccid and the cylinders shrink more — the total length is shorter.
Key Takeaways
- Total surface area, surface area to volume ratio and diffusion distance are three ways of expressing the same biological principle: small things exchange materials with their surroundings faster than large things.
- The 20-minute soak is a fixed time, so any factor that increases the rate of water loss produces a larger shrinkage by the end of the soak.
Common Mistakes
- Restating the trend ("because there is more surface area") without explaining the consequence (more osmosis, more water loss, more shrinkage).
- Saying the water "moves out faster" without naming osmosis or diffusion distance.
- Forgetting the biology: the NaCl solution has a lower (more negative) water potential than the cells, so water leaves the cells — the tissue does not just "lose water" for no reason.
- Naming only one of the three points; the mark scheme asks for two.
Things to Be Careful About
- "Surface area to volume ratio" is the precise term — "surface area to volume" alone is not enough; include the word "ratio".
- "Diffusion distance" or "shorter pathway for water/osmosis" is the precise wording — "the water has less far to go" is too informal.
- The cells in the middle of the tissue are the ones that lose water last in a long cylinder; this is the point of cutting — bringing those cells closer to the surface.
State one source of error in this investigation when measuring the dependent variable in step 11 and step 12.
Answer
When lining up the pieces end-to-end (step 11 and step 12) it is difficult to get them perfectly straight and touching, so there are gaps between the cylinders and the total length measured is not accurate.
lining up the cylinders end-to-end is difficult because there are gaps between them and they are not straight
Background Concept
A source of error in a practical is anything that makes the measured value of the dependent variable different from the true value. It is distinct from a random uncertainty (which produces scatter around the true value): a source of error describes where the inaccuracy comes from. For length measurements made with a ruler, the main sources of error are:
- the precision of the ruler (here, 1 mm);
- parallax when reading the scale;
- difficulty in placing the object exactly at the zero of the ruler;
- difficulty in keeping multiple pieces in a line when measuring a total length.
The mark scheme for this part points specifically at the lining-up step, which is the most awkward part of the procedure.
Understanding the Question
You are asked to name one source of error specifically in step 11 and step 12, where the candidate places the pieces of plant tissue from beakers 2, 4, 8 and 16 end-to-end and measures their total length with a ruler. The error must be something that affects this measurement in particular.
Approach
Look at what is hard about putting 2, 4, 8 or 16 short cylinders end-to-end on a white tile. They are curved, slippery, and not perfectly straight after the soak. Any gap or angle between two pieces adds uncertainty to the total length. The mark scheme awards the answer that names this difficulty.
Step-by-Step Reasoning
In step 11, the candidate lines up the pieces in beaker 2 (two 20 mm pieces), and in step 12 the same for 4, 8 and 16 pieces. Each piece is a small cylinder, and the pieces are wet and slightly bent. Trying to:
- place them in an exact straight line,
- ensure the end of one piece touches the start of the next with no gap,
- keep them all still while the ruler is read,
is mechanically difficult. Any small gap between two pieces adds a few mm to the total length, or any bend out of the straight line makes the total length longer than it should be. So the measured total length has a systematic positive error: it tends to be longer than the true total length.
The mark scheme phrasing is: "exactly lining up cylinders is difficult as there will be gaps between them and they are not straight".
Key Takeaways
- A source of error must be specific to the measurement being made; vague answers like "human error" or "the experiment wasn't accurate" do not score.
- The lining-up step is the most error-prone part of this procedure because the pieces are short, wet and curved.
Common Mistakes
- Naming a generic error (e.g. "measurement error", "the ruler wasn't accurate") without linking it to the lining-up step.
- Naming a source of error from a different part of the procedure (e.g. evaporation of the NaCl solution, the NaCl concentration being wrong) — the question specifies step 11 and 12.
- Suggesting an improvement instead of an error (the improvement belongs in a different part).
- Saying the error is "reading the ruler wrongly" without explaining why it is hard to read (the pieces are not in a straight line).
Things to Be Careful About
- Name the error in terms of the procedure, not the person ("the pieces don't line up" is good; "the experimenter wasn't careful" is not).
- "Gaps between the cylinders" and "they are not straight" are the two specific features the mark scheme accepts; either is sufficient on its own.
Suggest how you could modify this procedure to investigate the effect of temperature on the movement of water between the sodium chloride solution and the cells in the plant tissue.
Answer
To investigate the effect of temperature on the movement of water between the sodium chloride solution and the cells in the plant tissue:
- Use the same surface area (i.e. one length of plant tissue — e.g. one whole 40 mm cylinder) in every beaker.
- Use five different temperatures of the sodium chloride solution (e.g. 10, 20, 30, 40 and 50 °C), keeping everything else the same.
use the same surface area / one length of plant tissue; use five different temperatures
Background Concept
To change the independent variable of an investigation, you vary one factor and keep all the others the same. Here, the question asks you to redesign the experiment so that temperature is the independent variable. Two things must be true of any redesigned experiment:
- the new IV (temperature) must be varied across at least five values so a trend can be seen;
- every other variable that could affect the rate of water movement must be kept constant — in particular, the total surface area of the tissue, the concentration of NaCl, the volume of solution and the soaking time.
This question asks for two specific modifications; the mark scheme awards one mark for "use the same surface area / one length of plant tissue" and one mark for "use five different temperatures".
Understanding the Question
You are asked how to modify the existing procedure so that the experiment now tests the effect of temperature instead of surface area. The mark scheme is looking for two clear, distinct changes:
- Standardise the tissue so that surface area is no longer the variable (and is therefore controlled).
- Vary the temperature across at least five values.
Approach
- Decide what stays the same: the same plant tissue (so that surface area is constant) and the same NaCl concentration, volume, soaking time, etc.
- Decide what changes: the temperature of the NaCl solution, varied across at least five values spread across a sensible range (e.g. 10, 20, 30, 40, 50 °C).
Step-by-Step Reasoning
The original experiment varied the number of pieces (i.e. the total surface area) while keeping temperature, concentration, volume and time constant. To swap the IV to temperature:
- The tissue must no longer be cut into different numbers of pieces — otherwise both total surface area and temperature would vary, and the effect of temperature could not be isolated. So you use one whole 40 mm cylinder in every beaker, or alternatively one piece of the same size (e.g. one 5 mm piece), keeping the surface area the same.
- The temperature must be varied systematically. CIE convention is at least five values across a sensible range. A water bath set to each chosen temperature is the standard way to control this.
- Everything else (NaCl concentration, volume, soaking time) stays the same as in the original procedure.
The dependent variable remains the change in length of the cylinder after 20 minutes, measured the same way as in steps 8–12 of the original procedure.
Key Takeaways
- Changing the IV means varying exactly one thing and keeping everything else constant.
- A minimum of five values is needed to establish a trend (rather than a simple comparison).
- Standardising the surface area is essential here, otherwise the temperature effect would be confounded with a surface area effect.
Common Mistakes
- Suggesting a different concentration of NaCl (this would change the water potential gradient, not the temperature effect).
- Suggesting only one or two temperatures — the mark scheme wants at least five values.
- Failing to standardise the tissue (e.g. still cutting into pieces) — the surface area must be the same in every beaker.
- Vague wording such as "change the temperature" without saying how many values or across what range.
- Forgetting that all the other variables (concentration, volume, time) must be kept the same.
Things to Be Careful About
- The phrase "the same surface area" or "one length of plant tissue" is the precise wording the mark scheme accepts.
- "Five different temperatures" must be explicit; "different temperatures" alone is not enough.
- A sensible temperature range (e.g. 10–50 °C, with a 20 °C control) is implied; the mark does not require specific values but they should be biologically reasonable.
A student investigated the effect of different concentrations of sodium chloride solution on red blood cells.
The student:
- counted the number of whole red blood cells in six samples of blood
- put each sample into a different concentration of sodium chloride solution for 10 minutes
- counted the number of whole red blood cells remaining in each concentration
- calculated the number of red blood cells remaining as a percentage of the number of red blood cells in each sample at the start.
The results are shown in Table 1.4.
Table 1.4
| percentage concentration of sodium chloride | percentage number of whole red blood cells remaining |
|---|---|
| 0.00 | 0.0 |
| 0.40 | 3.0 |
| 0.50 | 10.0 |
| 0.65 | 46.0 |
| 0.80 | 96.0 |
| 0.90 | 100.0 |
Plot a graph of the data shown in Table 1.4 on the grid in Fig. 1.4.
Use a sharp pencil.
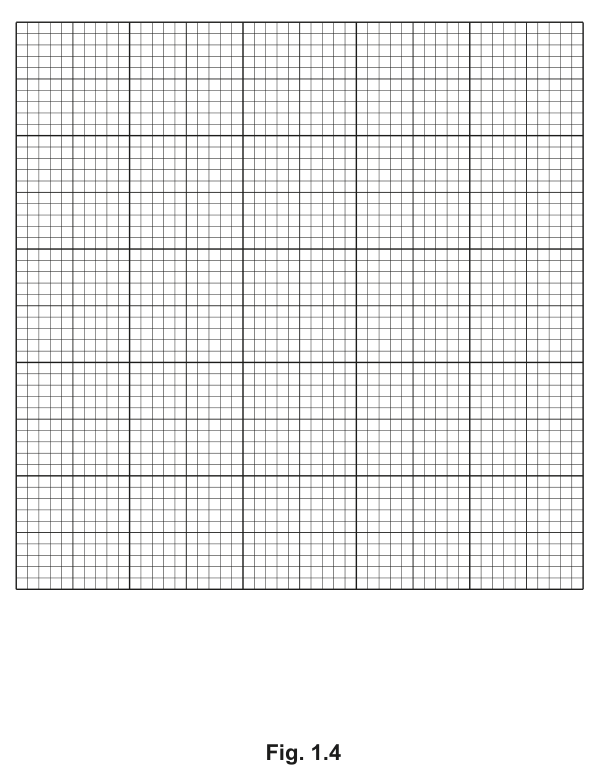
Answer
Plot the six points from Table 1.4 on the grid in Fig. 1.4:
| concentration of NaCl (%) | % RBCs remaining |
|---|---|
| 0.00 | 0 |
| 0.40 | 3 |
| 0.50 | 10 |
| 0.65 | 46 |
| 0.80 | 96 |
| 0.90 | 100 |
- X-axis label: percentage concentration of sodium chloride (scale 0 to 1.0, labelled every 0.2)
- Y-axis label: percentage number of whole red blood cells remaining (scale 0 to 100, labelled every 20)
- Plot each point as a small dot in a circle (or a small cross) using a sharp pencil.
- Join the six plots with a thin line that passes through all six points.
See working — six points plotted and joined with a thin line through all points
Background Concept
A line graph is the right way to display data where one variable (the independent variable, on the x-axis) is continuous and the other (the dependent variable, on the y-axis) has been measured at each value of the independent variable. The convention for plotting is:
- the IV goes on the x-axis;
- the DV goes on the y-axis;
- both axes are labelled with the quantity and a unit;
- the scale is chosen so the data fills at least half the grid;
- each point is plotted as a small, precise mark (dot in circle or cross) using a sharp pencil;
- the points are joined with a thin line — either a smooth curve or straight line segments — that passes through (or as close as possible to) every point.
Understanding the Question
You are given a table of data (Table 1.4) describing the percentage of red blood cells remaining after 10 minutes in different concentrations of NaCl solution, and a blank grid (Fig. 1.4) on which to plot these data. The marks are for the four conventions above: axes labels, scale, plotting, and the line.
Approach
- Axes: label the x-axis "percentage concentration of sodium chloride" and the y-axis "percentage number of whole red blood cells remaining".
- Scales: the x-axis must run from 0 to at least 1.0 (or 1.2 to use the grid fully); the y-axis must run from 0 to 100. Use a scale that fills at least half the grid and is easy to read (e.g. x: 0.1 per cm, y: 10 per cm, with major labels every 0.2 on x and every 20 on y).
- Plot the six points as small dots in circles, using a sharp pencil.
- Join the points with a thin line that passes through all six points.
Step-by-Step Reasoning
The data from Table 1.4 are:
| concentration of NaCl (%) | % RBCs remaining |
|---|---|
| 0.00 | 0 |
| 0.40 | 3 |
| 0.50 | 10 |
| 0.65 | 46 |
| 0.80 | 96 |
| 0.90 | 100 |
On the x-axis (concentration, 0 to 1.0+), each 0.2 is labelled; on the y-axis (cells remaining, 0 to 100), each 20 is labelled. Each of the six points is plotted at its (x, y) position, with a small dot in a circle (or a small cross). Because the data form a clear smooth curve (sigmoidal in shape, with a steep rise between 0.5% and 0.8%), the points are joined with a thin line that passes through (or very close to) every one. The resulting line rises from the origin, climbs slowly at first, then very steeply between 0.5% and 0.8%, and levels off near 100% at 0.9%.
Key Takeaways
- Axes must be labelled with both the quantity and its unit; the unit on the x-axis is "%" and on the y-axis is also "%".
- The scale should use at least half the grid and be easy to read (no awkward multiples like 3 or 7).
- Points are marked with small, precise symbols, never large blobs.
- A line graph with the points joined is appropriate for continuous IV data — unlike a bar chart, which is for discrete categories.
Common Mistakes
- Swapping the axes (concentration on y, cells on x).
- Omitting the "%" unit on either axis.
- Using an awkward scale (e.g. 0.3 per cm, or starting the x-axis at -0.1).
- Plotting the points as large filled-in dots that hide their true position.
- Drawing a thick, fuzzy line with a ballpoint pen, or a curve that misses several points.
- Drawing a bar chart instead of a line graph.
- Not joining the points at all (a scatter graph with no line is not what's asked for here).
Things to Be Careful About
- The mark scheme insists on a scale where 0.2 of the variable = 2 cm (i.e. 0.1 per cm) and 20 of the variable = 2 cm (i.e. 10 per cm). Use these scales so the marks are secured.
- "Labelled at least every 2 cm" means every 2 cm along the axis there must be a number (so x: 0, 0.2, 0.4, 0.6, 0.8, 1.0; y: 0, 20, 40, 60, 80, 100).
- The line must pass through all six points; a smooth curve that misses a point costs the line mark.
- Use a sharp pencil for plotting; a thick line will not score.
State the concentration of sodium chloride solution that has the same water potential as the red blood cells.
= ______
Answer
0.9%
Background Concept
Water potential () is the tendency of water to move from one place to another by osmosis. Pure water has a water potential of (the highest possible); adding solute lowers the water potential (makes it more negative).
A red blood cell in a solution will:
- gain water and burst if the surrounding solution has a higher (less negative) water potential than the cell's cytoplasm (a hypotonic solution);
- lose water and shrink (crenate) if the surrounding solution has a lower (more negative) water potential than the cytoplasm (a hypertonic solution);
- stay the same if the surrounding solution has the same water potential as the cytoplasm (an isotonic solution) — there is no net movement of water.
So the NaCl concentration that has the same water potential as the red blood cells is the one at which no net change occurs in the cells — i.e. 100% of cells remain whole.
Understanding the Question
The question asks for the concentration at which the NaCl solution has the same water potential as the red blood cells. This is the concentration at which the cells are unaffected — neither gain nor lose water.
Approach
Look at Table 1.4 (or the graph from (b)(i)) and find the concentration at which 100% of the cells remain whole. That is the isotonic concentration.
Step-by-Step Reasoning
Reading Table 1.4:
- 0.00% NaCl → 0% cells remain (all burst — very hypotonic)
- 0.40% NaCl → 3% cells remain (most burst — hypotonic)
- 0.50% NaCl → 10% cells remain (most burst — hypotonic)
- 0.65% NaCl → 46% cells remain (about half burst — slightly hypotonic)
- 0.80% NaCl → 96% cells remain (most intact — close to isotonic)
- 0.90% NaCl → 100% cells remain (all intact — isotonic)
Only at 0.90% are 100% of the cells still whole, meaning there was no net movement of water in either direction. The NaCl solution at 0.9% therefore has the same water potential as the cytoplasm of the red blood cells. This is consistent with the well-known value for physiological saline (≈0.9% NaCl), which is isotonic with mammalian blood.
Key Takeaways
- The isotonic concentration is the one at which cells are unaffected — 100% of cells remain.
- Physiological saline is approximately 0.9% NaCl, matching the cytoplasm of mammalian red blood cells.
- The graph confirms this: the curve flattens at 100% as the concentration approaches 0.9%.
Common Mistakes
- Choosing 0.80% because 96% is "nearly all" — but at 0.80% a small net loss/gain still occurs; 0.9% is the only concentration at which the cells are exactly isotonic.
- Confusing "isotonic" with the steepest part of the curve (which is at ~0.65%) — the steepest part is where cells are most sensitive to concentration change, not where they are isotonic.
- Choosing 0.65% because it is roughly in the middle of the concentration range — that has no biological meaning here.
Things to Be Careful About
- The answer is the concentration at which the cells are unaffected, not the concentration at which they first start to lyse or first reach 100% survival on the graph (these are not the same as the isotonic point, although in this dataset they happen to be the same value, 0.9%).
- The unit on the answer is %, not mol dm⁻³.
With reference to water potential, explain the effect of sodium chloride solution on red blood cells.
Answer
The sodium chloride solution has a higher (less negative) water potential than the cytoplasm of the red blood cells, so water enters the cells by osmosis, down the water potential gradient. The cells swell and burst (haemolysis).
0.4% NaCl has a higher water potential than the red blood cells; water enters the cells by osmosis; the cells swell and burst
Background Concept
Osmosis is the net movement of water molecules across a partially permeable membrane from a region of higher water potential to a region of lower water potential. For an animal cell such as a red blood cell:
- if the outside solution has a higher water potential (lower solute concentration) than the cytoplasm, water enters the cell;
- the cell swells;
- because animal cells have no cell wall, they cannot resist the increased internal pressure, and the membrane ruptures — this is called haemolysis (or lysis).
A red blood cell in distilled water (0% NaCl) is the extreme case: 100% burst. As the NaCl concentration rises, the water potential of the outside solution falls, the rate of water entry falls, and at the isotonic point (0.9%) there is no net movement at all.
Understanding the Question
At 0.40% NaCl, Table 1.4 shows that only 3% of the red blood cells are still whole — i.e. 97% have burst. You are asked to explain this in terms of water potential.
Approach
- Compare the water potential of 0.4% NaCl with the water potential of the cytoplasm of the red blood cells.
- State the direction of net water movement.
- State the consequence for the cell.
Step-by-Step Reasoning
- 0.40% NaCl contains very little solute, so its water potential is high (close to 0 kPa) — much higher than the cytoplasm of the red blood cell, which contains proteins, haemoglobin and other solutes.
- Because the outside solution has the higher water potential, water moves into the cells by osmosis, down the water potential gradient.
- Water continues to enter until the cell membrane can no longer contain the increased volume; the membrane ruptures and the cell bursts (haemolysis).
- 97% of the cells have burst, leaving only 3% intact after the 10-minute exposure — consistent with this explanation.
Key Takeaways
- Animal cells burst in hypotonic solutions because they have no cell wall to resist the osmotic influx of water.
- The lower the external solute concentration, the higher the external water potential, and the faster water enters the cell.
- "Water potential" is the precise term to use; do not say "concentration" when you mean water potential.
Common Mistakes
- Saying "the salt moves into the cells" — ions do move, but the relevant effect here is the water moving in response to the water potential gradient.
- Saying the cells "shrink" instead of "burst" — they burst in a hypotonic solution, they shrink in a hypertonic one.
- Saying the solution is "more concentrated than the cells" — at 0.4% NaCl the solution is less concentrated than the cytoplasm.
- Failing to name the process (osmosis) or the direction of the water potential gradient.
- Calling the bursting "lysis" without explaining that the cell membrane has ruptured because the cell has no wall.
Things to Be Careful About
- Use the exact term water potential, not just "concentration".
- Use the term osmosis to describe the movement of water.
- "Higher" and "lower" water potential must be stated the right way round: the 0.4% solution has the higher water potential, the cell cytoplasm has the lower water potential, so water moves into the cell.
L1 is a slide of a stained transverse section through a plant organ.
Draw a large plan diagram of a region of the organ on L1 to include the epidermis and two vascular bundles. Use a sharp pencil.
Use one ruled label line and label to identify the phloem.
Answer
A large plan diagram is drawn that:
- occupies most of the available space;
- shows the correct tissues (epidermis, ground tissue / cortex, and two vascular bundles) with NO individual cells drawn anywhere;
- has the epidermis drawn as two thin, parallel, close-together lines running around the outside;
- shows at least one of the vascular bundles clearly divided into three regions (xylem, vascular cambium, phloem);
- has one ruled label line ending on the phloem with the label phloem.
Plan diagram of region of L1 showing epidermis (two close lines), ground tissue, and two vascular bundles (each with xylem, cambium and phloem); phloem labelled.
Background Concept
A plan diagram is a low-power, low-magnification drawing of a specimen that shows the arrangement of tissues but NOT the individual cells. The aim is to record the layout of the organ — epidermis, ground tissue, vascular tissues — and the relative sizes and positions of the different regions. This is fundamentally different from a high-power drawing of cells.
In a typical dicotyledonous stem the vascular bundles are arranged in a ring near the epidermis. Each vascular bundle contains three regions that you must be able to recognise:
- Xylem — the larger vessels, often stained more darkly; on the inside of the bundle (towards the centre of the stem).
- Vascular cambium — a thin band of small, thin-walled cells between xylem and phloem.
- Phloem — smaller cells, on the outside of the bundle (towards the epidermis).
Understanding the Question
L1 is a stained transverse section (TS) of a plant organ. You are asked to produce a plan diagram of a region of L1 that includes the epidermis and two vascular bundles, using a sharp pencil, and to label the phloem with a single ruled label line.
Approach
Plan diagrams are drawn freehand but with carefully observed proportions:
- Use a sharp HB pencil; lines should be thin, continuous and unbroken (no sketchy, fuzzy lines).
- Do not draw individual cells at all — represent each tissue as a solid region outlined by a clear line.
- The epidermis is a single layer, so it must be drawn as two close parallel lines (inner and outer edge of the layer), not as a band of cells.
- A vascular bundle is shown as an oval or rounded region that is subdivided into phloem, cambium and xylem. Three subdivisions = three lines inside the bundle outline.
- Labels: a single straight horizontal line, ending with an arrow/short cross on the structure, with the word written clearly at the other end. Label only what is asked (phloem).
Step-by-Step Reasoning
- Mark 1: The drawing should fill most of the space on the page (not a tiny squiggle in a corner) and the two vascular bundles and the outer epidermis should be clearly visible.
- Mark 2: Only tissues are drawn — no brickwork of cells, no shading, no nuclei, no vacuoles.
- Mark 3: Epidermis is a single cell layer, so two lines close together; the rest of the section (cortex/pith) is left as a blank space bounded by a line.
- Mark 4: At least one of the two vascular bundles must be partitioned into three internal regions (xylem, cambium, phloem). A bundle shown as one undivided blob does not score this mark.
- Mark 5: One ruled (straight) label line ending on the phloem region with the word phloem written at the other end.
Key Takeaways
- A plan diagram is a map of tissues, not a picture of cells.
- Epidermis = two close lines. Vascular bundle = outlined region divided into xylem, cambium, phloem.
- Use one ruled line per label; the line must touch the structure it names.
Common Mistakes
- Drawing individual brick-shaped cells inside the plan diagram — this turns a plan into a high-power drawing and loses the planning marks.
- Showing the epidermis as a single line or as a thick band — neither represents a single layer of cells correctly.
- Failing to divide a vascular bundle into phloem, cambium and xylem — the bundle looks like a featureless blob.
- Labelling more than one structure, or using unlabelled arrows, or using a label line that does not end on the structure.
Things to Be Careful About
- The question asks for a large drawing — make it at least 8–10 cm across for the region you are showing.
- Use a sharp pencil, no shading and no sketch lines; the marker rewards "continuous, thin and sharp" lines.
- Position the label line horizontally and put the label at one end; do not write the label on top of the line.
Observe the xylem on the section of the plant organ on L1.
Select a line of four adjacent xylem vessel elements.
Each xylem vessel element must touch at least one of the other xylem vessel elements.
- Make a large drawing of this line of four xylem vessel elements.
- Use one ruled label line and label to identify the lumen.
Answer
A large, high-power drawing showing a line of four xylem vessel elements in which each vessel element touches at least one neighbour, with:
- continuous, thin, sharp, single (unbroken) lines and no shading;
- every cell wall drawn as two close parallel lines;
- at least two of the four vessel elements drawn as polygons with more than four sides;
- one ruled label line ending in the empty central space of a vessel element, labelled lumen.
High-power drawing of four adjacent xylem vessel elements, each touching at least one other, with double-line walls, polygonal shapes (>4 sides) and the lumen labelled.
Background Concept
A high-power drawing of cells is fundamentally different from a plan diagram. It is a careful, large, labelled drawing of a small number of individual cells that you can actually see under the high-power objective. Conventions are strict because the marks are awarded for accuracy of representation:
- Each cell is drawn as a closed shape bounded by a wall.
- Plant cell walls have two sides (the wall has thickness), so each cell wall must be drawn as two close parallel lines.
- The shape you see is what you draw — do not "idealise" a cell as a regular hexagon or circle if it is a different shape.
- Lines must be continuous, thin and sharp, drawn with a sharp pencil in one stroke. No shading, no stippling, no broken lines.
Xylem vessel elements are dead, hollow, water-conducting cells with thickened, lignified walls. They are stacked end-to-end, and adjacent elements are connected by perforation plates. The empty interior of a vessel element is called the lumen.
Understanding the Question
On slide L1, you must select a line of four adjacent xylem vessel elements — that is, four cells in a row, each in contact with at least one of the others (so they share a wall with a neighbour) — and produce a high-power drawing. Then label the lumen.
Approach
- Look at the xylem region of L1 under high power.
- Find a place where four vessel elements form a connected line (each touching at least one other).
- Draw this line of four cells large enough to fill most of the available space.
- Observe the actual shape of each cell. Vessel elements in transverse section are not perfect circles — they are polygonal (pentagonal, hexagonal, sometimes heptagonal). Draw them as polygons, with at least two of the four having more than four sides.
- Each wall is two lines (because the wall has thickness).
- Add a single ruled label line ending inside the empty interior of one of the vessel elements, with the word lumen.
Step-by-Step Reasoning
- Mark 1: All lines are continuous, thin and sharp (no sketchy or fuzzy lines, no shading, no broken lines).
- Mark 2: Four vessel elements are visible, each in contact with at least one other — they share walls.
- Mark 3: Every cell wall is drawn as two close, parallel lines (because the wall has two surfaces, one belonging to each adjacent cell).
- Mark 4: At least two of the four elements are drawn with more than four sides — i.e. pentagons, hexagons or other polygons, matching the polygonal shape of real vessel elements rather than circles or rectangles.
- Mark 5: A single straight label line ends in the open space inside one of the elements, with lumen written at the other end.
Key Takeaways
- High-power drawings show cells, with each cell wall as two lines.
- Draw the shape you actually see; do not idealise.
- Every cell drawn must touch at least one neighbour in the chosen line.
Common Mistakes
- Drawing single-line "walls" — this loses the mark for cell wall as two lines.
- Drawing circular or square cells instead of the polygonal shapes actually seen.
- Drawing four vessel elements that are not all touching each other (e.g. separated by other cells).
- Shading or using thick or broken lines.
- Labelling the wall or the cytoplasm instead of the lumen, or omitting the label entirely.
Things to Be Careful About
- Use a sharp HB pencil; press lightly so you can erase cleanly.
- Make the drawing large — each vessel element should be at least 1.5–2 cm across.
- Do not add a scale bar or magnification to the drawing; the question does not ask for it.
- A single ruled line with the label at one end — not an arrow embedded in the structure and not a label written on the structure itself.
Fig. 2.1 is a diagram of a stage micrometer scale that is being used to calibrate an eyepiece graticule.
One division, on either the stage micrometer scale or the eyepiece graticule, is the distance between two adjacent lines.
The length of one division on this stage micrometer is .
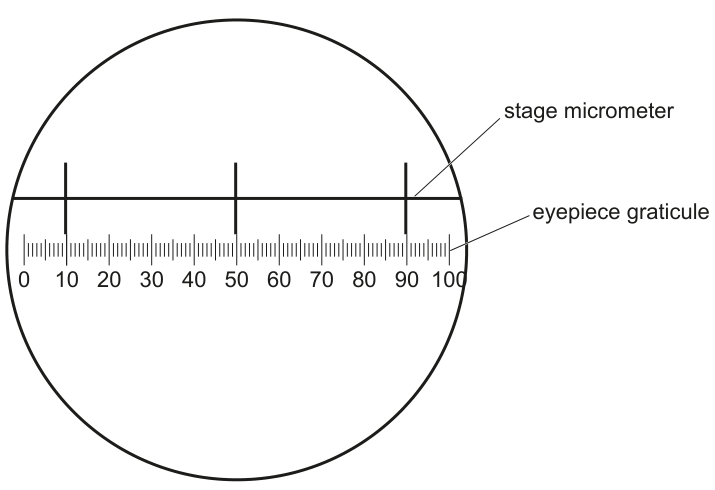
Use Fig. 2.1 to calculate the actual length of one eyepiece graticule unit.
Show your working and give your answer in micrometres (µm).
= ______
Working
- From Fig. 2.1, eyepiece graticule units correspond to stage micrometer divisions.
- One stage micrometer division , so divisions .
- Therefore one eyepiece graticule unit is:
Answer
actual length
2.5 µm
Background Concept
An eyepiece graticule is a small glass disc with a scale etched on it, sitting inside the eyepiece of a microscope. Its divisions are arbitrary: at any given magnification one graticule unit corresponds to a different actual length. To turn the graticule into a measuring tool it must be calibrated against a stage micrometer, which is a slide with a scale of known length (here, per division).
The calibration is done by lining up the two scales and finding how many graticule units span a known number of stage micrometer divisions. Once you know the actual length per graticule unit at that magnification, you can use the graticule to measure any specimen on that microscope at the same magnification.
Understanding the Question
Fig. 2.1 shows the two scales aligned inside the field of view. The stage micrometer marks (the larger, less numerous divisions above) align with graticule marks below. You can read off that eyepiece graticule units are spanned by stage micrometer divisions. You are told one stage micrometer division . You must work out the actual length of one eyepiece graticule unit, in micrometres.
Approach
- Find the total actual length covered by eyepiece graticule units: multiply the number of stage micrometer divisions by .
- Divide that length by to get the length of one graticule unit.
- Convert the answer from to by multiplying by .
Step-by-Step Reasoning
- eyepiece units span stage divisions.
- Each stage division is , so divisions cover .
- One eyepiece unit therefore represents .
- Equivalently, using the mark-scheme-style working: stage division covers graticule units, so graticule unit .
Key Takeaways
- Calibration = (actual length on stage micrometer) ÷ (number of eyepiece graticule units it covers).
- ; always convert so the answer is in the requested unit.
- Calibration depends on the magnification in use: changing objective means recalibrating.
Common Mistakes
- Forgetting to convert into — the answer in is , which is not what the question asks for.
- Reading the wrong number of stage divisions from the figure, or the wrong number of graticule units.
- Dividing the wrong way (dividing stage divisions by graticule units rather than the other way around).
- Writing the units as when is required.
Things to Be Careful About
- The question specifies the answer must be in , but the working can be in provided the conversion is shown.
- Keep the working numerically correct to at least two significant figures; the mark scheme example uses .
Fig. 2.2 is a photomicrograph of a stained transverse section of the same plant organ as the section on L1 but from a different plant.
This was taken using the same microscope and eyepiece graticule as in Fig. 2.1.
The eyepiece graticule scale has been placed across one of the larger sections of vascular tissue, labelled T in Fig. 2.2.
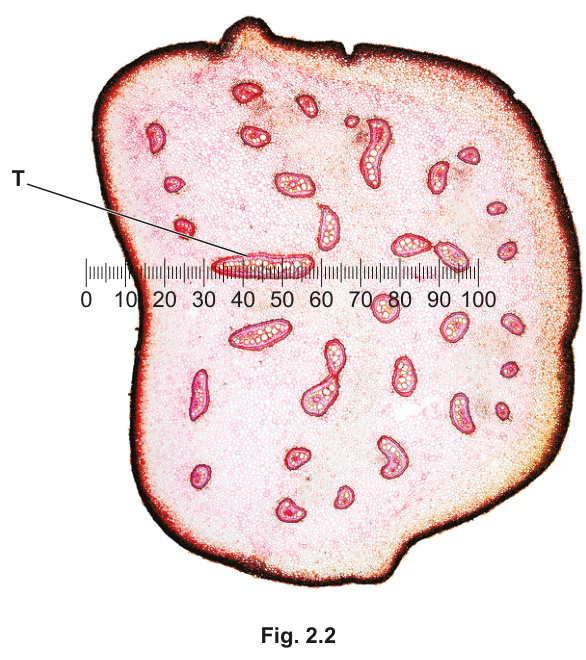
Use the calibration of the eyepiece graticule unit from (b)(i) to calculate the actual length of the section of vascular tissue T in Fig. 2.2.
Show your working and use appropriate units.
= ______
Working
- From Fig. 2.2, the eyepiece graticule crosses vascular tissue T between approximately the and marks, i.e. eyepiece graticule units.
- One eyepiece graticule unit (from (b)(i)) .
Answer
actual length of the vascular tissue T
100 µm
Background Concept
Once the eyepiece graticule is calibrated at a particular magnification, the calibration is fixed for that objective/magnification combination. Any feature on a photomicrograph taken with the same microscope and the same eyepiece can be measured by counting how many graticule units it covers and multiplying by the actual length per unit.
Understanding the Question
Fig. 2.2 is a photomicrograph of a transverse section of the same plant organ as L1, taken on the same microscope with the same eyepiece graticule used in Fig. 2.1. The graticule has been placed across one of the larger vascular bundles, labelled T. You need to count how many graticule units T spans, then multiply by the calibration from (b)(i) to get the actual length.
Approach
- Read the graticule marks at the two ends of T (where the bundle begins and ends).
- The number of graticule units covered = difference between the two readings.
- Multiply by the calibration from (b)(i) (i.e. per unit).
- State the answer with appropriate units.
Step-by-Step Reasoning
- In Fig. 2.2 the bundle T extends from about the mark to about the mark on the eyepiece graticule, so it spans approximately graticule units.
- The calibration from (b)(i) is per graticule unit, so the actual length is .
- An error-carried-forward (ecf) from (b)(i) is acceptable: if the candidate's calibration was correct but produced a different number, that number is multiplied by to give their answer for T.
Key Takeaways
- Photomicrographs taken with the same eyepiece and objective can be measured using the same calibration.
- Reading the whole extent of a feature on the graticule is essential — measure between the two points where the feature begins and ends, not between the closest marks to those points.
- Always include units in the final answer.
Common Mistakes
- Misreading the graticule at one end of T — a small error becomes a large one in the final answer.
- Forgetting to multiply by the calibration (giving just the graticule count).
- Forgetting to include units in the final answer.
- Using a different calibration because the magnification looks different — but the question states the microscope and graticule are the same.
Things to Be Careful About
- The mark scheme accepts ecf from (b)(i): the number of graticule units (40) is read from the figure, and any correct calibration value can be multiplied by it.
- Significant figures: , which is conveniently exact; the answer in is .
- "Appropriate units" — is the natural unit for a vascular bundle measured on a microscope.
Fig. 2.3 is the same photomicrograph as that shown in Fig. 2.2.
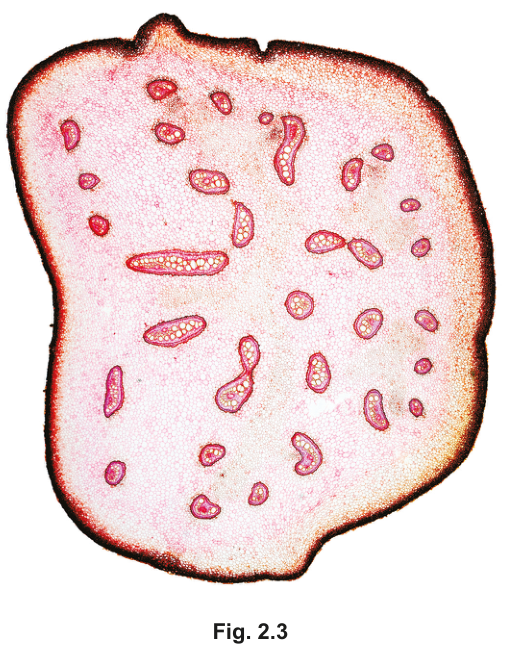
Identify three observable differences, other than colour, between the section on L1 and the section in Fig. 2.3.
Record these three observable differences in Table 2.1.
Table 2.1
| feature | L1 | Fig. 2.3 |
|---|---|---|
Answer
| feature | L1 | Fig. 2.3 |
|---|---|---|
| shape of organ | round | rectangular / irregular |
| position of vascular bundles | in a ring near the epidermis | scattered |
| sizes of the vascular bundles | all are a similar size | large and small sizes |
| arrangement of xylem vessels within a bundle | in lines | scattered |
Three differences: shape (round vs rectangular/irregular); position of vascular bundles (ring near epidermis vs scattered); size of vascular bundles (similar vs large and small).
Background Concept
Two specimens of what looks like the same type of organ can be at different developmental stages, from different plants, or preserved differently, leading to visible structural differences. When comparing specimens, only observable features count — those you can actually see under the microscope or in the photomicrograph. Vague statements like "looks different" or features that depend on colour (which the question explicitly excludes) do not score.
For plant transverse sections the key observable features are:
- the shape of the whole organ (round, square, rectangular, irregular);
- the position of the vascular bundles (in a ring, scattered, or in two groups);
- the size and uniformity of the vascular bundles (all similar, or a mix of large and small);
- the internal arrangement of xylem and phloem within a bundle (in lines, scattered);
- the presence of features such as a pith, cortex, secretory canals, etc.
Understanding the Question
You have two specimens of a plant organ transverse section: L1 (the slide on your microscope) and Fig. 2.3 (a photomicrograph of a similar but different specimen). You need to record three observable differences in the table provided, excluding colour differences.
Approach
Examine L1 directly and Fig. 2.3 in the paper. For each, ask: what is the overall shape of the organ? Where are the vascular bundles? How big are they relative to one another? How are the xylem vessels arranged inside each bundle? Write each difference as a pair of contrasting observations.
Step-by-Step Reasoning
- L1 is a young, almost circular dicot stem with vascular bundles arranged in a single ring just inside the epidermis; the bundles are all roughly the same size, and within each bundle the xylem vessels lie in clear radial lines.
- Fig. 2.3 is an older or different stem with an irregular, rectangular outline; the vascular bundles are scattered throughout the ground tissue; the bundles are of mixed sizes; within a bundle the xylem vessels are scattered rather than in lines.
- Any three of these four pairs of contrasting observations earn full marks.
Key Takeaways
- Comparisons are point-by-point, not general statements.
- "Observable" means visible in the specimen — do not infer mechanism or function.
- The colour of the stain varies between specimens; the question rules that out, so focus on structure and arrangement.
Common Mistakes
- Comparing colour or staining intensity (the question explicitly excludes colour).
- Vague statements such as "the organ is different" or "the bundles are different" — without specifying how.
- Comparing the section to a root or leaf when the organ is actually a stem; do not invent an organ identity.
- Listing fewer than three differences.
Things to Be Careful About
- Differences must be observable in the actual specimens, not derived from the label or the question text.
- A difference in the number of vascular bundles is acceptable as a structural observation; a difference in their position (ring vs scattered) is more diagnostic and is the mark-scheme answer.
- Each row of the table should compare one feature between L1 and Fig. 2.3.
Identify the plant organ on L1 and in Fig. 2.3.
State how one observable feature helped you to identify the plant organ.
= ______
Answer
plant organ = stem
Observable feature: the vascular bundles are arranged in a ring just inside the epidermis (in L1), which is the diagnostic arrangement of a young dicotyledonous stem.
Stem; vascular bundles are arranged in a ring near the epidermis.
Background Concept
A transverse section of a plant organ can usually be identified as root, stem or leaf from the arrangement of its vascular tissue:
- Dicot stem — vascular bundles in a single ring near the epidermis, each bundle with phloem outside and xylem inside; bundles are separated by ground tissue (cortex and pith).
- Dicot root — vascular tissue in the centre, with xylem usually forming an X-shape and phloem between the arms; no pith; an outer cortex and an epidermis.
- Monocot stem — vascular bundles scattered throughout the ground tissue, each bundle usually enclosed in a bundle sheath.
- Leaf — upper and lower epidermis with mesophyll between, vascular bundles forming the midrib and veins.
Understanding the Question
You are asked to identify the organ shown on L1 and in Fig. 2.3, and to give one observable feature that supports the identification.
Approach
- Look at the arrangement of vascular bundles.
- Note whether they are in a ring, in the centre, or scattered.
- Match the arrangement to the diagnostic pattern of stem, root or leaf.
- State the organ and quote one observable feature that supports the conclusion.
Step-by-Step Reasoning
- L1 shows vascular bundles in a ring near the epidermis, with the ground tissue (cortex/pith) inside. There is no central column of xylem, and there is no upper/lower epidermis with mesophyll. This is the diagnostic pattern of a dicot stem.
- A suitable single supporting feature: the vascular bundles are arranged in a ring near the epidermis (L1). This rules out a root (vascular tissue central) and a leaf (epidermis + mesophyll with a single midrib).
- For Fig. 2.3, the scattered bundles would suggest a monocot stem, but the question is asking for the organ shared by both — and L1 is a dicot stem. The simplest combined answer is "stem" with the L1 ring feature as justification.
Key Takeaways
- A single ring of vascular bundles near the epidermis is diagnostic of a dicot stem in transverse section.
- A central column of vascular tissue is diagnostic of a root.
- Scattered vascular bundles indicate a monocot stem.
Common Mistakes
- Calling the organ a root because of the ring of vascular bundles — the position of vascular tissue is the key, not its shape.
- Naming a specific plant (e.g. "sunflower stem") when the question asks only for the organ type.
- Giving a functional or invisible feature (e.g. "transports water") instead of an observable structural feature.
- Quoting a feature from Fig. 2.3 alone (e.g. "scattered bundles") — this is not a feature of L1, which is the slide being examined.
Things to Be Careful About
- The mark is awarded for the identification AND the supporting observable feature; one without the other does not score.
- The feature should be observable on L1 specifically, because the question says "the section on L1 and in Fig. 2.3" — the L1 feature is the cleaner diagnostic.