Biology 9700/32 — May/June 2025
Cambridge AS Level · Advanced Practical Skills · worked solutions for every part, with the mark scheme
Topics Manipulation, Measurement and Observation · Presentation of Data and Observations · Analysis, Conclusions and Evaluation · Use of the Light Microscope
Invertase is an enzyme that catalyses the breakdown of sucrose into glucose and fructose.
Invertase can be extracted from yeast cells.
You will investigate the effect of an invertase extract on a sucrose solution and estimate the concentration of reducing sugars produced.
You are provided with the materials shown in Table 1.1.
Table 1.1
| labelled | contents | hazard | volume / |
|---|---|---|---|
| E | invertase extract | irritant | 20 |
| R | 0.5% reducing sugar solution | none | 40 |
| W | distilled water | none | 100 |
| S | 0.2% sucrose solution | none | 20 |
| Benedict's | Benedict's solution | harmful irritant | 20 |
If any solution comes into contact with your skin, wash off immediately under cold water.
It is recommended that you wear suitable eye protection.
You will need to make the different concentrations of reducing sugar solution using the 0.5% reducing sugar solution, R.
You will need to prepare of each concentration, using R and W.
Table 1.2 shows the concentrations of reducing sugar you will use.
Decide which volumes of R and W you will use.
Complete Table 1.2 to show how you will prepare the concentrations of reducing sugar using R and W.
Table 1.2
| percentage concentration of reducing sugar | volume of R / | volume of W / |
|---|---|---|
| 0.5 | 20.0 | 0.0 |
| 0.1 | ||
| 0.05 | ||
| 0.01 | 0.4 | |
| 0 | 0.0 | 20.0 |
Working
For each row, use with % (concentration of R) and (total volume of the standard), then subtract from to get the volume of W.
- 0.1%: , so of R; W .
- 0.05%: , so of R; W .
- 0.01%: R is given as ; W .
Answer
| percentage concentration of reducing sugar | volume of R / | volume of W / |
|---|---|---|
| 0.5 | 20.0 | 0.0 |
| 0.1 | 4.0 | 16.0 |
| 0.05 | 2.0 | 18.0 |
| 0.01 | 0.4 | 19.6 |
| 0 | 0.0 | 20.0 |
0.1%: 4.0 cm³ R + 16.0 cm³ W; 0.05%: 2.0 cm³ R + 18.0 cm³ W; 0.01%: 0.4 cm³ R + 19.6 cm³ W
Background Concept
A serial dilution produces a set of standard solutions of decreasing concentration by mixing a measured volume of a stock solution with a measured volume of a diluent. The mathematical relationship that governs every dilution is:
where and are the concentration and volume of the stock (here, R = 0.5% reducing sugar solution), and and are the concentration and total volume of the diluted solution you are preparing. The volume of diluent (here, distilled water W) is then . The diluent is added to make the total volume come out to .
Understanding the Question
The question gives you R (0.5% reducing sugar solution) and W (distilled water) and asks you to fill in Table 1.2 to show how 20 cm³ of each of five concentrations (0.5%, 0.1%, 0.05%, 0.01% and 0%) will be prepared. The 0.5% and 0% rows are already complete; the 0.01% row has the R volume pre-filled (0.4 cm³) and only needs the W volume; the 0.1% and 0.05% rows are entirely empty.
Approach
Apply the dilution equation once per missing row. The stock is always 0.5%, the total is always 20 cm³, and is the target concentration. Solve for (volume of R) and then subtract from 20 cm³ to get the volume of W. Do all three rows in one pass.
Step-by-Step Reasoning
0.1% row. , so cm³ of R. Volume of W = cm³.
0.05% row. , so cm³ of R. Volume of W = cm³.
0.01% row. The R volume is given as 0.4 cm³. Volume of W = cm³.
Sanity checks.
- 0% (all water): 0.0 cm³ R + 20.0 cm³ W — correct, no reducing sugar.
- 0.5% (no dilution): 20.0 cm³ R + 0.0 cm³ W — correct, undiluted stock.
- Each R + W pair must sum to exactly 20.0 cm³.
The five standards span a 50-fold range in concentration (0.5% down to 0.01%), with 0% included as a water blank so a negative Benedict's result is defined.
Key Takeaways
- The dilution equation is the workhorse of any serial dilution.
- Volume of diluent = total volume volume of stock.
- Always include a 0% (water blank) standard so you have a known negative for the Benedict's test.
- Pipette the volume of stock into a container first, then make up to the total volume with diluent (not the other way round) for greatest accuracy.
Common Mistakes
- Forgetting to subtract from 20 cm³ to get the water volume.
- Treating 0.1% as one-tenth of 0.5% — it is actually one-fifth, so the R volume is 4.0 cm³, not 2.0 cm³.
- Reporting the W volume for the 0.01% row as 19.6 (without the trailing 0) and so breaking the convention of one decimal place used elsewhere in the table.
- Pipetting W first and then R, which is less accurate because the diluent volume is not known until R is added.
Things to Be Careful About
- Give all volumes to one decimal place (e.g. 4.0, not 4) to match the precision of the values already in the table.
- The mark scheme allows 'ecf' (error carried forward) for W if R is wrong, but the W volume must still sum with R to give 20 cm³.
Preparing reducing sugar standards.
Carry out step 1 to step 8.
step 1 Set up a water-bath and heat it to boiling, ready for step 6 and step 15.
step 2 In the beakers provided, prepare the concentrations of reducing sugar shown in Table 1.2.
step 3 Label test-tubes with the concentrations of reducing sugar stated in Table 1.2.
step 4 Put of Benedict's solution into each labelled test-tube.
step 5 Put of the 0.5% reducing sugar solution, R, into the appropriately labelled test-tube.
step 6 Put the test-tube containing R into the water-bath and start timing.
step 7 Record in (a)(ii) the time taken to the first appearance of a colour change.
If there is no colour change after 120 seconds, stop timing and record the results as 'more than 120'.
step 8 Repeat step 5 to step 7 with the other concentrations of reducing sugar.
Record your results in an appropriate table.
Answer
| percentage concentration of reducing sugar | time / s |
|---|---|
| 0.5 | 15 |
| 0.1 | 35 |
| 0.05 | 70 |
| 0.01 | 105 |
| 0 | more than 120 |
(Times shown are a representative example. The candidate's own times should follow the same trend — shorter times for higher concentrations, and the 0% water blank recorded as 'more than 120' if there is no colour change within 120 s. The independent variable heading comes first, the dependent variable heading second, and no unit appears in the body of the table.)
Representative: 0.5% → 15 s; 0.1% → 35 s; 0.05% → 70 s; 0.01% → 105 s; 0% → more than 120 s. Trend: higher concentration gives a shorter time to first colour change.
Background Concept
Benedict's reagent is a qualitative test for reducing sugars. It contains alkaline copper(II) sulfate (Cu²⁺); a reducing sugar reduces Cu²⁺ to copper(I) oxide (Cu₂O), an insoluble red/orange precipitate, while itself being oxidised. Heating is needed to drive the reaction at a useful rate. The higher the concentration of reducing sugar, the more Cu²⁺ is reduced and the faster a colour change becomes visible (blue → green → yellow → orange → brick-red). With no reducing sugar the solution stays blue. The 0% standard is therefore a vital negative control: it confirms that any colour change later seen with the test tubes is due to reducing sugar, not to the reagent itself.
Understanding the Question
The question asks you to carry out Benedict's tests on the five reducing-sugar standards prepared in (a)(i), timing how long each takes to show its first colour change. You must then record all five timings in a single, properly formatted table. The procedure is given in steps 1–8; the marks are for the table itself, not the timings.
Approach
The mark scheme rewards five things: (1) a correct independent-variable heading, (2) a correct dependent-variable heading, (3) a time for every concentration, (4) the correct trend (highest concentration = shortest time), and (5) whole-second precision. Build the table to satisfy all five in one go.
Step-by-Step Reasoning
Headings. The independent variable is the percentage concentration of reducing sugar (no units in the body — the % lives in the heading). The dependent variable is the time taken to the first appearance of a colour change; write this as 'time / s' so the unit (seconds) sits in the heading rather than the body. The IV heading must come before the DV heading.
Values. A representative set of timings (shorter for higher concentration, longer for lower, 'more than 120' for 0%) is shown in the solution above. Your own values will differ — what matters is the format and the trend.
Trend. Because more reducing sugar means more Cu²⁺ is reduced per second, the higher concentrations should reach the visible end-point first. The 0.5% standard should have the shortest time, the 0.01% standard a long time, and 0% should not change within 120 s. If your results show the opposite trend, suspect pipetting or timing errors and re-run.
Precision. A stopwatch measures to 0.01 s in principle, but the human end-point is fuzzy to within 1–2 s, so whole seconds is the appropriate precision. Do not record tenths of a second.
Key Takeaways
- 'Heading-with-unit' convention: put the unit in the heading ('time / s'), not in the body of the table.
- Independent-variable heading first, dependent-variable heading second.
- Match the recorded precision to the precision of the measuring method (whole seconds for a hand-timed end-point).
- A calibration curve of standards is only useful if it covers the full range you expect, including a 0% blank.
Common Mistakes
- Putting 's' after every value in the body of the table (units belong in the heading only).
- Reversing the headings so that the DV ('time / s') comes first.
- Writing '> 120' or '120' for the 0% standard instead of the precise phrase 'more than 120'.
- Recording times to one decimal place (e.g. 15.0 s) when whole seconds is the convention.
- Omitting the 0% row entirely.
Things to Be Careful About
- Make sure the 0% (water) standard stays blue — this is your negative control.
- The 'first appearance of a colour change' is the end-point: stop the stopwatch the moment any green/yellow/orange tint is visible against a white background; do not wait for the full brick-red precipitate.
- Run the standards in a sensible order (e.g. high to low, then 0%) so you are not contaminating tubes with concentrated sugar from a pipette.
Investigating invertase.
Carry out step 9 to step 16.
step 9 Label one test-tube W and label one test-tube E.
step 10 Put of 0.2% sucrose solution, S, into these test-tubes.
step 11 Add of distilled water, W, to test-tube W and mix well.
step 12 Add of invertase extract, E, to test-tube E and mix well.
step 13 Leave the test-tubes for 5 minutes.
step 14 After the 5 minutes, put of Benedict's solution into each test-tube.
step 15 Put the test-tubes in the water-bath prepared in step 1.
step 16 Record in (a)(iii) the time taken to the first appearance of a colour change.
If there is no colour change after 120 seconds, stop timing and record the results as 'more than 120'.
Record the time taken to the first appearance of a colour change in test-tube W and test-tube E.
result for W = ______
result for E = ______
Answer
- result for W = more than 120 s
- result for E = a value less than 120 s (representative: about 25 s)
W (distilled water + sucrose) contains no invertase, so the sucrose is not hydrolysed to reducing sugars and Benedict's stays blue. E (invertase + sucrose) hydrolyses the sucrose into glucose and fructose, both reducing sugars, so Benedict's changes colour within 120 s. Your actual time for E will depend on the activity of your particular invertase extract.
W: more than 120 s; E: < 120 s (representative ~25 s).
Background Concept
Invertase (also called sucrase) is the enzyme that hydrolyses the glycosidic bond in sucrose to release one molecule of glucose and one of fructose. Both products are reducing sugars and so both will reduce Benedict's reagent, giving a colour change when heated.
This is a controlled comparison: tube W (distilled water + sucrose) is the negative control — it contains sucrose but no enzyme, so the substrate cannot be broken down. Tube E (invertase + sucrose) is the test — it contains both substrate and enzyme, so hydrolysis is expected. Comparing W with E isolates the effect of the enzyme.
Understanding the Question
The question asks you to time the first appearance of a colour change in each of the two tubes (W and E) after adding Benedict's and heating, and to record the two times. The 5-minute pre-incubation in step 13 gives the enzyme time to act before the Benedict's is added.
Approach
The two outcomes you should expect are quite different: W should show no colour change at all (no reducing sugar present), and E should show a colour change within the 120 s window (reducing sugars produced by invertase). Apply the 120 s rule from step 7 and step 16 to W, and time E normally.
Step-by-Step Reasoning
Tube W. With no enzyme present, sucrose is not hydrolysed. Sucrose is itself a non-reducing sugar, so the Benedict's reagent has nothing to react with and the solution stays blue. After 120 s of heating there is still no colour change, so by the procedure you must record 'more than 120' rather than just 120.
Tube E. Invertase hydrolyses sucrose into glucose + fructose, both reducing sugars. Benedict's reagent reacts with them on heating and a colour change becomes visible well within 120 s. The exact time depends on the activity of your invertase extract, but a value in the range 20–60 s is typical for the extract provided.
The 5-minute pre-incubation (step 13) is essential: it allows the enzyme to accumulate enough product that the Benedict's test comes back positive in a measurable time. Without it, you would be timing an essentially instantaneous reaction.
Key Takeaways
- A control tube (no enzyme) is essential to confirm that any colour change in the test tube is due to the enzyme and not to something else (e.g. reducing-sugar impurity in the sucrose).
- 'No change after 120 s' should be recorded as 'more than 120', not as '0' or '120'.
- Pre-incubate enzyme + substrate for long enough that measurable product is present before the test reagent is added.
Common Mistakes
- Recording 120 (not 'more than 120') when no colour change occurs.
- Recording a long time (e.g. 90 s) for W because the solution looked faintly green — the threshold is the FIRST visible colour change, and the reagent's own blue should be ignored.
- Failing to mix the contents of each tube after adding water or invertase, so the two layers of liquid never meet.
Things to Be Careful About
- 'First appearance of a colour change' means the moment any non-blue tint is visible, not the moment the full brick-red precipitate forms.
- Use a white background (e.g. white tile or paper) to judge the colour change accurately.
- The 5-minute wait in step 13 is part of the procedure, not optional — the experiment will not work without it.
Use your results in (a)(ii) and (a)(iii) to estimate the concentration of reducing sugar in test-tube W and test-tube E.
concentration in test-tube W = ______
concentration in test-tube E = ______
Answer
- concentration in test-tube W = 0 % (no colour change in 120 s, so the concentration of reducing sugar is below the lowest detectable standard)
- concentration in test-tube E = the value read from your calibration table (representative: about 0.4 %)
To estimate E, find the standard whose Benedict's time in (a)(ii) most closely matches your time for E. The two standards that bracket the time give the likely range. For example, if E reached the end-point in ~25 s and the 0.5% standard took 15 s while the 0.1% standard took 35 s, the reducing-sugar concentration in E is between 0.1% and 0.5%, roughly 0.4%.
W: 0 %; E: read from own calibration (representative ≈ 0.4 %).
Background Concept
The standards you prepared and timed in (a)(i)–(a)(ii) form a simple calibration set: each concentration of reducing sugar produces a characteristic time to first colour change with Benedict's reagent. An unknown solution can then be estimated by matching its Benedict's time to the standard whose time is closest (or by bracketing it between two standards). This is the same principle as a calibration curve, just read off a table rather than a graph.
Understanding the Question
You have a time for tube W and a time for tube E from (a)(iii), and a set of standard times from (a)(ii). You need to estimate the reducing-sugar concentration in each tube. The question is testing whether you can use a calibration set to read off an unknown.
Approach
For each tube, find the standard whose Benedict's time most closely matches the tube's time. If the tube's time lies between two standards, quote the range and pick a representative value inside it.
Step-by-Step Reasoning
Tube W. W's time is 'more than 120 s'. Looking at the standards, the 0.01% standard itself took close to 100–110 s, and the 0% standard took more than 120 s. Anything 'more than 120' therefore corresponds to a reducing-sugar concentration at or below the lowest non-zero standard, which is best reported as 0% (or 'less than 0.01%' if you want to be cautious).
Tube E. E's time will be some value < 120 s. Suppose E took ~25 s. Look down the standard column: the 0.5% standard took ~15 s and the 0.1% standard took ~35 s. E's time of 25 s sits between these two, so its reducing-sugar concentration lies between 0.1% and 0.5%. A reasonable single estimate is about 0.4% — the value one would read off if a smooth calibration curve were drawn.
Because the original sucrose solution was 0.2% and the enzyme solution was added in equal volume, the maximum possible reducing-sugar concentration in E (if hydrolysis went to completion) is also 0.2% (diluted only by the Benedict's added afterwards, which is not part of the sample). This is a useful sanity check on the estimate.
Key Takeaways
- A calibration set allows an unknown to be estimated by interpolation.
- Bracket the unknown between the two nearest standards and quote a value (or range) inside the bracket.
- Sanity-check the estimate against an independent calculation (here, the maximum possible reducing-sugar concentration is set by the starting sucrose concentration, 0.2%).
Common Mistakes
- Reading the unknown as exactly the standard whose time matches, rather than interpolating between the two bracketing standards.
- Quoting a value for W that is not 0% (or 'less than 0.01%'), even though W showed no colour change.
- Using the E result without checking it against the original sucrose concentration (it cannot exceed 0.2%).
Things to Be Careful About
- The estimate must be based on the candidate's own times, not a generic 'textbook' answer. The mark scheme specifically says 'correct estimate for W and E based on candidate's results'.
- The standard concentrations are spaced 5- to 10-fold apart, so the estimate is at best a rough bracket — improving it requires (a)(vi)'s narrower intervals.
With reference to the invertase extract, distilled water and sucrose solution, explain the results in (iv).
test-tube W
test-tube E
Answer
General principle
- Sucrose is not a reducing sugar, so on its own it cannot reduce Benedict's reagent.
Test-tube W
- There is no invertase in test-tube W (only distilled water and sucrose), so the sucrose is not broken down / hydrolysed and no reducing sugars are formed. Benedict's therefore stays blue.
Test-tube E
- Invertase (in the extract) has broken down / hydrolysed the sucrose into glucose and fructose. Both are reducing sugars, so Benedict's reagent is reduced and a colour change appears.
Sucrose is non-reducing; W has no enzyme so no hydrolysis; E: invertase hydrolyses sucrose to glucose + fructose, both reducing.
Background Concept
A reducing sugar is one that has a free aldehyde (–CHO) or free ketone (C=O) group, or one that can open into a form that does, and so can donate electrons to Cu²⁺ in Benedict's reagent, reducing it to brick-red Cu₂O. Glucose and fructose both qualify — glucose because of its free aldehyde group, fructose because it can tautomerise to a form with a free aldehyde.
Sucrose, by contrast, is a disaccharide of glucose joined to fructose through their two anomeric carbons (C1 of glucose and C2 of fructose). Both reactive groups are locked up in the glycosidic bond, so sucrose has no free aldehyde or ketone and is a non-reducing sugar. It cannot reduce Benedict's reagent on its own.
Invertase (also called sucrase or β-fructofuranosidase) hydrolyses this glycosidic bond, releasing free glucose and free fructose — both of which ARE reducing sugars.
Understanding the Question
The question asks you to explain, with reference to invertase extract, distilled water and sucrose solution, why the two tubes gave the results they did in (a)(iv). The expected answer is three connected points: a general statement about sucrose, and then a separate explanation for W (negative result) and for E (positive result).
Approach
State the general rule first, then apply it to each tube. The mark scheme splits the marks into these three logical chunks: (1) sucrose is non-reducing, (2) W has no enzyme so no hydrolysis, (3) E has invertase so hydrolysis occurs and reducing sugars are produced.
Step-by-Step Reasoning
Point 1 — sucrose is a non-reducing sugar. This is the underlying reason both tubes start with the same starting material but give different end-points. It must be stated explicitly, not just implied.
Point 2 — tube W. W contains distilled water + sucrose. Distilled water has no enzyme, so the sucrose remains intact. Because sucrose is non-reducing, Benedict's reagent has nothing to react with and the solution stays blue. The 5-minute pre-incubation has no effect on the outcome because no hydrolysis can occur without the enzyme.
Point 3 — tube E. E contains invertase extract + sucrose. The invertase hydrolyses the glycosidic bond in sucrose, releasing glucose and fructose. Both are reducing sugars, so when Benedict's reagent is added and the tube is heated, Cu²⁺ is reduced to Cu₂O and a colour change is observed.
The 5-minute pre-incubation in step 13 gives invertase time to accumulate enough product that Benedict's can register a positive result in a measurable time. Without the pre-incubation, the reaction would still go but the colour change would appear almost immediately on heating and be hard to time.
Key Takeaways
- Sucrose is a non-reducing sugar; glucose and fructose are reducing sugars.
- An enzyme is required to break a chemical bond — substrate and water on their own will not hydrolyse sucrose at room temperature on the timescale of this experiment.
- A negative control (W) is essential to confirm that the positive result in E is due to the enzyme and not to a reducing-sugar impurity in the sucrose.
Common Mistakes
- Stating only that W has no enzyme without first saying sucrose is non-reducing (loses the first marking point).
- Saying invertase 'breaks down sucrose into energy' or 'uses up sucrose' rather than naming the reducing-sugar products (glucose and fructose).
- Failing to specify that BOTH glucose and fructose are reducing sugars (some candidates only mention one).
- Describing Benedict's as being 'changed by' sucrose rather than 'reduced by' reducing sugars.
Things to Be Careful About
- The mark scheme requires the specific word 'hydrolysed' (or 'broken down') for the enzyme action — do not just say 'reacted' or 'acted on'.
- 'Reducing sugar' (singular or plural) is the technical term — 'sugar' alone is not precise enough.
Suggest two improvements to the procedure that would give you a more accurate value for your estimated concentration of reducing sugar in test-tube E.
1
2
Answer
-
Use reducing-sugar standards at narrower concentration intervals around the value estimated in (a)(iv) for E, so the calibration is finer and the estimate is more accurate.
-
Repeat the procedure several times and calculate a mean time for each standard and each tube, to reduce the effect of random error in the human end-point judgement.
(An equally acceptable alternative for point 1 is to prepare standards at concentrations known to lie just above and just below the estimate from (a)(iv), so the estimate can be bracketed precisely.)
- Use standards with narrower concentration intervals around the estimate. 2. Repeat the procedure and calculate a mean.
Background Concept
The accuracy with which an unknown can be read off a calibration set depends on two things: (1) the spacing of the standards, and (2) the precision of the individual measurements. A wide spacing (here 0.5%, 0.1%, 0.05%, 0.01%, 0% — factors of 5 and 2) means the unknown can only be located to within the gap between two standards; closer spacing makes the interpolation more precise. Repeat measurements average out the random error in judging the 'first appearance' of the colour change.
Understanding the Question
The question asks for two improvements to the procedure that would give a more accurate value for the estimated concentration of reducing sugar in test-tube E. The mark scheme lists three acceptable improvements; you only need to give any two.
Approach
Look at each step of the procedure and ask: where is the biggest source of inaccuracy, and how could it be reduced? The mark-scheme answers point at the two main sources: (1) the spacing of the standards and (2) the precision of the timing.
Step-by-Step Reasoning
Improvement 1 — narrower concentration intervals. The current standards are spaced 2- to 5-fold apart, so an E-time of, say, 25 s is bracketed by 15 s (0.5%) and 35 s (0.1%) — a five-fold range in concentration. Adding standards at 0.3%, 0.2% and 0.05% (or similar) would let the candidate interpolate to within 0.05% or better. A close alternative, also credited, is to make up standards at concentrations chosen to lie just above and just below the candidate's own estimate for E — that is, to bracket the estimate precisely.
Improvement 2 — repeats and a mean. Judging the moment of first colour change is subjective and varies by 1–2 s between observers (or the same observer on different runs). Repeating the timing three or more times for each standard and for E, then taking a mean, reduces this random error. A mean should be quoted to the same precision as the original data (whole seconds in this case).
Other possible improvements (not on the mark-scheme list but reasonable in principle): control the water-bath temperature more precisely (the Benedict's reaction rate is temperature-sensitive); use a colorimeter to detect the colour change objectively rather than by eye; or use a known amount of invertase and a longer fixed incubation time so the absolute amount of reducing sugar produced can be calculated rather than estimated by comparison.
Key Takeaways
- Accuracy of an interpolated value is limited by the spacing of the standards and the precision of the readings.
- Narrower intervals and repeats-with-a-mean are the two workhorse improvements for any calibration-based estimate.
- Improvements should target the specific largest source of error in the procedure, not generic 'human error'.
Common Mistakes
- Vague suggestions such as 'be more careful' or 'use better equipment' — these do not identify a specific source of error or a specific fix.
- Suggesting a 'control' when the experiment already has one (the 0% water blank).
- Repeating the suggestion that the candidate should 'use a different method' without explaining what method and why it would be more accurate.
- Suggesting improvements that change the variable being measured (e.g. switching from Benedict's to a different test) without justification.
Things to Be Careful About
- The improvements must make the ESTIMATE of concentration more accurate, not just make the procedure easier.
- Mark-scheme answers are specific: 'narrower intervals', 'concentrations either side of the estimate', or 'repeat and mean' — paraphrases are usually accepted if the meaning is clear, but vague generalities are not.
Yeast cells also produce the enzyme catalase. Catalase breaks down hydrogen peroxide into oxygen gas and water.
A student added different concentrations of catalase enzyme to hydrogen peroxide and counted the number of oxygen bubbles produced in 5 minutes.
Table 1.3 shows the results of the investigation.
Table 1.3
| percentage concentration of catalase | number of bubbles of oxygen in 5 minutes |
|---|---|
| 0.0 | 1 |
| 2.0 | 22 |
| 4.0 | 44 |
| 6.0 | 50 |
| 8.0 | 94 |
| 10.0 | 118 |
Plot a graph of the data shown in Table 1.3 on the grid in Fig. 1.1.
Use a sharp pencil.
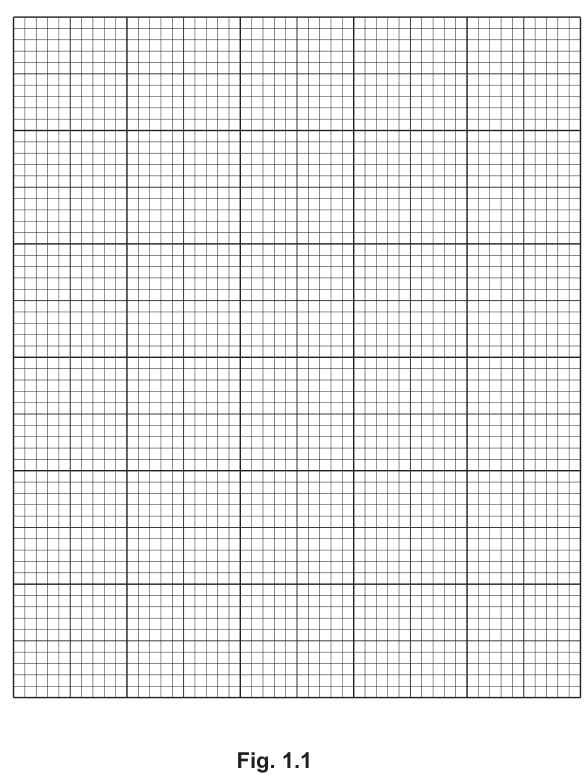
Answer
Axes
- -axis: percentage concentration of catalase, scaled % to cm, labelled at least every cm (e.g. , , , , , ).
- -axis: number of bubbles of oxygen in minutes, scaled to cm, labelled at least every cm (e.g. , , , , , , ).
Points (drawn as small dots in circles, or small crosses)
Line: a thin straight line passing through all six points.
See graph — : catalase concentration (2% = 2 cm); : number of bubbles of O₂ in 5 min (20 = 2 cm); all six points plotted and joined with a thin line.
Background Concept
A line graph is the correct presentation for two continuous variables where one (the independent variable, here the catalase concentration) is being varied deliberately to see its effect on the other (the dependent variable, here the number of bubbles of oxygen). Each pair of values becomes a point, and joining the points shows the trend at a glance. The graph is a tool for revealing the relationship and for reading off intermediate values; it is also the first step in identifying any anomalous result.
Cambridge graph conventions require: each axis labelled with the quantity and unit; sensible non-awkward scales that use at least half the grid; points plotted with small dots in circles (or fine crosses) so the centre is unambiguous; and a thin line that follows the trend. A bar chart would be wrong here because the independent variable is continuous, not categorical.
Understanding the Question
Table 1.3 gives six pairs of values: percentage concentration of catalase (0.0, 2.0, 4.0, 6.0, 8.0, 10.0) and number of bubbles of oxygen counted in 5 minutes (1, 22, 44, 50, 94, 118). The question asks you to plot all six points on the grid provided (Fig. 1.1) and join them. Four marks are available: axes & labels, scales, plotting, and the line.
Approach
Set up the axes first, then plot the points, then add the line. The scales are dictated by the mark scheme: 2% per 2 cm on the x-axis, 20 bubbles per 2 cm on the y-axis. These are non-awkward scales (each grid square represents a whole-number multiple of the data) and use the grid well.
Step-by-Step Reasoning
Axes & labels. The -axis is 'percentage concentration of catalase' (no units in the body — the % lives in the heading). The -axis is 'number of bubbles of oxygen in 5 minutes' (no unit in the body). Labels go below the -axis and to the left of the -axis.
Scales. On the -axis, label every other major grid line (i.e. every 2 cm) with a value, starting at 0 and going up to at least 10: 0, 2, 4, 6, 8, 10. On the -axis, do the same with 0, 20, 40, 60, 80, 100, 120. These are the mark-scheme-required scales; any equivalent non-awkward scale (e.g. 1% per 1 cm and 10 bubbles per 1 cm) also scores, as long as the grid is used to at least half and no scale is 'awkward' (e.g. 3 to 1 cm).
Plotting. Use a sharp pencil. Mark each of the six pairs as a small dot in a circle, or as a fine cross, so the centre of the point is unambiguous. The pairs are:
- (0.0%, 1)
- (2.0%, 22)
- (4.0%, 44)
- (6.0%, 50)
- (8.0%, 94)
- (10.0%, 118)
Line. Join the six points with a thin straight line passing through all of them. (The mark scheme explicitly requires the line to pass through every point, even though one of them — (6, 50) — is clearly off the otherwise linear trend and is identified as anomalous in (b)(ii).) Do NOT use a thick line, and do NOT use a curve.
Key Takeaways
- Graph conventions: labelled axes, non-awkward scales using at least half the grid, fine pencil, dots in circles or fine crosses, thin line.
- Choose scales that make the data points easy to plot accurately — round numbers per grid square.
- Always plot every data point; anomalies are dealt with in interpretation, not by omission from the graph.
Common Mistakes
- Awkward scales (e.g. 3 bubbles per 1 cm) that make plotting error-prone.
- Using thick or fuzzy lines to join the points, or using a curve that smooths over the anomaly.
- Omitting the unit from the axis label, or putting the unit in the body of the axis (e.g. '1 bubbles' instead of '1').
- Mis-plotting (6, 50) at, say, (6, 60) by eye because the anomaly is unexpected.
- Forgetting the line of best fit and leaving the points unconnected.
Things to Be Careful About
- The mark scheme specifically requires '2% to 2 cm' on the -axis and '20 to 2 cm' on the -axis — sticking to these avoids any risk of an awkward scale.
- The point (6, 50) IS anomalous but it MUST be plotted and the line MUST pass through it, per the mark scheme; the analysis of why it is anomalous comes in (b)(ii).
State the percentage concentration of catalase that gave an anomalous result.
______ percentage concentration
Answer
6.0 %
At 6.0 % catalase the count is 50 bubbles, which is much lower than the linear trend (≈ 65 bubbles) predicted by the surrounding points at 4.0 % (44) and 8.0 % (94). It is therefore the anomalous result.
6.0 %
Background Concept
An anomaly is a data point that does not fit the trend shown by the rest of the data. In a linear relationship the anomaly is the point that lies furthest from the line of best fit. Identifying the anomaly is the first step in deciding whether to discard the point, repeat the measurement, or look for an experimental reason for the deviation.
Understanding the Question
You have just plotted the data from Table 1.3. The question now asks you to read off the percentage concentration of catalase that produced the anomalous result. There is one mark for naming the catalase concentration (not the number of bubbles).
Approach
Look at the plotted line. Five of the six points lie close to a straight line that rises from (0, 1) to (10, 118). One point sits well off this line. Identify the x-coordinate of that point.
Step-by-Step Reasoning
The five 'in-line' points are (0, 1), (2, 22), (4, 44), (8, 94) and (10, 118). A straight line through them would pass close to (6, ~65). The actual data point at 6.0% is only 50 bubbles — well below the line. The 6.0% data point is the anomaly.
A simple sanity check: the differences between consecutive points are 21, 22, 6, 44, 24. The jump from 44 (at 4.0%) to 50 (at 6.0%) is much smaller than the surrounding jumps, and the jump from 50 to 94 (at 8.0%) is correspondingly much larger. The 'missing' 14 bubbles at 6.0% is what makes it anomalous.
Key Takeaways
- An anomaly is identified by its deviation from the trend, not by being 'odd-looking' in isolation.
- Always quote the independent variable (here, the catalase concentration), not the dependent variable (the number of bubbles), as the answer.
Common Mistakes
- Quoting the number of bubbles (50) rather than the catalase concentration (6.0%) — the question asks for the concentration.
- Identifying the wrong point — the lowest point (0%, 1) is NOT anomalous, because the linear trend predicts a value close to 1 at 0%.
Things to Be Careful About
- Read the answer off the graph you have just plotted; do not guess from the table.
- 'Anomalous' does not necessarily mean 'wrong' — it means 'warrants further investigation'. The point should still be plotted and the line still passes through it (per the mark scheme for (b)(i)).
Answer
As the percentage concentration of catalase increases, the number of bubbles of oxygen produced in 5 minutes increases (a positive correlation).
Positive correlation: as catalase concentration increases, the number of oxygen bubbles increases.
Background Concept
A trend describes how one variable changes as the other is varied. 'Positive correlation' means that both variables increase (or both decrease) together; 'negative correlation' means that as one increases the other decreases. The phrase 'directly proportional' would describe a stricter relationship where doubling the independent variable doubles the dependent variable; here the data are roughly linear, so 'positive correlation' is the safer description.
Understanding the Question
The question simply asks for a description of the trend shown by the plotted data. One mark is available for a clear statement of the relationship between the two variables.
Approach
Look at the line on the graph: it slopes upward from lower-left to upper-right. State which variable goes up and which variable goes up with it. Name the two variables and the direction of the change in each.
Step-by-Step Reasoning
The -axis (independent variable) is the catalase concentration; the -axis (dependent variable) is the number of oxygen bubbles. As we move right along the -axis, the line rises: the number of bubbles goes up. The two variables therefore increase together — a positive correlation.
The data are also approximately linear (ignoring the anomaly at 6%), so the relationship is close to direct proportionality: doubling the catalase concentration roughly doubles the bubble count.
Key Takeaways
- A trend is described by naming both variables and the direction of change in each.
- 'Positive correlation' is the precise term; 'directly proportional' is only correct if the data are exactly linear through the origin (which they nearly are here, so it is a defensible description if the candidate can justify it).
Common Mistakes
- Saying only 'it increases' without saying what increases (which variable, and with what).
- Saying 'catalase produces oxygen' rather than 'more catalase leads to more oxygen bubbles produced in 5 minutes' — the question asks for a description of the trend, not a causal explanation.
- Saying 'proportional' without checking that the line passes through the origin (it nearly does, but the 0%, 1 point is not quite at the origin).
Things to Be Careful About
- Always include both variables in the description ('as X increases, Y increases'), not just one.
- A 'description' is a statement of fact about the data; an 'explanation' would be about why it happens (more enzyme → more active sites → more substrate broken down per unit time). The command word here is 'describe', so stick to the pattern in the data.
Answer
Hydrogen peroxide (H₂O₂) is unstable and slowly breaks down / decomposes to form oxygen and water on its own, even without catalase. A small number of bubbles are therefore produced at 0 % catalase.
Hydrogen peroxide slowly breaks down to oxygen and water without enzyme.
Background Concept
Hydrogen peroxide (H₂O₂) is thermodynamically unstable: the reaction
is spontaneous (ΔG is negative) and so proceeds without any catalyst. At room temperature, however, the uncatalysed reaction is very slow — its half-life at 25 °C is many hours. Catalase speeds the reaction up by a factor of ~10⁸ by providing an alternative reaction pathway with a much lower activation energy, which is why living cells use it to dispose of H₂O₂ safely.
In this experiment the 0% catalase tube contains only hydrogen peroxide solution and water (the catalase solution has been replaced with distilled water). Over the 5-minute counting window, a small but non-zero amount of H₂O₂ decomposes spontaneously, releasing a few bubbles of oxygen. This is why the count at 0% is 1, not 0.
Understanding the Question
The question asks you to suggest an explanation for the small but non-zero count at 0% catalase. One mark is available for a clear statement that the reaction still proceeds, just very slowly, without the enzyme.
Approach
State the underlying chemistry: H₂O₂ is unstable and slowly decomposes on its own. Note that the rate is much lower than in the presence of catalase, which is why the count is 1, not (say) 50.
Step-by-Step Reasoning
The data show 1 bubble at 0% catalase. If the reaction required catalase, the count would be 0. The fact that it is 1 (not 0) shows that some oxygen is produced without enzyme. The reason is the spontaneous (uncatalysed) decomposition of H₂O₂ into water and oxygen, which proceeds slowly at room temperature.
The count would still rise to 1 from 0 only if some decomposition occurred during the 5-minute window. The mark-scheme answer explicitly accepts 'hydrogen peroxide breaks down / forms oxygen with no enzyme'.
Key Takeaways
- Even an enzyme-catalysed reaction has a non-zero uncatalysed rate; the enzyme just makes it much faster.
- A control (0%) that is not exactly zero is normal and does not invalidate the experiment; it just sets the background level.
- 'Spontaneous decomposition' (or 'uncatalysed breakdown') is the precise description of what is happening.
Common Mistakes
- Saying 'there were no enzymes so no oxygen should be produced' (which would predict 0 bubbles, not 1).
- Saying 'the water produced oxygen' or 'the air produced oxygen' — both wrong; the oxygen comes from the H₂O₂.
- Confusing catalase with another enzyme (e.g. peroxidase) or with a substrate.
Things to Be Careful About
- The mark scheme requires the candidate to state that hydrogen peroxide itself breaks down (or forms oxygen) without the enzyme — not just to assert that the reaction still happened.
- A 'suggest' question expects a plausible biological/chemical explanation, not a proof.
The student observed that the size of the bubbles varied.
Suggest a more accurate method of measuring the oxygen produced.
Answer
Measure the volume of oxygen produced instead of counting bubbles, e.g. by collecting the gas in a gas syringe or by downward displacement of water in an inverted measuring cylinder / burette.
Measure the volume of oxygen using a gas syringe or water (downward) displacement.
Background Concept
Counting bubbles is a quick but very crude way of measuring a gas. Bubble size depends on the diameter of the tube, the surface tension of the liquid, the gas flow rate and the viscosity of the liquid, so two 'bubbles' from the same reaction can easily differ in volume by a factor of two. The standard improvements replace bubble-counting with a method that measures an actual physical quantity — most commonly the volume of gas collected, or (in a more advanced version) the change in pressure.
The two classic methods for collecting a small volume of an insoluble gas such as oxygen are:
-
Gas syringe. The gas pushes a plunger back along a graduated barrel; read the volume directly from the scale. Best for volumes up to about 100 cm³ and for following the rate of the reaction in real time.
-
Downward displacement of water (over water). An inverted measuring cylinder or burette, full of water, has its open end submerged in a water trough. The gas is delivered into the open end via a delivery tube and displaces water downwards; the volume of water displaced equals the volume of gas collected.
Both methods give the volume in cm³ (or dm³) to a precision of at least 0.1 cm³, far better than the ±50% precision of a bubble count.
Understanding the Question
The question points out that bubble size varied in the original experiment, and asks for a more accurate method of measuring the oxygen produced. One mark is available for a named method (or a description that makes the method unambiguous).
Approach
State that the aim is to measure volume, not count bubbles, and name a standard piece of apparatus that does this.
Step-by-Step Reasoning
The mark scheme accepts 'measuring the volume of oxygen or description e.g. using a gas syringe, water displacement method'. Either a named apparatus (gas syringe, inverted measuring cylinder, burette) or a description of the principle (collect the gas and read its volume) scores.
For completeness: the oxygen should be collected over water (not air), because oxygen is slightly soluble in water but the solubility is small and the small correction it introduces is more accurate than the bubble-counting error. A small correction for the water vapour pressure in the collected gas is sometimes applied in more advanced work, but is not required at A-level.
Key Takeaways
- Bubble size is variable; bubble count is therefore a poor proxy for gas volume.
- A gas syringe or water displacement converts the count into a real volume reading, dramatically improving accuracy and precision.
- When proposing an alternative method, name the apparatus and briefly say what it measures.
Common Mistakes
- Suggesting 'count the bubbles more carefully' or 'use a bigger tube' — both still rely on counting bubbles and so do not address the variability of bubble size.
- Suggesting a method that does not measure volume, e.g. 'time how long the bubbles take to form' (this would measure rate, not amount).
- Naming a piece of apparatus without explaining what it measures, e.g. just 'use a syringe' (the mark scheme wants a gas syringe specifically, or a description that makes it clear the gas volume is what is being measured).
Things to Be Careful About
- The improvement must measure the gas more accurately; 'use a more accurate stopwatch' does not address the bubble-size problem.
- Either 'gas syringe' or 'water displacement' (or a description) is accepted; a method that does not measure volume is not.
K1 is a slide of a stained transverse section through a plant stem.
Draw a large plan diagram of the region of the stem on K1 indicated by the shaded area in Fig. 2.1. Use a sharp pencil.
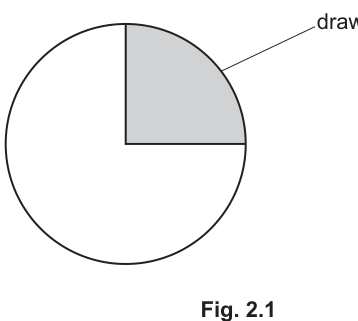
Use one ruled label line and label to identify a vascular bundle.
Answer
A large plan diagram of the shaded quarter-sector of the stem is drawn, showing:
- A pie-slice shape (two straight radii meeting a curved outer arc), occupying at least half the available drawing area.
- No individual cells drawn and no shading anywhere.
- Vascular bundles arranged in a single ring around the stem, with the correct number, sizes and spacing visible in the field of view.
- A clearly enclosed (outlined) darker area at the outer (top) edge of each vascular bundle (the sclerenchyma/fibre cap).
- One ruled label line ending on a vascular bundle, labelled vascular bundle.
See working — plan diagram of the shaded sector of the stem with vascular bundles labelled.
Background Concept
A plan diagram is a low-magnification drawing that shows the overall layout of tissues in a specimen without drawing any individual cells. It is used to record the arrangement of tissues — for example, where the vascular bundles sit in a stem, whether they form a ring or are scattered, and the relative widths of the epidermis, cortex and central region.
In a young dicotyledonous stem, vascular bundles are arranged in a ring around the outside of a central pith. Each bundle typically has a sclerenchyma cap (a group of thick-walled fibres) on the outside — the 'enclosed area' that the mark scheme rewards. Phloem lies outside the xylem within each bundle.
Understanding the Question
K1 is a prepared slide of a stained transverse section of a plant stem. Fig. 2.1 indicates that only the shaded quarter of the stem cross-section (one 90° sector) needs to be drawn. The question is a plan diagram — low-magnification outline only. You must add a single ruled label line ending on a vascular bundle.
Approach
- Use a sharp HB pencil and a clean white space at least 10–12 cm across.
- Block out the pie-slice: two straight radii meeting a curved outer arc, copying the proportions of the shaded region in Fig. 2.1.
- Scan along the ring of vascular bundles in the actual field of view under the microscope. Decide the number, size and spacing of bundles in this quarter — that is the only information the drawing must convey.
- For each bundle, draw the bundle outline AND a small enclosed shape at the outer edge (the fibre cap).
- Add a single horizontal rule from one bundle to the margin, and write vascular bundle.
Step-by-Step Reasoning
- Mark 1 (size & no shading): The plan should fill most of the space. Shading (pencil smudge, dots, cross-hatching) is a common reason candidates lose this mark — plan diagrams are pure outline.
- Mark 2 (draws quarter): The outline is a pie-slice: two straight radii at 90° and the outer curved epidermis. Drawing the whole circle or a half loses this mark.
- Mark 3 (correct pattern of bundles, no cells): The vascular bundles form a single ring, not scattered. Do not draw individual cells inside or outside the bundles — the question explicitly says plan diagram.
- Mark 4 (enclosed area at top of each bundle): Each bundle has a small dark-bordered shape at its outer end (the sclerenchyma cap). This is a single enclosed outline, NOT a shaded region.
- Mark 5 (ruled label line + label): A straight horizontal rule from one vascular bundle to the page margin with the words vascular bundle. The line must touch the bundle and end without an arrowhead; the label is written above the line in neat print (not cursive).
Key Takeaways
- A plan diagram = outline only, no cells, no shading, sharp continuous lines.
- It must accurately represent the number, size and arrangement of structures in the field of view.
- A sclerenchyma/fibre cap is a defining feature of a stem vascular bundle — drawing it earns a separate mark.
Common Mistakes
- Shading the inside of the vascular bundles (e.g. filling the phloem in pencil) — rejected; plan diagrams have no shading.
- Drawing individual cells inside the bundles or cortex — the question says 'plan diagram'.
- Drawing a full circle instead of the quarter sector shown in Fig. 2.1.
- Using arrowheads on label lines or writing the label in cursive — both rejected by the strict CIE convention.
- Omitting the fibre cap on the bundles.
Things to Be Careful About
- The drawing must be done with a sharp pencil — fuzzy lines lose marks for 'sharp and continuous'.
- Label lines should be ruled (drawn with a ruler) and horizontal; they should not cross each other.
- The label should sit neatly at the end of the line, not floating in the middle.
- Plan diagrams represent what is actually visible in the field of view — do not invent bundles that are not there.
Observe one vascular bundle of the section on K1.
Select one large xylem vessel element and a group of three adjacent smaller xylem vessel elements.
- Make a large drawing of this group of four xylem vessel elements.
- Use one ruled label line and label to identify the wall of one xylem vessel element.
Answer
A large high-power drawing of one large xylem vessel element and three smaller adjacent xylem vessel elements, showing:
- All lines sharp and continuous, no shading.
- The four vessel elements drawn in the correct relative sizes and shapes (one large, three small, all with thickened walls).
- Two lines around the wall of every xylem vessel element.
- Three lines where two xylem vessel elements share a wall (the two outer cell-membrane/wall lines plus the middle shared wall).
- One ruled label line ending on the wall of one xylem vessel element, labelled xylem vessel element wall (or equivalent).
See working — high-power drawing of one large and three smaller xylem vessel elements with a wall labelled.
Background Concept
A high-power drawing of cells (sometimes called a 'detail drawing' or 'cell drawing') shows individual cells at high magnification, with their walls drawn as two lines representing the two sides of the cell wall. Where two cells meet, the wall between them appears as three lines: the wall of cell A, the middle line (the middle lamella / shared wall), and the wall of cell B.
Xylem vessel elements are dead, hollow, tube-like cells. Mature vessel elements have thickened, lignified walls (often with pits visible) and no contents — they appear empty under the microscope. In a stem section, the large vessel elements are the metaxylem (formed later), while the smaller vessel elements around them are the protoxylem (formed earlier, narrower).
Understanding the Question
K1 is a stem section. At high power you must pick one large xylem vessel element and three smaller adjacent vessel elements in the same group. The drawing should show all four, plus a label on the wall of one of them.
Approach
- Centre the chosen group of four vessel elements in the field of view at high power.
- Decide the relative sizes — the 'large' one is noticeably bigger (often roughly 2× the diameter of the small ones) and the three small ones should all be similar to each other.
- Sketch the layout in pencil first, then re-draw the final version with sharp continuous lines.
- Use the double-line rule for every wall: two lines for the wall of each cell; three lines where two cells touch.
- Add the label.
Step-by-Step Reasoning
- Mark 1 (appropriate size, sharp continuous lines, no shading): The drawing should be large (occupying a substantial area) and the lines crisp. No pencil shading, no sketchy lines.
- Mark 2 (one large + three small xylem vessel elements): The candidate must show all four vessels and the relative size difference must be clear.
- Mark 3 (two lines around each cell wall; three lines where vessels touch): This is the classic CIE 'double line / three line' convention. Drawing the walls as a single thick line loses this mark.
- Mark 4 (correct shape): Xylem vessel elements are roughly circular to polygonal in transverse section. Do not draw them as perfect circles or as irregular wavy shapes — copy the shape seen down the microscope.
- Mark 5 (ruled label line to the wall of one vessel element): One straight horizontal line from the wall of one cell to the page margin, labelled 'wall of xylem vessel element' (or similar). The label is written above the line in neat print.
Key Takeaways
- Double lines for walls, three lines where cells touch is the most heavily penalised convention in CIE biology drawings.
- Drawings must represent what is actually visible at the microscope — not a textbook idealisation.
- The relative size and number of cells in a group must be faithful to the specimen.
Common Mistakes
- Drawing cell walls as a single thick line instead of two fine lines — the most common lost mark.
- Drawing only two lines where two cells meet (forgetting the shared middle wall).
- Drawing the small vessel elements the same size as the large one.
- Shading the inside of vessel elements (they are empty in life, but on a slide they may contain stain — still, no shading is allowed).
- Adding structures that are not visible (e.g. nuclei, cytoplasm) — vessel elements are dead at maturity.
- Using an arrowhead on the label line, or omitting the label entirely.
Things to Be Careful About
- Look carefully at the actual field of view before drawing — the 'large' vessel may not be at the centre.
- Keep the three small vessels roughly the same size and shape, as a group.
- The label line should touch the wall of the chosen vessel, not float beside it.
- Do not include any cells other than the four vessel elements asked for — the question specifies the group.
Fig. 2.2 is a photomicrograph of a vascular bundle from the root of the same plant species as the stem on K1.
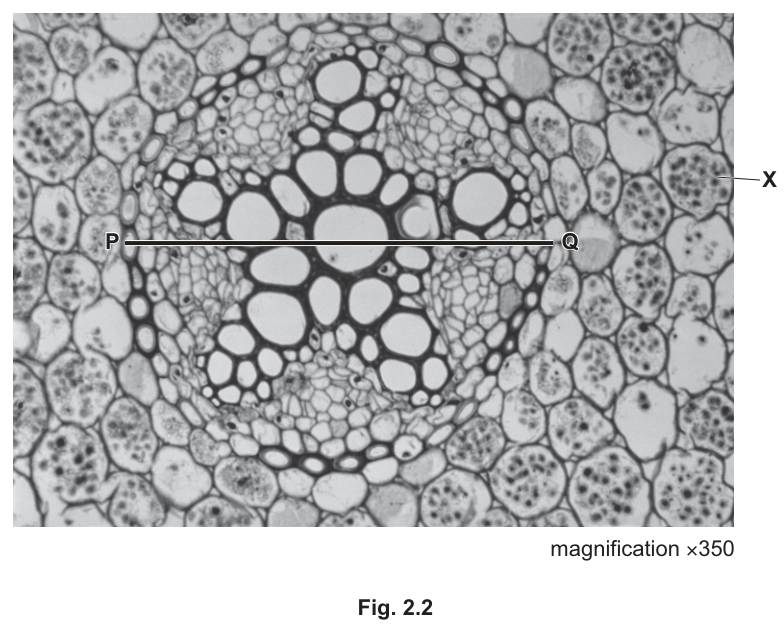
Line P–Q represents the width of the vascular bundle.
Use the magnification and the line P–Q to calculate the actual width of the vascular bundle.
Show your working and give your answer in micrometres (μm).
actual width = ______
Working
Measure the line P–Q across the photomicrograph in millimetres (representative example: 70 mm).
Answer
actual width = 200 µm
200 µm (representative value based on a measured P–Q of ~70 mm at ×350)
Background Concept
A photomicrograph is a photograph taken through a microscope. The magnification stated on the image (×350) tells you how many times larger the printed image is compared with the real specimen. To recover the actual size of a structure, you measure how long it appears in the printed image and divide by the magnification.
The key formula, rearranged from image size = actual size × magnification:
Because the answer must be in micrometres (µm), and the ruler will give you millimetres, you must multiply by 1000 (1 mm = 1000 µm) at the end.
Understanding the Question
Fig. 2.2 is a photomicrograph of a vascular bundle from the root of the same plant species, printed at ×350. The line P–Q has been drawn across the width of the bundle. You need to:
- Measure P–Q on the photomicrograph with a ruler (in mm).
- Divide that length by 350 to get the actual size in mm.
- Convert to micrometres.
The marks reward: a correct measurement with units (1), showing the division by 350 (1), and the correct final answer (1).
Approach
- Lay a ruler along the line P–Q and read its length to the nearest mm (do not estimate fractions of a mm unless your ruler is fine enough).
- Write down the measurement, including the unit (mm) — the first mark requires units.
- Show the calculation explicitly: image size ÷ 350.
- Convert mm to µm by ×1000, and give the final answer in µm.
Step-by-Step Reasoning
- Mark 1 (correct measurement of P–Q + units): The candidate's measured value should fall in the range accepted by the mark scheme (typically ± a few mm around a central value). Recording the unit (mm) is part of the mark — a bare number loses it.
- Mark 2 (division by 350): Show 'measured length ÷ 350' or equivalent substitution. The mark is for the method, not the arithmetic.
- Mark 3 (correct answer): The final number in µm must match the candidate's own measured value. The mark scheme allows error carried forward — if your measurement was 72 mm instead of 70 mm, the correct answer for you is 72/350 × 1000 ≈ 206 µm, and you still earn the third mark.
For a representative measurement of 70 mm:
Key Takeaways
- Image ÷ magnification = actual size — this is the formula to remember for photomicrograph calculations.
- Always quote units at every step and at the final answer.
- Error carried forward means your final mark depends on your own measurement, not on a single 'correct' value.
- 1 mm = 1000 µm; 1 cm = 10 000 µm.
Common Mistakes
- Multiplying instead of dividing by the magnification (treating the magnification as a scale-up factor — but it already is; you must undo it).
- Forgetting the unit conversion (mm → µm) and giving the answer in mm.
- Omitting the unit on the final answer.
- Measuring in cm but writing mm, or vice versa.
- Quoting too many significant figures (the measurement is only accurate to ±1 mm, so 3 sig figs is the maximum).
Things to Be Careful About
- The line P–Q is across the vascular bundle, not across the whole root — measure from P to Q, not from the edge of the image.
- Some rulers read from the inside edge of the zero mark — align the zero carefully at P.
- If your measured value differs from the textbook, do not panic — the mark scheme accepts a range and applies error carried forward.
Identify one observable similarity and two observable differences between the vascular bundle in Fig. 2.2 and the vascular bundle on K1.
similarity
differences
1
2
Answer
Similarity
- Both vascular bundles contain xylem and phloem.
Differences
| feature | K1 (stem) | Fig. 2.2 (root) |
|---|---|---|
| shape of bundle | oval / elongated | circular (round) |
| arrangement of xylem | xylem in a single central group | xylem in a star / cross shape (radiating arms) |
| endodermis | absent | present (single ring of cells around the bundle / central cylinder) |
| vascular (sclerenchyma) cap | present (on the outside) | absent |
Any one of the similarity rows above scores 1 mark. Any two correct differences from the table score 1 mark each (2 marks total).
Similarity: both have xylem and phloem. Differences: 1 bundle shape (oval in K1 vs. circular in Fig. 2.2); 2 xylem arrangement (grouped in K1 vs. star-shaped in Fig. 2.2).
Background Concept
Vascular bundles are the transport units of vascular plants. In a dicot stem, the bundles are arranged in a ring around a central pith, and each bundle is collateral — phloem on the outside, xylem on the inside — with a sclerenchyma cap (a group of thick-walled fibres) on the very outside, just under the epidermis. The bundle is oval/elongated in cross-section.
In a dicot root, the vascular tissue is arranged differently: a central star-shaped xylem (often described as a cross or X shape) with phloem sitting between the arms of the star, all enclosed by a single layer of cells called the endodermis which surrounds the whole central cylinder (stele). There is no sclerenchyma cap.
Understanding the Question
You are looking at two images:
- K1 — a stem section on a slide (you have looked at this under the microscope in part (a)).
- Fig. 2.2 — a photomicrograph of a root vascular bundle from the same plant species.
You must record one observable similarity and two observable differences. 'Observable' is the key word: only state features you can actually see in the images, not features you would need to deduce from theory.
Approach
- Re-examine K1 (the stem section) — note the shape of the bundle, the arrangement of xylem, whether there is a fibre cap, and whether there is a clear endodermis.
- Examine Fig. 2.2 (the root) — note the shape of the bundle, the arrangement of xylem (star-shaped), and the endodermis surrounding the central cylinder.
- Find one feature that is present in both — this is the similarity.
- Find two features that differ between the two.
- State each as a short, observable phrase — avoid theoretical explanations.
Step-by-Step Reasoning
- Similarity (1 mark): Both vascular bundles contain xylem and phloem — visible as the larger, thicker-walled vessels and the smaller, thinner-walled cells beside them. Other acceptable similarities: both have thickened cell walls (in xylem); in both, xylem vessels are larger than phloem cells.
- Difference 1 (1 mark): Shape of the bundle. In K1 the bundle is oval/elongated; in Fig. 2.2 the bundle (the central stele) is circular.
- Difference 2 (1 mark): Arrangement of xylem. In K1 the xylem forms a single central group within an oval bundle; in Fig. 2.2 the xylem forms a star / cross-shape with arms radiating out.
- Difference 3 (1 mark, alternative): Presence of an endodermis — visible in Fig. 2.2 as a clear ring of cells around the central cylinder, absent from the stem bundle in K1.
- Difference 4 (1 mark, alternative): Presence of a sclerenchyma cap — present in K1 on the outer side of each bundle, absent in the root.
Any two of these differences score the 2 marks.
Key Takeaways
- 'Observable' means visible in the image — do not write features that require knowledge of the specimen to be inferred (e.g. do not write 'dicot' unless you can see a feature that proves it).
- The classic stem vs. root vascular bundle comparison turns on four observable features: bundle shape, xylem arrangement, presence of an endodermis, and presence of a fibre cap.
- Express differences as point-for-point contrasts (K1 has X; Fig. 2.2 has Y) rather than as two separate descriptions.
Common Mistakes
- Writing 'in the root the xylem is in the centre' as a similarity — this is not visible in K1 because K1 is a stem, where xylem is also inside the bundle; the visible difference is the star shape, not the central position.
- Stating that one is a stem and the other a root as a difference — this is the deduction the question sets up, not an observable feature.
- Writing inferences rather than observations: e.g. 'xylem transports water' is a function, not an observable feature.
- Giving only one difference and missing the second mark.
Things to Be Careful About
- The mark scheme says 'observable features only' — features you must take on trust (e.g. 'endodermis is present' is only acceptable if you can actually see the ring of cells in the image) score less reliably than features that are unambiguously visible.
- The endodermis in Fig. 2.2 is a clear single ring of small cells just outside the xylem — do not confuse it with the pericycle or with general cortex cells.
- 'Sclerenchyma cap' or 'fibre cap' is the dark, thick-walled region on the outside of a stem bundle; it is the 'enclosed area' you drew in part (a)(i).
The cell labelled X on Fig. 2.2 has structures that contain a storage polysaccharide.
State a suitable reagent for identifying this polysaccharide.
Answer
iodine (in potassium iodide) solution
iodine / iodine in potassium iodide
Background Concept
Plant cells store carbohydrate in the form of starch, a polysaccharide made of α-glucose units joined by 1,4-glycosidic bonds (with 1,6 branches at branch points). Starch grains are visible in many plant cells as oval, often layered (lamellated) structures inside amyloplasts.
The standard chemical test for starch is iodine in potassium iodide (I₂/KI), often just called 'iodine solution'. In the presence of starch, the iodine molecules slip inside the amylose helix and the complex turns blue-black. (With very dilute starch, the colour may be brown or orange; the test is most reliable as a positive blue-black result.)
Understanding the Question
Cell X in Fig. 2.2 is described as containing 'structures that contain a storage polysaccharide'. In a plant root, these are amyloplasts (starch grains). The question asks for a suitable reagent to identify the polysaccharide — i.e. a chemical test that confirms it is starch.
Approach
- Identify the storage polysaccharide of plant cells: starch.
- Recall the standard reagent that produces a characteristic positive result with starch: iodine in potassium iodide (or simply 'iodine solution').
Step-by-Step Reasoning
- The cell X is in the cortex of a root and contains storage polysaccharide → starch.
- The classical test for starch uses iodine solution (iodine dissolved in potassium iodide), which turns blue-black in the presence of starch.
- The mark scheme accepts either 'iodine' or 'iodine in potassium iodide' as the answer.
Key Takeaways
- Storage polysaccharide in plants = starch (in animals it is glycogen).
- Iodine in potassium iodide → blue-black with starch.
- The reagent must be applied to the specimen; heat is not required.
Common Mistakes
- Writing 'iodine' on its own is acceptable, but candidates sometimes wrongly call it 'iodide' or 'potassium iodide' alone — potassium iodide on its own does not give the test; the iodine is the active species.
- Suggesting Benedict's reagent (tests for reducing sugars) or biuret (tests for protein) — wrong target molecule.
- Adding 'and boil' — iodine test is performed at room temperature.
- Confusing the starch test colour: the positive colour is blue-black, not purple, not brown (a faint brown/orange is negative or too dilute).
Things to Be Careful About
- The question asks only for the reagent, not the result. Writing 'iodine — turns blue-black' does not lose marks but is more than is needed; writing just 'iodine' is sufficient.
- 'Iodine solution' and 'iodine in potassium iodide' are interchangeable answers.