Biology 9700/21 — May/June 2025
Cambridge AS Level · AS Level Structured Questions · worked solutions for every part, with the mark scheme
Topics Biological Molecules · Enzymes · Cell Structure · Nucleic Acids and Protein Synthesis · The Mitotic Cell Cycle · Immunity · +2 more
Amylose and the triglyceride stearin are macromolecules.
Explain why amylose and stearin are macromolecules, but only amylose is a polymer.
Answer
- Both amylose and stearin are macromolecules because they are large molecules with a high relative molecular mass.
- Amylose is a polymer because it is composed of many repeated α-glucose subunits / monomers (linked by glycosidic bonds); stearin is not built from many repeated identical subunits, so it is not a polymer.
Both are large molecules; only amylose is composed of many repeated α-glucose monomers.
Background Concept
A macromolecule is a large molecule with a high relative molecular mass, normally built from many atoms. A polymer is a specific kind of macromolecule made by joining together many small, repeated subunits called monomers, usually by covalent bonds. The key distinction is repetition of identical units: not every large molecule is a polymer.
- Amylose is a polysaccharide: an unbranched chain of many α-glucose monomers joined by α-1,4-glycosidic bonds. It is large and made of repeated identical monomers, so it is both a macromolecule and a polymer.
- Stearin is a triglyceride: one glycerol molecule esterified to three stearic acid (fatty-acid) chains. It is large, but it is not built from many repeated identical subunits — there are only three fatty-acid residues on one glycerol. So stearin is a macromolecule but not a polymer.
Understanding the Question
The question names two specific biological molecules and asks for two separate reasons: why both count as macromolecules, and why only one is a polymer. Each reason must be tied to the structure of the named molecule.
Approach
State the definition of each term in one short sentence, then apply it to each named molecule. The macromolecule mark is earned by referring to size/molecular mass; the polymer mark is earned by referring to many repeated identical subunits (α-glucose for amylose). Do not describe the whole molecule — only the part of the structure that matches the definition.
Step-by-Step Reasoning
- Macromolecule criterion = large molecule / high molecular mass. Both amylose (long chain of glucose units) and stearin (three long fatty-acid chains on a glycerol) satisfy this. Award one mark for stating that both are large.
- Polymer criterion = many repeated identical subunits / monomers. Amylose is made of many α-glucose monomers, so it qualifies. Stearin is not made of many repeated identical units, so it does not. Award one mark for making this comparison.
Key Takeaways
- All polymers are macromolecules, but not all macromolecules are polymers.
- The defining feature of a polymer is repeated identical subunits, not just size.
- Triglycerides are large but not polymeric because they have only three fatty-acid chains on one glycerol.
Common Mistakes
- Stating that both molecules are polymers, or that neither is a macromolecule.
- Writing the rejected phrasing "composed of more than one molecule" for macromolecule — the mark scheme ignores this.
- Saying stearin is a polymer because it is "large" — size alone does not define a polymer.
Things to Be Careful About
- Keep the two definitions separate: one sentence for macromolecule, one for polymer.
- For amylose, name the monomer (α-glucose) so the mark scheme's "alpha glucose" credit is clearly earned.
- The mark-scheme word residues / subunits is acceptable in place of monomers.
Students used the enzyme maltase extracted from the fungus Aspergillus oryzae to investigate the properties of enzymes.
Fig. 1.1 is a diagram of a maltose molecule.
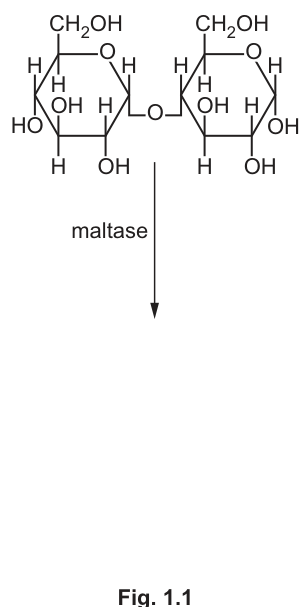
Answer
The completed Fig. 1.1 shows two α-glucose molecules as the products:
- Left α-glucose with the –OH on C1 facing downwards (α-configuration).
- Right α-glucose with the –OH on C4 facing downwards.
- H₂O written above the reaction arrow (showing hydrolysis).
Two α-glucose molecules drawn as products, with –OH on C1 downwards on the left, –OH on C4 downwards on the right, and H₂O above the arrow.
Background Concept
Maltase is a disaccharidase enzyme that hydrolyses the disaccharide maltose into two molecules of α-glucose. Maltose is two α-glucose units linked by an α-1,4-glycosidic bond; hydrolysis breaks this bond by adding a molecule of water, with –H going to one side of the bond and –OH to the other, restoring the free hydroxyls on C1 (of the left glucose) and C4 (of the right glucose).
In a Haworth projection, the α-configuration of D-glucose is shown by the –OH on C1 pointing below the plane of the ring. The –OH on C4 in α-D-glucose also points below the ring by default, so once the bond is broken the right glucose naturally displays the correct orientation on C4.
Understanding the Question
Fig. 1.1 shows one maltose molecule with the bond to be cleaved indicated by the downward arrow and the word "maltase". The candidate must:
- Replace the single maltose with the two product α-glucose molecules.
- Show the free –OH groups in the correct (α) orientation on the carbons that were previously joined.
- Add H₂O above the arrow to indicate that water is added during the reaction.
Approach
First, identify the products from the enzyme–substrate relationship: maltase + maltose → 2 α-glucose (hydrolysis). Then redraw each half of the original maltose as a free α-glucose Haworth projection, restoring the free hydroxyl on the carbon that was previously bonded, keeping it in the α-orientation (–OH below the ring). Finally, write H₂O above the reaction arrow — its position is specified by the mark scheme.
Step-by-Step Reasoning
- Identify the products. Maltose is a disaccharide of two α-glucose units; hydrolysis yields two α-glucose molecules. (Mark 1 for the first α-glucose drawn correctly.)
- Draw the left α-glucose with –OH on C1 pointing downwards. This is the α-anomer (–OH on the anomeric C1 below the ring). (Mark 1.)
- Draw the right α-glucose with –OH on C4 pointing downwards. C4 in α-D-glucose has its –OH below the ring by default, so once the bond is broken this is the natural orientation. (Mark 1.)
- Add H₂O above the reaction arrow. This identifies the reaction as a hydrolysis. (Mark 1 — though the mark scheme groups this with the third mark above.)
- Apply error carried forward (ecf). If the same mistake is made on both glucoses (e.g. omitting the –H on C5 in both), credit is still given. An error on only one side is not forgiven.
Key Takeaways
- Maltase hydrolyses the α-1,4-glycosidic bond in maltose, giving two α-glucose molecules.
- Hydrolysis is shown on a reaction scheme by writing H₂O above the arrow.
- In a Haworth projection, the α-anomer has –OH on C1 below the ring.
Common Mistakes
- Drawing β-glucose instead of α-glucose (–OH on C1 pointing up).
- Forgetting to redraw the –OH groups on C1 (left) and C4 (right) that were previously hidden inside the bond.
- Writing H₂O below the arrow — the mark scheme explicitly rejects this.
- Drawing only one glucose and leaving the other half of the original molecule unchanged.
- Failing to redraw both products as free sugars (the new free –OH on each anomeric carbon is essential).
Things to Be Careful About
- Both products must be α-glucose with –OH on the appropriate carbon pointing downwards.
- The CH₂OH group on C6 stays pointing upwards in both α-D-glucose Haworth projections.
- Water must be placed above the arrow, never below.
- An identical error on both glucoses is tolerated (ecf); an error on only one is not.
Answer
Glycosidic (bond).
Glycosidic (bond)
Background Concept
Disaccharides such as maltose, sucrose and lactose are formed when two monosaccharides join in a condensation reaction, releasing a molecule of water. The covalent bond that forms between them is the glycosidic bond — specifically, in maltose it is the α-1,4-glycosidic bond. When the bond is broken during hydrolysis, the water that was originally lost is added back across the bond.
Understanding the Question
This is a one-mark recall question following the diagram of maltose. The candidate must name the type of covalent bond joining the two glucose units in maltose.
Approach
Recall the standard term for the bond between two sugars in a disaccharide: the glycosidic bond. The mark scheme also accepts the variant spelling glucosidic; it rejects any addition that contradicts the actual α-1,4 link in maltose.
Step-by-Step Reasoning
- Maltose is built from two glucose units linked by a covalent bond formed in condensation.
- The name of this bond is glycosidic.
- The mark scheme accepts "glycosidic" (or "glucosidic") and ignores any extra detail that is wrong (e.g. "β-1,6" would be rejected because it contradicts the α-1,4 link present in maltose).
Key Takeaways
- The covalent bond between two sugar units in a disaccharide is a glycosidic bond.
- "Glucosidic" is accepted as an alternative spelling.
Common Mistakes
- Writing "hydrogen bond" or "peptide bond" — these are different bond types.
- Adding incorrect extra detail (e.g. "β-1,6-glycosidic") that contradicts the α-1,4 link actually present in maltose.
Things to Be Careful About
- The mark scheme accepts "glucosidic" as an alternative spelling.
- Do not add qualifiers that contradict the structure of maltose.
Answer
Hydrolysis.
Hydrolysis
Background Concept
Hydrolysis is the reaction in which a covalent bond is broken by the addition of a molecule of water. The H from water attaches to one side of the broken bond and the –OH attaches to the other, restoring the two free –OH (or –H) groups. In digestion, hydrolytic enzymes (such as maltase, sucrase, lactase, amylase, lipase and the proteases) catalyse the hydrolysis of larger biological molecules into their monomers.
Understanding the Question
The question follows the diagram of maltose being broken into two α-glucose by maltase. The candidate must name the type of reaction being catalysed.
Approach
Recall that a bond broken by the addition of water is a hydrolysis. The opposite reaction — forming a bond by removing water — is a condensation reaction.
Step-by-Step Reasoning
- Maltase breaks the α-1,4-glycosidic bond in maltose.
- Water is added across the bond (one –H to the left glucose, one –OH to the right glucose).
- Bond-broken-by-water = hydrolysis.
Key Takeaways
- Hydrolysis = bond broken by water.
- Condensation = bond formed by removal of water.
- Maltase is one of many hydrolytic enzymes involved in digestion.
Common Mistakes
- Writing "condensation" — this is the reverse reaction (water removed, bond formed).
- Writing "digestion" — too vague; "hydrolysis" is the precise biochemical term.
Things to Be Careful About
- The mark scheme accepts only "hydrolysis"; do not add qualifiers (e.g. "acid hydrolysis") unless they are correct.
In mammals, the small intestine is the main site of absorption of the products of digestion.
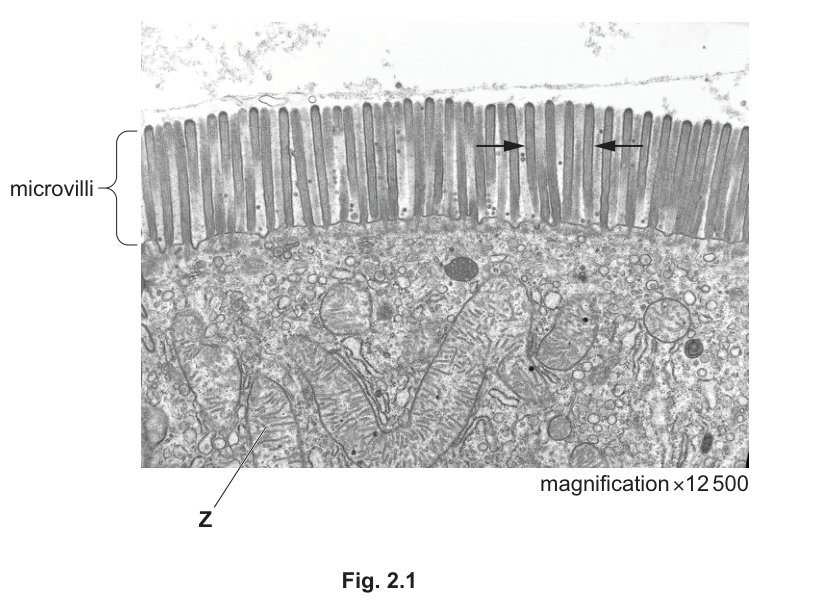
Fig. 2.1 is a transmission electron micrograph of a longitudinal section (L.S.) of part of an epithelial cell from the small intestine of a mammal.
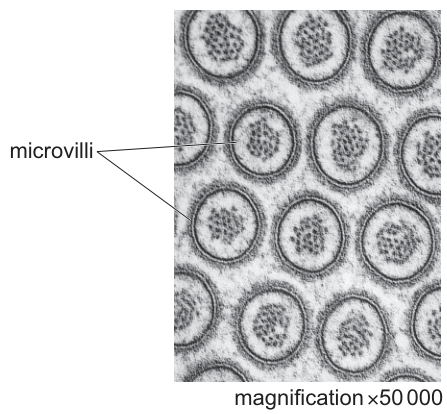
Fig. 2.2 is a transmission electron micrograph of a horizontal section made at the position indicated by the two arrows in Fig. 2.1.
Microvilli and cilia are cell structures.
Describe how the structure of cilia differs from the structure of the microvilli visible in Fig. 2.1 and Fig. 2.2.
Answer
- Cilia are composed of microtubules (made of tubulin), whereas microvilli are composed of microfilaments (made of actin).
- In a horizontal/transverse section, cilia show a 9 + 2 arrangement of microtubules (an outer ring of 9 doublets surrounding a central pair); microvilli do not show this arrangement.
- (AVP) Cilia are attached to a basal body at their base; cilia contain the motor protein dynein which produces their bending movement.
Cilia have microtubules (not microfilaments/actin) and a 9+2 arrangement in cross-section; microvilli have actin microfilaments and no 9+2 pattern.
Background Concept
Cilia and microvilli are both finger-like extensions of the plasma membrane, but they have entirely different internal cytoskeletons and therefore very different functions.
Microvilli are non-motile projections of the apical membrane. Inside each microvillus is a bundle of parallel actin microfilaments (made of the protein actin) anchored at the tip and base. The actin core gives the microvillus its rigid, cylindrical shape and is held in place by villin and fimbrin, with the whole bundle rooted in the terminal web at the cell apex. Microvilli are essentially a device for increasing apical surface area — they do not move.
Cilia are motile (or sometimes sensory) projections of the plasma membrane built around a structure called the axoneme. The axoneme consists of a ring of nine outer microtubule doublets surrounding a central pair of single microtubules — the 9 + 2 arrangement. The microtubules are polymers of tubulin, and the motor protein dynein generates sliding between adjacent doublets, producing a bending beat. At the base of every cilium is a basal body, a short cylinder of nine microtubule triplets that anchors the cilium and templates its assembly.
Understanding the Question
The question provides two TEMs of microvilli — a longitudinal section (Fig. 2.1) and a horizontal section (Fig. 2.2, taken at the level of the arrows). The horizontal section is the one that would show the 9 + 2 arrangement if the structures were cilia rather than microvilli. The candidate must describe how cilia differ structurally from what is seen.
The command word is describe the structural difference, so candidates need named cytoskeletal components and arrangement — not function.
Approach
The strategy is to recall the cytoskeletal composition of cilia (microtubules) and the diagnostic 9 + 2 pattern seen in transverse section, then contrast both with the actin/microfilament core of microvilli. A clean two-point answer in dot form scores the available marks.
Step-by-Step Reasoning
- Composition mark. Cilia are made of microtubules (tubulin). Microvilli are made of microfilaments (actin). The mark scheme rejects any statement implying microvilli contain microtubules.
- Arrangement mark. In a horizontal (transverse) section, cilia show the 9 + 2 pattern — 9 outer doublets + 2 central singlets. Microvilli, as Fig. 2.2 shows, do not show this pattern; they appear as small circles containing a faint granular central core (the actin bundle).
- Optional AVP (any additional valid point): cilia contain dynein (motor protein responsible for beating); cilia are attached to a basal body at their base; the central pair is surrounded by a central sheath and the outer doublets have radial spokes and dynein arms.
Key Takeaways
- Microvilli = actin microfilaments, no 9 + 2 pattern, non-motile, increase surface area.
- Cilia = microtubules in a 9 + 2 axoneme, motile via dynein, anchored on a basal body.
- TEM transverse section is the diagnostic view for distinguishing these two projections.
Common Mistakes
- Saying that microvilli have microtubules (the mark scheme explicitly rejects this).
- Confusing the function of cilia (movement) with the question's demand for a structural description.
- Calling the basal body a centriole — the mark scheme rejects "centrioles".
- Saying cilia are made of protein without specifying tubulin/microtubules.
Things to Be Careful About
- Use precise terminology: microtubules and microfilaments/actin, not just "filaments".
- The 9 + 2 description refers to transverse (horizontal) section, which is the very view in Fig. 2.2 — make this connection explicit in a written answer.
A scientist measured the length and the diameter of some of the microvilli shown in Fig. 2.1 to estimate the total surface area of microvilli on the surface of the epithelial cell.
The scientist assumed that each microvillus was cylindrical in shape.
Suggest one other measurement needed to estimate the total surface area of the microvilli of the epithelial cell.
Answer
The number of microvilli (over the surface of the epithelial cell).
Number of microvilli on the surface of the cell.
Background Concept
The surface area of a cylinder is given by the formula
where is the radius (or ) and is the height (length). To find the total surface area of all the microvilli on one cell, the area of a single cylinder must be multiplied by the number of microvilli. The microvilli sit on the curved apical surface of the cell, so the area of the cell surface itself is sometimes subtracted, but the principal missing piece of information is the count.
Understanding the Question
The scientist has measured length and diameter of the microvilli (these come from Fig. 2.1) and has assumed each microvillus is a cylinder. The candidate must suggest one other measurement that is still required to estimate the total surface area of microvilli.
Approach
Think about the calculation: with length and diameter, you have the area of one cylinder. To get the total, you need to know how many cylinders there are.
Step-by-Step Reasoning
- Area of one cylindrical microvillus = (or, when microvilli are very narrow, often approximated as for the curved side).
- To scale this to the whole cell, the scientist needs the number of microvilli on the surface of the epithelial cell.
- Mark scheme note: the word "amount" or "quantity" on its own is ignored — the answer must be "number of microvilli".
Key Takeaways
- A single measurement is rarely enough to estimate a total surface area; you also need a count and (usually) a reference area to subtract.
- The "count the structures" step is a common planning move in any quantitative microscopy estimate.
Common Mistakes
- Writing "amount" or "quantity" of microvilli — the mark scheme ignores these.
- Repeating length or diameter (these are already given).
- Suggesting the area of the apical surface of the cell — useful but not what the mark scheme rewards; the single accepted answer is the number of microvilli.
Things to Be Careful About
- Read the question wording: "one other measurement". Give one — not a list.
Identify the organelle labelled Z in Fig. 2.1 and explain why there is a large number of these organelles in the epithelial cells of the small intestine.
organelle ______
explanation ______
Answer
Organelle Z: mitochondrion
Explanation: Many mitochondria are present because the epithelial cell carries out large amounts of active transport / active uptake (and endo/exocytosis) of the products of digestion across the plasma membrane, and mitochondria provide the ATP required for these processes.
Z = mitochondrion; many are present because they provide ATP for the active transport (and endo/exocytosis) of digested products across the epithelial cell.
Background Concept
The mitochondrion is the organelle responsible for aerobic respiration and the bulk synthesis of ATP in eukaryotic cells. ATP is the immediate energy currency that powers energy-requiring processes. In an absorptive epithelial cell, much of the uptake of the products of digestion (e.g. glucose, amino acids) from the lumen into the cell — and from the cell into the blood across the basolateral membrane — happens by active transport through carrier proteins, and therefore requires ATP. Some uptake also occurs by endocytosis of larger molecules and exocytosis at the basolateral surface, both of which are ATP-dependent.
A TEM shows mitochondria as oval/elongated organelles with a double membrane; the inner membrane is highly folded into cristae, giving a characteristic appearance in section. They are typically abundant near regions of high ATP demand.
Understanding the Question
The question shows a TEM of an intestinal epithelial cell with a structure labelled Z. The candidate must (1) name Z and (2) explain why these organelles are numerous in the small intestine epithelium.
The command word for the explanation is explain, so the candidate must give a reason, not just describe the organelle.
Approach
- Step 1: recognise the organelle from its double-membrane, oval shape — a mitochondrion.
- Step 2: link the function of the cell (active absorption of digested products) to the function of the organelle (ATP production). The link is energy-requiring membrane transport.
Step-by-Step Reasoning
- Identification (1 mark). Z is a mitochondrion — an oval organelle with a double membrane, visible in the cytoplasm of the epithelial cell below the microvilli.
- Explanation (1 mark). The microvilli enormously increase the surface area for absorption. The cell takes up many of the products of digestion (glucose, amino acids, vitamins, minerals) by active transport (and some by endo/exocytosis) across its apical and basolateral membranes. Active transport requires ATP, and mitochondria are the sites of aerobic ATP production. Hence many mitochondria are present.
Key Takeaways
- "Many mitochondria = high ATP demand" is a recurring CIE structural/functional theme.
- In the small intestine epithelium, the high ATP demand comes mainly from active transport, not from "absorption" per se (the mark scheme explicitly ignores the bare word "absorption").
- Other valid ATP-requiring functions: synthesis of carrier proteins/enzymes/mucus; movement of organelles within the cell.
Common Mistakes
- Writing "absorption" without specifying active transport/endocytosis/exocytosis — the mark scheme ignores the unqualified word "absorption".
- Writing "makes energy" without saying ATP.
- Naming the organelle wrongly (e.g. saying "Golgi" or "vesicle") because the structure's shape is unfamiliar.
- Writing only the function of the organelle without linking it to a specific ATP-requiring process in this cell.
Things to Be Careful About
- The word "ATP" is essentially required. The mark scheme accepts "provides energy" only if ATP is not mentioned — and the better answer names ATP specifically.
- "Many" must be explained by a reason, not just restated.
Bacteria are found attached to epithelial cells in the intestines of mammals.
Describe how the organisation and distribution of DNA in epithelial cells differs from the organisation and distribution of DNA in bacterial cells.
Answer
- Organisation of DNA: In epithelial (eukaryotic) cells, the DNA is linear and is associated with histone (basic) proteins to form chromatin. In bacterial (prokaryotic) cells, the DNA is a single, circular molecule with no histones.
- Distribution of DNA: In epithelial cells, the DNA is enclosed within a nucleus bounded by a nuclear envelope (nuclear membrane). In bacterial cells, the DNA lies free in the cytoplasm, with no nuclear envelope (in a region sometimes called the nucleoid).
Eukaryotic DNA is linear, histone-associated, and enclosed in a nucleus; bacterial DNA is a single circular molecule with no histones and lies free in the cytoplasm.
Background Concept
The two great domains of life differ fundamentally in how they package and compartment their genetic material.
Eukaryotic cells (e.g. mammalian intestinal epithelial cells) keep their DNA inside a membrane-bound nucleus. The DNA is in the form of linear chromosomes, each a single long double helix, and the DNA is wound around small basic proteins called histones to form nucleosomes and the higher-order fibre called chromatin. The nuclear envelope (a double membrane perforated by nuclear pores) separates transcription from translation in space and time.
Prokaryotic cells (bacteria) have a single, circular DNA molecule (sometimes called the bacterial chromosome) that is not associated with histones (although some archaeal and some bacterial proteins serve a similar packaging role). There is no nuclear membrane — the DNA lies in a region of the cytoplasm called the nucleoid, where transcription and translation can occur simultaneously. Bacteria may also carry small circular plasmids, but the question concerns the main chromosome.
Understanding the Question
The question compares the organisation (how the DNA is shaped and packaged) and the distribution (where the DNA is found in the cell) in a eukaryotic epithelial cell and a bacterial cell. Two marks — one for organisation, one for distribution.
Approach
For each aspect, name the eukaryotic feature first (the side that the mark scheme wants stated) and then optionally state the contrast with the bacterial cell. The mark scheme credits either side, so a clean one-line answer for each aspect scores the two marks.
Step-by-Step Reasoning
- Organisation (1 mark). Award for saying either:
- the DNA is linear (forms linear chromosomes), or
- the DNA is associated with histones / histone proteins / basic proteins (chromatin).
- Distribution (1 mark). Award for saying the DNA is contained within a nucleus, surrounded by a nuclear envelope / nuclear membrane(s). The mark scheme also accepts a reference to DNA in the nucleolus (although the rRNA genes there are a small fraction of the genome, it is technically accepted).
- The mark scheme gives no ora (no reverse argument) for this question — the eukaryotic side is the side that must be stated. Stating only "bacteria have a circular chromosome" does not score.
Key Takeaways
- Eukaryote DNA: linear, histones, nucleus, nuclear envelope.
- Prokaryote DNA: circular, no histones, free in cytoplasm (nucleoid), no nuclear membrane.
- Always state the eukaryotic side when the question asks about an eukaryotic cell; ora is not credited here.
Common Mistakes
- Saying only the bacterial side ("bacteria have a circular chromosome") — does not score because the mark scheme is not offering ora on this part.
- Confining the answer to "the DNA is in the nucleus" without saying anything about its organisation — earns only 1 of the 2 marks.
- Saying "the DNA is on chromosomes" without qualifying it as linear chromosomes or as being associated with histones — the mark scheme wants one of these qualifiers specifically.
- Confusing chromatin with a chromosome or saying that bacteria have a nucleus (a common misconception).
Things to Be Careful About
- "Histone" must be spelled/used precisely — the mark scheme does not accept "protein" alone.
- "Nuclear envelope" is the preferred term; "nuclear membrane" is also accepted.
- Do not stray into other differences (size, ribosomes, membrane-bound organelles) — the question is specifically about DNA.
Scientists investigated the progress of reactions catalysed by two enzymes: dopa oxidase and neutrase. The reactions catalysed by these enzymes result in changes to the appearance of the reaction mixtures.
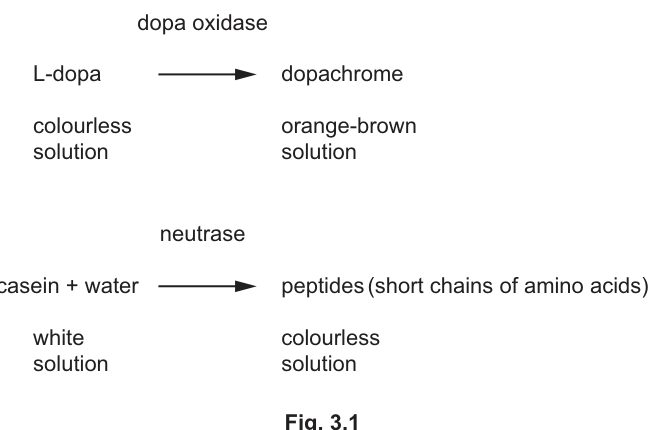
The reactions are shown in Fig. 3.1.
The changes in appearance of the reaction mixtures make it possible to follow the reactions using a colorimeter.
Fig. 3.2 shows the progress of the reaction catalysed by dopa oxidase as recorded from a colorimeter.
Fig. 3.3 shows the progress of the reaction catalysed by neutrase as recorded from a colorimeter.
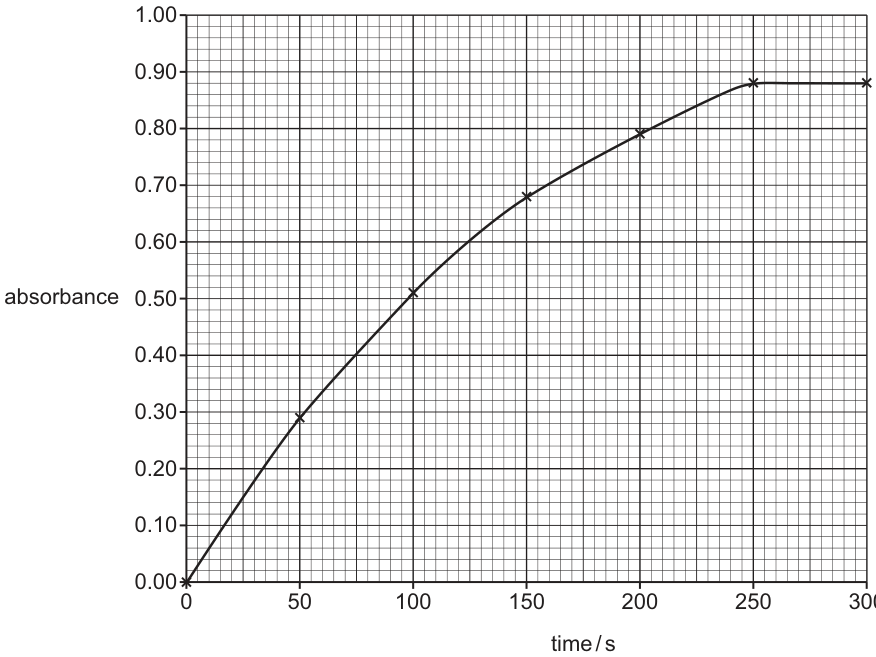
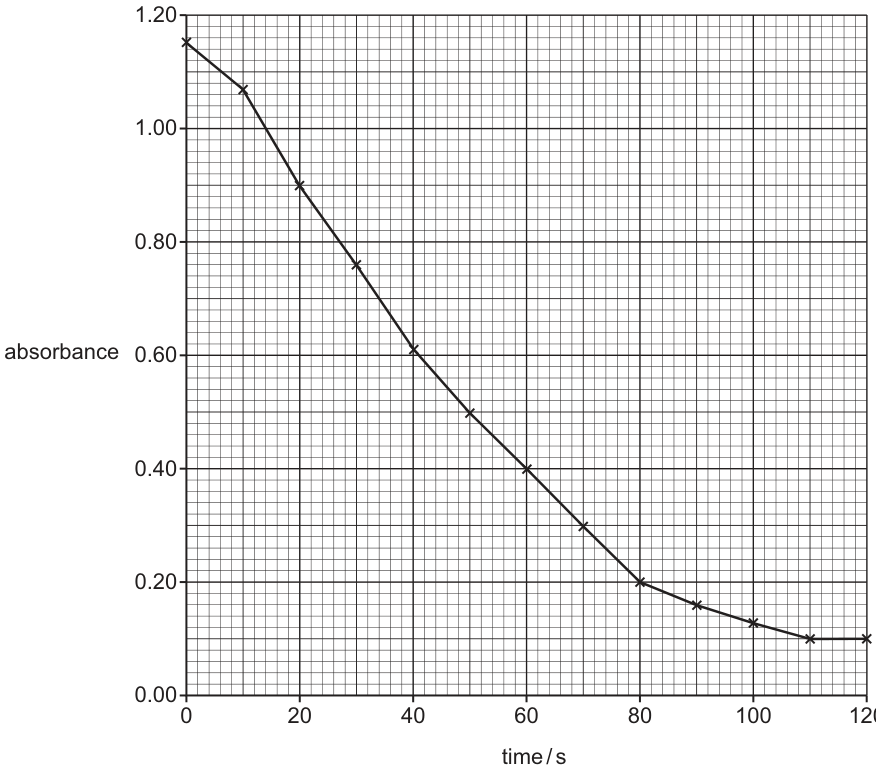
With reference to Fig. 3.1, Fig. 3.2 and Fig. 3.3, describe and explain the similarities between the progress of the two reactions.
Answer
Description
- In both reactions, the absorbance changes with time and then reaches a plateau (becomes constant). In Fig. 3.2 the absorbance increases; in Fig. 3.3 the absorbance decreases.
Explanation
- The change in absorbance is due to a change in the colour / intensity of the reaction mixture (colourless L-dopa → orange-brown dopachrome; milky-white casein → colourless peptides) as product is formed.
- The initial change in absorbance occurs because substrate molecules collide with the active sites of enzyme molecules, forming enzyme–substrate complexes and producing product.
- The plateau occurs because, eventually, all / most of the substrate has been used up, so there is little or no further product formation and the absorbance no longer changes.
See working
Background Concept
A colorimeter measures the absorbance of light by a solution. The darker or more intensely coloured the solution, the more light it absorbs, and the higher the absorbance reading. When an enzyme-catalysed reaction changes the colour (or the cloudiness) of a reaction mixture, the absorbance changes accordingly – allowing the reaction to be followed quantitatively over time.
As an enzyme-catalysed reaction proceeds, substrate molecules collide with the active sites of enzyme molecules to form enzyme–substrate (ES) complexes, which then break down to release product and regenerate the free enzyme. At the start of the reaction, when both substrate and enzyme are abundant, product is formed rapidly. As substrate is consumed, the rate of ES-complex formation gradually falls and eventually the reaction effectively stops when substrate becomes limiting.
Understanding the Question
You are given three figures:
- Fig. 3.1 – the two reactions: dopa oxidase converts L-dopa (colourless) to dopachrome (orange-brown); neutrase hydrolyses casein (white) to colourless peptides.
- Fig. 3.2 – absorbance against time for the dopa oxidase reaction. Absorbance starts at 0 and rises to a plateau of about 0.88.
- Fig. 3.3 – absorbance against time for the neutrase reaction. Absorbance starts at about 1.15 and falls to a plateau of about 0.10.
The question asks for the similarities between the progress of the two reactions. The direction of change differs (absorbance goes up in Fig. 3.2 and down in Fig. 3.3), so the question is asking about the overall shape of the curves, not the direction. The command word is 'describe and explain', so you need to give a description of the shape as well as an explanation of why the shape is what it is.
Approach
- Identify the common feature of both graphs: an initial period during which absorbance changes, followed by a plateau.
- Explain why absorbance changes – because the colour / cloudiness of the reaction mixture is changing (in opposite directions in the two reactions).
- Explain why the curve is steepest at the start – because substrate and enzyme molecules are colliding frequently and ES complexes are forming rapidly.
- Explain why the plateau is reached – because, eventually, the substrate is used up and the rate of product formation falls to zero.
Step-by-Step Reasoning
Description (1 mark)
Both graphs show an initial period during which absorbance changes, and then a time after which there is no further change – the curve reaches a plateau. The change in absorbance is in opposite directions in the two reactions, but the overall pattern of change-then-plateau is the same.
Explanation (2 marks from the 3 possible points)
-
Point 1 – why absorbance changes:
The absorbance changes because the colour (or cloudiness) of the reaction mixture is changing as product is formed. In the dopa oxidase reaction, colourless L-dopa is being converted into orange-brown dopachrome, so the absorbance rises. In the neutrase reaction, the white, cloudy casein is being broken down into colourless peptides, so the absorbance falls. -
Point 2 – why the curve is steepest at the start:
The initial rapid change in absorbance occurs because there is plenty of substrate and enzyme available. Substrate molecules collide with the active sites of enzyme molecules, ES complexes form, and product is made at a high rate. -
Point 3 – why the curve plateaus:
The plateau is reached when all (or most) of the substrate has been used up. With little or no substrate left, few new ES complexes can form, so product is no longer being made and the absorbance stops changing.
Key Takeaways
- A progress curve for an enzyme-catalysed reaction typically shows an initial period of rapid change followed by a plateau.
- The shape of the curve is the same regardless of the direction of the colour change.
- A colorimeter converts a visible change in colour or cloudiness into a measurable, numerical absorbance value.
Common Mistakes
- Saying the rate of reaction increases throughout both reactions – in fact, the rate decreases as substrate is used up.
- Failing to mention the plateau / the fact that the reaction effectively stops.
- Saying 'reactants are used up' – the mark scheme specifically ignores this wording; only 'substrate' is credited.
- Confusing the two graphs and giving the wrong direction of change for one of them.
- Forgetting the explanation and giving only a description (this earns only 1 of the 3 marks).
Things to Be Careful About
- The question asks for similarities, not differences, so do not focus on the opposite direction of the two curves.
- The 'change in absorbance' point must be linked to the 'plateau' part to earn the first mark.
- 'Describe and explain' means you need both – a description without an explanation, or vice versa, will lose marks.
Suggest two advantages of using a colorimeter to investigate the progress of reactions such as those shown in Fig. 3.1.
Answer
Any two from:
- A colorimeter gives quantitative / numerical readings (rather than descriptive observations by eye).
- The numerical values can be used to plot graphs of the reaction progress.
- Readings can be taken continuously without having to take samples of the reaction mixture at intervals.
- The results are not subjective – they are not influenced by the judgement of the observer.
- The readings can be used to determine rates of reaction (e.g. from the gradient of the graph).
- A colorimeter can detect very small changes in colour or cloudiness that the eye cannot.
See working
Background Concept
A colorimeter is an instrument that measures the absorbance of light by a coloured or cloudy solution. It produces a numerical value that is directly proportional to the concentration of the substance absorbing the light (within a suitable range, given by the Beer–Lambert law). It is therefore a quantitative tool, in contrast to a purely visual observation which is qualitative and depends on the observer's judgement.
Understanding the Question
The question asks for two advantages of using a colorimeter (rather than some other method such as visual observation or sampling at intervals) to follow reactions like those in Fig. 3.1. The advantages should be specific to the situation: a reaction in which the colour or cloudiness of the reaction mixture is changing.
Approach
Think about what a colorimeter offers that simpler methods do not:
- Numerical (quantitative) data instead of descriptive observations.
- Continuous recording instead of discrete time points.
- Objective readings that are not influenced by the observer.
- The ability to compare readings to a calibration curve and obtain actual concentrations.
- The ability to detect very small changes in colour / cloudiness that the eye might miss.
- The ability to determine rates of reaction directly from the data.
You only need to give two of these, but each must be a distinct, specific idea.
Step-by-Step Reasoning
- Quantitative readings: A colorimeter gives a numerical absorbance value for each reading, so the data can be analysed statistically and compared precisely between experiments.
- Plotting graphs: The numerical values can be plotted on a graph (e.g. absorbance against time) to give a clear picture of the progress of the reaction.
- Continuous readings: The colorimeter can be set to take readings at frequent intervals (or even continuously), so the progress of the reaction can be followed without having to remove samples from the reaction mixture at each time point, which would otherwise disturb the reaction.
- Objective results: The readings are not influenced by personal judgement, so the results are objective and free from observer bias.
- Rates of reaction: Because the data are numerical and can be plotted as a curve, the rate of reaction at any time can be found from the gradient of the curve.
- Detecting small changes: A colorimeter is much more sensitive than the eye and can detect very small changes in colour or cloudiness.
- Calibration curve: With a calibration curve of absorbance against concentration, the actual concentration of product at any time can be determined.
Key Takeaways
- A colorimeter converts a visible change in colour or cloudiness into numerical data, enabling quantitative analysis.
- A colorimeter is objective, so it removes observer bias.
- A colorimeter can be read continuously, providing a detailed progress curve without disturbing the reaction.
- With a calibration curve, absorbance can be converted into concentration.
Common Mistakes
- Saying 'more accurate' or 'more precise' without explaining how or why – these terms need context to be credited.
- Saying 'continuous data' on its own – the mark scheme specifically ignores this wording. The advantage is the ability to take readings continuously without having to take samples.
- 'Human error' is too vague.
- Saying it gives instant results – this is not specific to a colorimeter.
Things to Be Careful About
- Each advantage must be a specific, concrete benefit, not a general property of scientific instruments.
- Avoid vague 'it's better' type answers – the mark scheme credits specific points only.
Scientists searching for a suitable enzyme to use in an industrial process isolated the bacterium Vibrio parahaemolyticus from the mouth of the Mediterranean eel, Muraena helena.
The scientists discovered an enzyme in the bacterium that was suitable for the industrial process. The scientists named the enzyme VpSP37.
The scientists investigated how the rate of reaction catalysed by VpSP37 is affected by the concentration of its substrate. The results of the investigation are shown in Fig. 3.4.
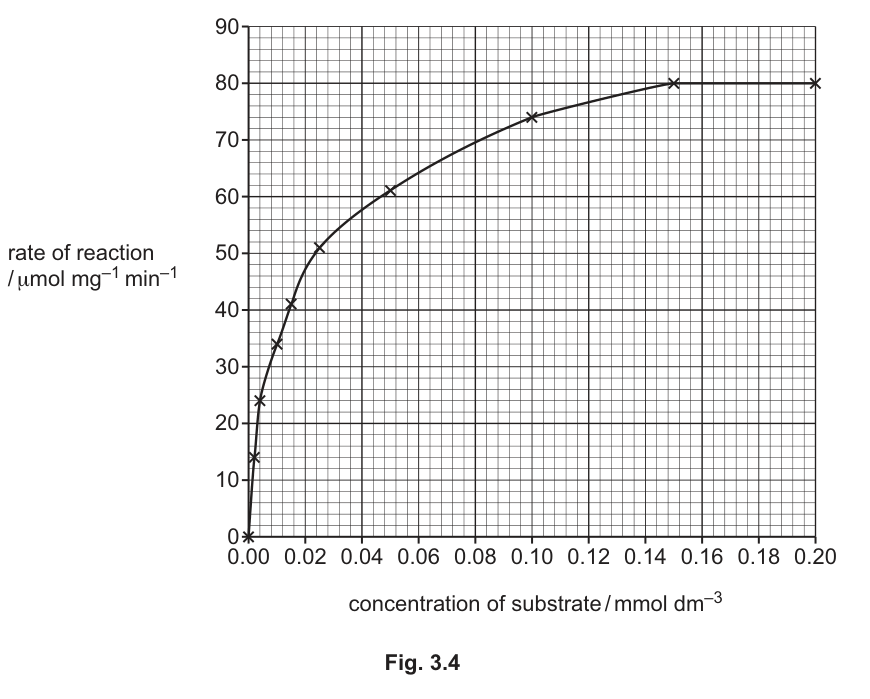
Calculate the Michaelis–Menten constant, , for the enzyme VpSP37 using the information in Fig. 3.4.
Show your working.
= ______
Working
From Fig. 3.4, the plateau of the curve is at a rate of , so:
Half of this is:
Reading horizontally across Fig. 3.4 from a rate of to the curve, then dropping vertically to the x-axis, the corresponding substrate concentration is approximately .
Answer
Km = 0.014 mmol dm⁻³
Background Concept
The Michaelis–Menten constant, , is the substrate concentration at which an enzyme-catalysed reaction proceeds at half of its maximum rate (). It is a measure of the affinity of the enzyme for its substrate: a low indicates high affinity (the enzyme reaches half its maximum rate at a low substrate concentration), while a high indicates low affinity.
The rate of an enzyme-catalysed reaction increases with substrate concentration up to a maximum, , which is reached when all of the enzyme active sites are saturated with substrate. The curve on a rate-versus-substrate-concentration graph therefore has the characteristic shape shown in Fig. 3.4.
To find from such a graph:
- Read from the plateau of the curve.
- Halve this value to get .
- Draw a horizontal line from on the y-axis to the curve, then drop a vertical line down to the x-axis. The substrate concentration at this point is .
Understanding the Question
You are given Fig. 3.4, a graph of rate of reaction (in ) against substrate concentration (in ) for the enzyme VpSP37. The curve plateaus at a rate of . You need to find the substrate concentration at which the rate is half this value, , and give the answer with the correct unit.
Approach
- Identify from the plateau of the curve in Fig. 3.4.
- Halve it to get .
- Read the corresponding substrate concentration from the curve.
- Give the answer with the correct unit.
Step-by-Step Reasoning
Step 1 – Read
The curve in Fig. 3.4 plateaus at a rate of . So .
Step 2 – Calculate
Step 3 – Read the corresponding substrate concentration from the graph
Draw a horizontal line from the rate of on the y-axis to the curve in Fig. 3.4. Then drop a vertical line from that point on the curve down to the x-axis. The x-axis is read in , with major gridlines every and minor gridlines every . The vertical line meets the x-axis at a substrate concentration of approximately .
Step 4 – State the answer with the correct unit
(equivalently )
Key Takeaways
- is defined as the substrate concentration at which the rate is half of .
- can be read directly from a rate-versus-substrate-concentration graph by halving and reading across to the curve.
- A low indicates a high affinity between enzyme and substrate.
- A high indicates a low affinity between enzyme and substrate.
Common Mistakes
- Forgetting to halve and reading the substrate concentration at instead (this gives a much larger value, ~0.16 instead of ~0.014).
- Misreading the x-axis (e.g. confusing 0.014 with 0.14).
- Omitting the unit, or giving the unit as 'mmol' without the 'dm⁻³' (the unit is essential).
- Giving the unit in a different form (e.g. as , which is the unit of rate, not concentration).
Things to Be Careful About
- The unit on the answer line or in the working is essential – the mark scheme specifically requires it.
- A small reading error is acceptable; values in the range to are credited.
- Make sure the answer is given to an appropriate number of significant figures (the graph allows 2 or 3 sig figs).
The scientists discovered other enzymes that were suitable for the industrial process. These enzymes had higher values than VpSP37.
Explain the advantage of using the enzyme VpSP37 in the industrial process rather than one of these other enzymes with higher values.
Answer
- VpSP37 needs a lower concentration of substrate to reach half of / to give a high rate of reaction.
- VpSP37 has a higher affinity for its substrate than the other enzymes (because there is a better fit between the substrate and the active site of VpSP37).
- (Industrial consequence) Less substrate is needed, so the process is cheaper / more efficient at the substrate concentrations used in the process.
See working
Background Concept
is a measure of the affinity of an enzyme for its substrate. A low means the enzyme–substrate complex forms readily even at low substrate concentrations; the enzyme has a high affinity for the substrate. A high means the enzyme needs a much higher substrate concentration to reach the same rate; the affinity is lower.
The structural basis of affinity is the fit between the substrate and the active site of the enzyme. A better fit (more complementary shapes, more favourable interactions between R groups and the active-site residues) means ES complexes form more readily and dissociation is less likely, so the rate at any given substrate concentration is higher.
In an industrial process, the substrate is often a feedstock that has to be bought or produced in bulk. Using an enzyme that works efficiently at low substrate concentrations is therefore economically advantageous: less substrate is required, or dilute / cheap feedstocks can be used.
Understanding the Question
VpSP37 has a lower than other enzymes that could be used in the same industrial process. You need to explain why this is an advantage. Note that the advantage is not that VpSP37 is 'faster' in absolute terms – both enzymes may reach the same eventually – but that VpSP37 reaches a high proportion of at lower substrate concentrations.
Approach
- State the consequence of a lower : VpSP37 reaches half of at a lower substrate concentration (or gives a higher rate at a given substrate concentration).
- Link this to enzyme–substrate affinity: VpSP37 has a higher affinity for its substrate because there is a better fit between the substrate and the active site.
- (Optional, for full marks) Explain the industrial benefit: a lower concentration of substrate is needed, so the process is cheaper or can use dilute feedstocks.
Step-by-Step Reasoning
Consequence of a lower :
Because VpSP37 has a lower than the other enzymes, it reaches half of its at a lower substrate concentration. Equivalently, for a given substrate concentration, VpSP37 gives a higher rate of reaction than the other enzymes.
Why this happens – enzyme–substrate affinity:
This is because VpSP37 has a higher affinity for its substrate. The substrate fits the active site of VpSP37 more closely than it fits the active sites of the other enzymes, so enzyme–substrate complexes form more readily. (The active site and substrate are more complementary in shape and have more favourable interactions between the substrate's R groups and the active-site residues.)
Industrial advantage:
In an industrial process, this means that a lower concentration of substrate is needed to achieve a high rate of reaction. The substrate (feedstock) is often a major cost, so using VpSP37 reduces the cost of the process. It may also allow the use of dilute or impure feedstocks that would otherwise give a low rate with a higher- enzyme.
Key Takeaways
- A low indicates high enzyme–substrate affinity.
- A low means the enzyme can work efficiently at low substrate concentrations.
- In an industrial process, this can reduce substrate cost or allow the use of dilute / impure feedstocks.
- The structural basis of high affinity is a close fit between the substrate and the active site.
Common Mistakes
- Saying VpSP37 is 'faster' without qualifying 'at the same substrate concentration' (the mark scheme specifically accepts 'faster rate at the same concentration' or 'faster rate at lower concentration').
- Confusing with (they are different: is the maximum rate, is the substrate concentration at half ). The other enzymes may have a similar ; the difference is the .
- Saying the enzyme–substrate complex is formed 'more efficiently' without explaining why – the mark scheme specifically ignores this wording; only the 'better fit' explanation is credited.
- Just saying 'it is cheaper' without linking it to the substrate concentration or affinity.
Things to Be Careful About
- reflects affinity, not maximum rate. Two enzymes can have the same but different values.
- The advantage is about substrate concentration, not about absolute speed.
- The 'better fit' explanation must be in terms of structure (the substrate and active site being complementary), not in terms of vague 'efficiency'.
Cells of the immune system have cell surface receptors that detect molecules made by pathogens. One of these cell surface receptors is known as TLR8.
The gene TLR8 is found on the X chromosome in humans.
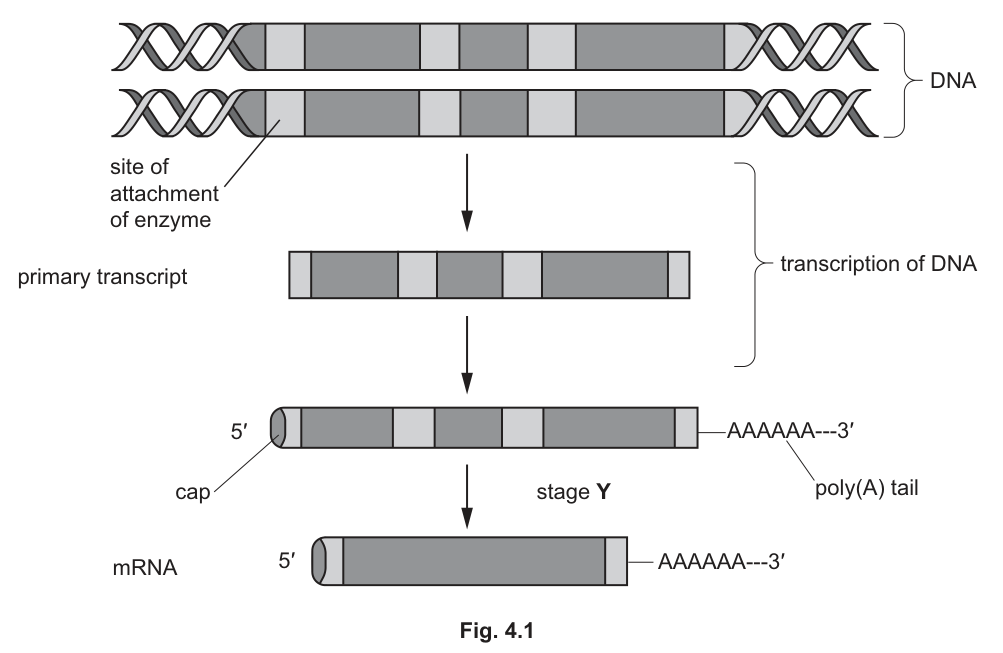
Fig. 4.1 shows the production of messenger RNA (mRNA) formed from the gene TLR8 in the nucleus of a macrophage.
Answer
RNA polymerase
RNA polymerase
Background Concept
Transcription is the synthesis of a complementary RNA copy from a DNA template. The enzyme that catalyses this reaction is RNA polymerase. In eukaryotes, RNA polymerase II is specifically responsible for transcribing protein-coding genes into pre-mRNA, while RNA polymerase I transcribes most rRNA genes and RNA polymerase III transcribes tRNA and 5S rRNA genes.
RNA polymerase binds to a promoter region upstream of the gene, unwinds the DNA double helix, and joins free RNA nucleotides together using complementary base pairing (A with U, T with A, G with C, C with G). The new RNA strand is built in the 5' to 3' direction.
Understanding the Question
Fig. 4.1 shows the gene TLR8 being transcribed inside the nucleus of a macrophage, producing a primary transcript of RNA. The question asks for the name of the enzyme that catalyses this transcription step. The single mark and the command word 'name' indicate that a one-word answer is sufficient.
Approach
Direct recall: the enzyme that makes RNA from DNA is RNA polymerase.
Step-by-Step Reasoning
The answer is RNA polymerase.
Key features of RNA polymerase in this context:
- It binds to the promoter of the TLR8 gene (shown in Fig. 4.1 as the 'site of attachment of enzyme').
- It moves along the DNA template strand, adding complementary RNA nucleotides.
- The product is the primary transcript (a single-stranded RNA copy of the gene).
The primary transcript is then modified by the addition of a 5' cap and a 3' poly(A) tail, before undergoing splicing (stage Y) to produce the mature mRNA.
Key Takeaways
- RNA polymerase is the enzyme that catalyses transcription.
- In eukaryotes, RNA polymerase II transcribes mRNA-coding genes.
- Transcription occurs in the nucleus.
Common Mistakes
- Writing DNA polymerase instead of RNA polymerase. DNA polymerase is used in DNA replication, not transcription.
- Writing helicase, which only unwinds the DNA and does not synthesise RNA.
- Confusing transcription with translation. Translation is catalysed by ribosomes (with tRNA), not by RNA polymerase.
Things to Be Careful About
- The question is worth 1 mark, so a single term is sufficient. No additional explanation is required on the exam paper.
Fig. 4.1 shows that the primary transcript is modified by the addition of nucleotides to both ends of the molecule.
The cap shown in Fig. 4.1 is a guanine nucleotide that is added to the 5′ end of RNA. The poly(A) tail added to the 3′ end consists of many adenine nucleotides. The cap and the tail have a function in stage Y and are also important for the stability and role of mRNA.
Suggest the functions of the cap and the poly(A) tail in the stability and role of mRNA.
Answer
- The cap and poly(A) tail protect the mRNA from being broken down / degraded by enzymes.
- The cap and poly(A) tail help to direct / move the mRNA through the nuclear pores, out of the nucleus, to the ribosome in the cytoplasm (so translation can occur).
The cap and poly(A) tail protect mRNA from degradation and help direct it to the ribosome for translation.
Background Concept
Eukaryotic mRNA is modified after transcription (post-transcriptional modification) before it can be translated. Two key modifications are:
- A 5' cap: a modified guanine nucleotide added to the 5' end of the primary transcript.
- A 3' poly(A) tail: a string of adenine nucleotides added to the 3' end.
These modifications serve multiple functions related to mRNA stability, nuclear export and translation.
Understanding the Question
The question asks the candidate to suggest the functions of the 5' cap and the 3' poly(A) tail in the stability and role of mRNA. Two marks are available, so two creditable points are required. The candidate should consider both stability and the role of mRNA in protein synthesis.
Approach
Consider what would happen to an mRNA without these modifications:
- Without protection, mRNA would be rapidly degraded by nucleases (exonucleases) in the cytoplasm.
- Without a mechanism to mark the mRNA, ribosomes would not know where to start translation, and the mRNA might not be efficiently exported from the nucleus.
- The cap and tail together also help prevent mRNA molecules from joining end-to-end (which would make them non-functional).
Step-by-Step Reasoning
The marking scheme accepts any two of the following credible points:
-
Protection from degradation. The cap and tail shield the ends of the mRNA from exonuclease enzymes that would otherwise break down the molecule. This extends the half-life of the mRNA in the cytoplasm, allowing more protein to be made from each transcript.
-
Preventing mRNA molecules from joining together. The cap and tail physically mark the ends of the mRNA, so two mRNA molecules cannot join end-to-end. This prevents the formation of non-functional concatenates.
-
Directing mRNA out of the nucleus. The 5' cap is recognised by nuclear export factors that carry the mRNA through nuclear pores into the cytoplasm. The poly(A) tail is also recognised by export proteins that interact with the cap-binding complex.
-
Aiding translation. The 5' cap is recognised by initiation factors that recruit the small ribosomal subunit to the mRNA. The poly(A) tail binds poly(A)-binding protein, which interacts with initiation factors to form a 'closed loop' that enhances translation. Together they ensure the 5' end enters the ribosome first.
-
AVP — e.g. ensures the correct orientation of mRNA for translation (5' end first into the ribosome).
The best two answers to pick, in an exam, are usually the stability point and the translation/export point, because these are the most fundamental and easily remembered.
Key Takeaways
- The 5' cap and 3' poly(A) tail protect mRNA from degradation by nucleases.
- They help the mRNA to be exported from the nucleus through nuclear pores.
- They aid ribosome attachment and the start of translation.
- They prevent mRNA molecules from joining end-to-end.
Common Mistakes
- Stating that the cap or tail is a start or stop codon. The start codon (AUG) is a sequence within the mRNA coding region, not a structural cap. The mark scheme explicitly rejects this.
- Saying the cap and tail 'help with translation' without specifying how (e.g. by aiding ribosome attachment).
- Confusing the function of the cap with that of the start codon.
- Describing the cap and tail in terms of DNA replication (they have no role in replication).
Things to Be Careful About
- The mark scheme rejects references to start and stop codons.
- The candidate can earn either mark for either the cap OR the poly(A) tail — they do not have to specify which modification does which function. Any two credible functions gain two marks.
- 'Protects' alone is too vague; the candidate should say what the mRNA is protected from (e.g. enzymes, degradation, breakdown).
Answer
- (Gene / RNA) splicing occurs.
- Introns are removed (from the primary transcript).
- Exons are joined / attached together to form the mature mRNA.
Gene splicing: introns are removed from the primary transcript and exons are joined together to form the mature mRNA.
Background Concept
In eukaryotes, genes are typically split into exons (expressed sequences, which code for amino acids) and introns (intervening sequences, which do not code for amino acids). When a gene is transcribed, both exons and introns are copied into the primary transcript (pre-mRNA). Before the mRNA leaves the nucleus, the introns must be removed and the exons joined together in a process called splicing.
Splicing is carried out by a large ribonucleoprotein complex called the spliceosome, which recognises specific sequences at the intron–exon boundaries. The intron is excised as a lariat structure and the exons are ligated together by phosphodiester bonds. Some genes undergo alternative splicing, in which different combinations of exons are joined, allowing a single gene to code for multiple protein variants.
Understanding the Question
The question asks the candidate to describe the process that occurs at stage Y in Fig. 4.1, which is the conversion of the primary transcript (containing both introns and exons) into the shorter mature mRNA. Three marks are available.
Approach
Recognise stage Y as splicing, then describe the key events: identification of the sequences to be removed, removal of introns, joining of exons, and the result (a shorter mature mRNA containing only coding sequences).
Step-by-Step Reasoning
The marking scheme accepts any three of the following:
- (Gene/RNA) splicing — name of the process.
- Introns are removed — the non-coding regions are excised from the primary transcript.
- Exons are joined / attached together — the coding regions are covalently linked to form the continuous coding sequence of the mature mRNA.
- The RNA molecule is shortened — the mature mRNA is shorter than the primary transcript because the introns have been removed.
- Removal of non-coding sequences / only keeping the coding sequences — explains the functional significance of the process.
- AVP — e.g. spliceosome acts on the primary transcript; phosphodiester bonds form between RNA nucleotides when exons are joined; alternative splicing can rearrange exons.
The three best points to write in an exam are:
- Splicing (the name of the process)
- Introns removed
- Exons joined together
Key Takeaways
- Stage Y in Fig. 4.1 is splicing.
- Splicing removes introns (non-coding sequences) and joins exons (coding sequences).
- The mature mRNA is shorter than the primary transcript and contains only the coding sequence needed to make the protein.
- Splicing is a feature of eukaryotic gene expression; prokaryotic mRNA does not usually contain introns.
Common Mistakes
- Writing 'DNA splicing' or 'mRNA splicing' — the mark scheme rejects these. The correct term is gene splicing or RNA splicing of the primary transcript.
- Spelling 'exons' as 'extrons' — this is rejected.
- Saying that 'introns are translated' or that introns code for amino acids — they do not.
- Confusing splicing with other forms of RNA processing (capping or polyadenylation are separate events shown earlier in Fig. 4.1).
- Saying 'the introns are translated into proteins' — this is incorrect; introns are removed before translation.
Things to Be Careful About
- The mark scheme requires the term 'gene' or 'RNA' splicing, not 'DNA splicing' or 'mRNA splicing'.
- The diagram shows both introns (light grey) and exons (dark grey); the candidate should refer to them correctly.
- Splicing is a separate event from the addition of the 5' cap and poly(A) tail, which occur before splicing (Fig. 4.1 shows the cap and tail already present before stage Y).
The nucleotide sequence TTAGGG is repeated in the direction 5′ to 3′ in the telomeres of human chromosomes.
Answer
At the ends of the chromosome / chromatid
At the ends of the chromosome (or chromatid)
Background Concept
Telomeres are specialised structures found at the ends of eukaryotic linear chromosomes. They consist of short, repetitive DNA sequences (in humans the repeat is TTAGGG) and associated proteins. Telomeres protect the chromosome ends from degradation and from being recognised as DNA damage by the cell's repair machinery.
Understanding the Question
The question asks the candidate to state where in a chromosome the telomeres are found. The single mark and the command word 'state' indicate a one-line factual answer is required.
Approach
Direct recall: telomeres are at the ends of chromosomes.
Step-by-Step Reasoning
The answer is at the ends (of the chromosome / chromatid).
In the human karyotype, each chromosome has two telomeres — one at each end of the DNA molecule. They are at the very tips of the chromatids, not in the middle (where the centromere is) and not on the sides.
Key Takeaways
- Telomeres are located at the ends of chromosomes.
- Each chromosome has two telomeres, one at each end.
- The repetitive DNA sequence is TTAGGG in humans, repeated many times in the 5' to 3' direction.
Common Mistakes
- Saying 'at the edges' or 'on the sides' — these are rejected by the mark scheme as too vague.
- Saying 'at the centromere' — the centromere is in the middle of the chromosome, not at the ends.
- Saying 'throughout the chromosome' — telomeres are specifically at the ends, not distributed throughout.
Things to Be Careful About
- 'Sides' and 'edges' are explicitly ignored by the mark scheme.
- A precise answer of 'at the ends (of the chromosome / chromatid / DNA)' is required.
Answer
- Telomeres allow DNA replication to occur many times.
- Telomeres allow (some) cells to carry out many / continuous / repeated mitoses / cell divisions.
- Telomeres prevent the loss of, genes / genetic information, from the ends of chromosomes during DNA replication.
Telomeres allow repeated DNA replication and cell division without loss of genes / genetic information.
Background Concept
DNA replication has an inherent problem at the 5' end of the lagging strand: the very last few nucleotides cannot be replicated because there is no upstream 3'-OH for DNA polymerase to extend from. This is called the end-replication problem. Without a mechanism to compensate, chromosomes would become shorter with every cell division, eventually losing important genetic information.
Telomeres solve this problem:
- They consist of many copies of a short, non-coding repetitive sequence (TTAGGG in humans) at the ends of chromosomes.
- These repetitive sequences act as a 'buffer' that can be lost without affecting coding genes.
- The enzyme telomerase (in cells that express it, such as stem cells and germ cells) can add more repeats to the telomeres, maintaining their length.
In most somatic cells, telomerase is not active, so telomeres shorten with each division. This acts as a 'molecular clock' that limits the number of divisions a cell can undergo (the Hayflick limit).
Understanding the Question
The question asks the candidate to outline the role of telomeres. Three marks are available, so three creditable points should be given.
Approach
Think about what would happen if chromosomes did not have telomeres:
- DNA replication would be incomplete at the ends.
- Genes at the ends of chromosomes would be lost over multiple rounds of replication.
- Chromosome ends might be recognised as damage and trigger cell cycle arrest or apoptosis.
- The number of mitoses a cell could undergo would be limited.
Step-by-Step Reasoning
The marking scheme accepts any three of the following:
-
Telomeres allow DNA replication to occur many times. The repetitive non-coding sequences provide a buffer so that the end-replication problem does not erode coding sequences.
-
Telomeres allow (some) cells to carry out many / continuous / repeated mitoses / cell cycles / cell divisions. Cells such as stem cells and germ cells maintain telomere length using telomerase and can therefore divide many times.
-
Telomeres prevent the loss of genes / genetic information from the ends of chromosomes. This is the key functional consequence of having telomeres — they protect the coding sequences of the chromosome.
-
AVP — e.g. telomeres prevent the ends of chromosomes from being recognised as damaged DNA; telomeres prevent the fusion of chromosome ends with other chromosomes.
Key Takeaways
- Telomeres are protective caps at the ends of linear chromosomes.
- They consist of repetitive non-coding DNA that acts as a buffer against the end-replication problem.
- They allow cells to undergo many rounds of DNA replication and mitosis without loss of coding genes.
- Telomerase maintains telomere length in stem cells, germ cells and cancer cells.
Common Mistakes
- Saying 'telomeres prevent loss of genetic material' — this is rejected by the mark scheme. The candidate must say genes or genetic information.
- Saying 'telomeres prevent loss of DNA' — this is ignored. The relevant concept is loss of coding sequences / genes, not just any DNA.
- Confusing telomeres with centromeres (which hold sister chromatids together) or origins of replication.
- Saying 'telomeres allow DNA to replicate' without explaining that this is specifically about many / repeated rounds of replication.
Things to Be Careful About
- The mark scheme explicitly ignores 'loss of genetic material' and 'loss of DNA'. The candidate must say 'loss of genes' or 'loss of genetic information'.
- The candidate should not confuse telomere function with centromere function.
Melanoma is a type of tumour that develops from pigment-producing skin cells known as melanocytes.
Outline how a tumour may form from a melanocyte.
Answer
- A mutation occurs in a gene (controlling the cell cycle) of a melanocyte.
- This leads to uncontrolled / unregulated mitosis / cell division.
- A proto-oncogene mutates to become an oncogene (or a tumour suppressor gene is inactivated / switched off).
- Normal cell cycle checkpoints no longer function / are bypassed.
- A mass of abnormal / non-functional / damaged cells forms (the tumour).
A mutation in a melanocyte's cell-cycle gene causes uncontrolled cell division (proto-oncogene to oncogene, or tumour suppressor gene switched off), bypassing normal checkpoints, forming a mass of abnormal cells (tumour).
Background Concept
Cell division in healthy tissues is tightly controlled by a network of genes and cell cycle checkpoints. Two important classes of gene are:
- Proto-oncogenes: genes that code for proteins that promote cell division (growth factors, growth factor receptors, signal-transducing proteins, transcription factors). When a proto-oncogene is mutated or overexpressed, it becomes an oncogene, which drives excessive or uncontrolled cell division.
- Tumour suppressor genes: genes that code for proteins that inhibit cell division, repair DNA damage or trigger apoptosis. When these genes are inactivated (e.g. by mutation), the brakes on cell division are released.
The cell cycle has several checkpoints (notably the G1, G2 and M checkpoints) that monitor the integrity of the DNA, the completion of DNA synthesis, and the correct attachment of chromosomes to the spindle. If these checkpoints fail, cells with DNA damage or other abnormalities can continue to divide.
Understanding the Question
The question introduces melanoma as a tumour of melanocytes (pigment-producing skin cells) and asks the candidate to outline how such a tumour may form. Four marks are available, so four creditable points should be given. The candidate should link genetic mutation to loss of cell cycle control and to the formation of a mass of abnormal cells.
Approach
Build a logical chain:
- The starting event is a genetic change (mutation) in the melanocyte.
- The mutation must be in a gene that controls the cell cycle.
- The mutation may convert a proto-oncogene to an oncogene, or inactivate a tumour suppressor gene, or both.
- As a result, cell cycle checkpoints no longer function properly.
- The cell divides repeatedly and uncontrollably, producing a mass of abnormal cells — a tumour.
Step-by-Step Reasoning
The marking scheme accepts any four of the following:
- A mutation occurs in a gene of the melanocyte (typically a gene that controls cell division).
- This leads to uncontrolled / unregulated mitosis / cell division. The cell cycle proceeds without the normal checks and balances.
- A proto-oncogene mutates to become an oncogene. The mutated gene now drives excessive cell proliferation. (Alternatively, a tumour suppressor gene is inactivated or 'switched off'.)
- Normal cell cycle checkpoints no longer function / are bypassed. The cell fails to detect or correct DNA damage or other abnormalities.
- A mass of abnormal / non-functional / damaged cells forms. This is the tumour — a clump of cells that are not organised into functional tissue.
- AVP — e.g. the tumour becomes supplied with blood vessels (angiogenesis); the cancer cells do not undergo apoptosis (programmed cell death); cancer cells ignore stop signals from other cells / have no contact inhibition.
The best four points to write in an exam are:
- Mutation in a gene
- Leads to uncontrolled / unregulated mitosis
- Proto-oncogene → oncogene (or tumour suppressor gene switched off)
- Mass of abnormal cells forms
Key Takeaways
- Tumour formation begins with a mutation in a gene that controls the cell cycle.
- The mutation may convert a proto-oncogene to an oncogene, or inactivate a tumour suppressor gene.
- Loss of cell cycle control allows uncontrolled mitosis.
- The result is a mass of abnormal cells — a tumour.
- Multiple mutations usually accumulate before a tumour becomes cancerous (malignant).
Common Mistakes
- Saying 'cells divide rapidly' without explaining why (the genetic basis of the loss of control is the key point).
- Saying 'cells become cancerous' without referring to the mutation or loss of cell cycle control.
- Confusing proto-oncogenes and oncogenes — the proto-oncogene is the normal gene; the oncogene is the mutated, overactive form.
- Saying 'cells do not undergo mitosis' instead of 'cells undergo uncontrolled mitosis'.
- Confusing tumour formation with the immune response — the question is about the cellular and genetic basis of tumour formation, not the immune system's response to it.
Things to Be Careful About
- The candidate should give a multi-step answer linking genetic change to loss of control to mass formation, not just one statement.
- 'Oncogene' on its own (without the proto-) is acceptable, but the candidate should make it clear that an oncogene is a mutated proto-oncogene.
- 'Undifferentiated' is ignored by the mark scheme; the candidate should not rely on this term.
A melanoma tumour is cancerous and may spread to other parts of the body.
T-vec is a new drug that has been developed to treat melanoma that has spread to other parts of the body, including lymph nodes.
T-vec contains a virus that infects some of the melanoma cells, causing the cells to burst and release their contents. Some of the contents of the melanoma cells act as cytokines and others act as antigens.
Explain the effects of the cytokines and antigens released from melanoma cells in stimulating the immune system to destroy the cancerous cells.
Answer
Cytokines released from the burst melanoma cells:
- Stimulate clonal expansion / division (by mitosis) of T-lymphocytes and B-lymphocytes.
- Stimulate the action of macrophages / phagocytes.
- Act as cell-signalling molecules (to coordinate the immune response).
Antigens released from the burst melanoma cells:
4. Stimulate clonal selection of specific B-lymphocytes and T-lymphocytes (those with complementary receptors).
5. Stimulate B-lymphocytes to divide (by mitosis) to form plasma cells, which secrete antibodies.
6. Antibodies bind to antigens on (remaining) cancer cells, marking them for destruction by T-killer cells / macrophages / phagocytosis.
7. T-killer cells release perforin / granzymes (or other toxins) to destroy the cancer cells.
Cytokines activate lymphocytes and macrophages; antigens trigger clonal selection, plasma cell antibody production, and T-killer cell- and phagocyte-mediated destruction of cancer cells.
Background Concept
The immune system has two complementary arms: the innate response (rapid, non-specific, involving macrophages, neutrophils and natural killer cells) and the adaptive response (slower, specific, involving B- and T-lymphocytes). Adaptive immunity is triggered when antigens (foreign, non-self molecules) bind to specific receptors on lymphocytes — a process called clonal selection. The selected lymphocytes then proliferate (clonal expansion) and differentiate into effector cells.
Two important classes of signalling molecule coordinate this response:
- Antigens are the molecular 'tags' that identify a cell or molecule as foreign (non-self). They are recognised by specific receptors on B- and T-lymphocytes.
- Cytokines are small protein messengers (e.g. interleukins, interferons) released by immune cells. They stimulate the proliferation, differentiation and recruitment of other immune cells.
B-lymphocytes that are activated by antigen binding differentiate into plasma cells, which secrete large quantities of antibodies (immunoglobulins). These antibodies bind to antigens on the surface of the target cells, marking them for destruction — a process called opsonisation. T-killer cells (cytotoxic T-lymphocytes) recognise antibody-coated or otherwise abnormal cells and kill them by releasing perforin and granzymes (and other toxins such as hydrogen peroxide), which puncture the target cell's membrane and trigger apoptosis.
Understanding the Question
T-vec is a new drug for treating metastatic melanoma. The question states that when T-vec infects melanoma cells, the cells burst and release their contents. Some of these contents act as cytokines and others as antigens. The question asks the candidate to explain the effects of these cytokines and antigens in stimulating the immune system to destroy the cancerous cells. Five marks are available.
Approach
Treat the two types of molecule separately:
- Effects of cytokines — they act as cell-signalling molecules, recruiting and activating other immune cells (lymphocytes, macrophages).
- Effects of antigens — they trigger the specific adaptive immune response (clonal selection of B- and T-lymphocytes, formation of plasma cells, antibody production, marking of cancer cells for destruction).
- Effector mechanism — the antibodies and T-killer cells destroy the cancer cells.
Build a chain of events from antigen/cytokine release → lymphocyte activation → plasma cell formation → antibody production → cancer cell destruction.
Step-by-Step Reasoning
The marking scheme accepts any five of the following credible points:
Cytokine effects:
- Cytokines stimulate clonal expansion / division (by mitosis) of T-lymphocytes and B-lymphocytes. The released cytokines act as growth factors for the lymphocytes, increasing their numbers.
- Cytokines stimulate the action of macrophages / phagocytes. Macrophages become more active in engulfing and digesting debris, and may develop into 'angry macrophages' that can kill cancer cells more aggressively.
- Cytokines act as cell-signalling molecules. They coordinate the immune response, allowing different immune cells to communicate and act together.
Antigen effects:
4. Antigens stimulate clonal selection of specific B-lymphocytes and T-lymphocytes (those with complementary receptors). The selected lymphocytes then proliferate.
5. Antigens stimulate B-lymphocytes to divide (by mitosis) to form plasma cells. Plasma cells are the antibody-secreting effector form of B-lymphocytes.
6. Plasma cells secrete / release / produce antibodies. Antibodies are specific to the cancer cell antigens.
7. Antibodies mark cancer cells for destruction by T-killer cells / macrophages / phagocytosis. This is opsonisation — tagging the cells so that immune effector cells recognise and destroy them.
8. T-killer cells release perforin / granzymes / toxins / hydrogen peroxide / hydrolytic enzymes to kill / destroy the cancer cells. Perforin makes holes in the target cell's plasma membrane; granzymes enter and trigger apoptosis.
- AVP — e.g. proteins released from the melanoma cell act as non-self antigens (because the cancer cells have abnormal proteins on their surface, such as mutated melanocyte differentiation antigens), which is what makes them visible to the immune system.
The best five points to write in an exam, in logical order, are:
- Cytokines stimulate clonal expansion of T- and B-lymphocytes.
- Cytokines stimulate macrophages.
- Antigens stimulate clonal selection of specific B- and T-lymphocytes.
- B-lymphocytes divide to form plasma cells, which secrete antibodies.
- Antibodies mark cancer cells for destruction; T-killer cells release perforin / granzymes to kill them.
Key Takeaways
- T-vec works by bursting melanoma cells, releasing antigens (which trigger specific immunity) and cytokines (which stimulate non-specific and specific immune cells).
- Cytokines are signalling molecules that activate and recruit lymphocytes and macrophages.
- Antigens trigger clonal selection of specific B- and T-lymphocytes.
- Plasma cells (differentiated B-lymphocytes) secrete antibodies that mark the cancer cells.
- T-killer cells release perforin and granzymes that kill the cancer cells by damaging their membranes and triggering apoptosis.
- This is an example of immunotherapy — using the patient's own immune system to fight cancer.
Common Mistakes
- Mixing up the effects of cytokines and antigens. Cytokines stimulate; antigens select.
- Saying 'lymphocytes kill cancer cells' without specifying how (perforin, granzymes, or antibody-mediated marking).
- Confusing T-helper cells with T-killer cells. T-helper cells coordinate the response; T-killer cells (cytotoxic T-cells) actually kill the target cells.
- Saying 'antibodies kill the cancer cells' — antibodies do not usually kill directly; they mark the cells for destruction by other immune cells (opsonisation).
- Omitting the effector mechanism (T-killer cells, macrophages, perforin, granzymes).
- Confusing melanoma antigens with MHC antigens or with self-antigens — the cancer cell proteins are non-self because they are abnormal / mutated.
Things to Be Careful About
- The candidate should give at least one mark's worth of points on cytokines and at least one mark's worth of points on antigens, because the question asks about both.
- The candidate should not write a generic 'lymphocytes destroy cancer cells' answer without specifying the type of lymphocyte (B- or T-), the effector mechanism (plasma cell, T-killer cell, antibody) and the killing method (perforin, granzymes, phagocytosis).
- 'T-cells' and 'B-cells' are accepted abbreviations for T-lymphocytes and B-lymphocytes.
Phosphate ions are absorbed from the soil solution by roots and are needed for cellular processes throughout plants.
Scientists investigated the movement of phosphate ions in flowering plants. The scientists discovered that phosphate ions in the leaves are transported from the roots in the xylem. Only a small proportion of the phosphate ions that are absorbed are transported to the growing points of the roots and shoots.
Suggest why only a small proportion of the absorbed phosphate ions are transported to the growing points.
Answer
- Most of the water moving in the xylem is carried up to the leaves in the transpiration stream, so the dissolved phosphate ions are also carried up to the leaves rather than downwards to the growing points.
- Phosphate ions are in high demand in the leaves, e.g. for the formation of ATP and NADP+ used in photosynthesis, and for phospholipids in cell membranes, so the ions are used/stored there.
Most absorbed phosphate ions follow the transpiration stream up to the leaves, where there is a high demand (e.g. for photosynthesis).
Background Concept
Plants absorb water and dissolved mineral ions, including phosphate (), from the soil through their roots. The water and ions enter the xylem and are transported throughout the plant. The bulk flow of water in the xylem is driven by transpiration: water evaporates from the moist cell walls of the mesophyll into the air spaces and out through the stomata. This loss of water creates a negative hydrostatic pressure (tension) at the top of the xylem, and the cohesive forces between water molecules (hydrogen bonds) together with their adhesion to the narrow, hydrophilic walls of the xylem vessels allow the entire water column to be pulled up from the roots without breaking. This is the cohesion–tension theory of the transpiration stream.
Because the driving force (transpiration) is located in the leaves, the net flow of water in the xylem is essentially unidirectional — from the roots, up the stem, to the leaves. Any dissolved mineral ions are carried passively with this water.
Phosphate ions have several crucial roles in plant cells:
- as part of ATP/ADP for energy transfer
- in NADP+ for the light-dependent reactions of photosynthesis
- in phospholipids of cell membranes
- in nucleic acids (DNA and RNA)
- as a component of some coenzymes
In leaves, phosphate demand is particularly high because the light-dependent reactions of photosynthesis consume large quantities of ATP and NADP+.
Understanding the Question
The question states that only a small proportion of the phosphate ions absorbed by the roots reach the growing points (meristems) at the tips of roots and shoots. We are asked to SUGGEST why this is so. We need to give biologically plausible reasons that link the structure and function of the transport tissues to the destination of the phosphate.
Approach
We think about three things:
- The direction of xylem water flow (upward to the leaves, driven by transpiration).
- Where phosphate is used in the plant (leaves have high demand).
- Whether the xylem itself extends to the very tips of the growing points (it does not — the meristems are supplied via the phloem).
We then pick the two strongest reasons to form a complete answer.
Step-by-Step Reasoning
Reason 1 — direction of water flow: The transpiration stream is overwhelmingly directed upward, from the roots to the leaves. The dissolved phosphate ions travel with this water, so most are delivered to the leaves rather than to the growing points of the roots and shoots. (Mark scheme points 1 and 4.)
Reason 2 — demand in the leaves: Leaves are the main photosynthetic organs, and the light-dependent reactions of photosynthesis require a great deal of ATP and NADP+, both of which contain phosphate. Phosphate is therefore in high demand in the leaves and is used (or stored) there. (Mark scheme point 3.)
Alternative reasons the mark scheme also accepts:
- Xylem tissue does not extend into the growing points (meristems), so the tips must obtain their phosphate via the phloem. (Point 2.)
- Phosphate ions are absorbed by roots in the zone of maturation, above the root tips. (Point 5.)
- The Casparian strip / endodermis in the root can block the apoplastic movement of phosphate, so not all of it reaches the stele in the first place. (Point 6/7 AVP.)
- Phosphate ions are needed in the roots themselves for ATP / nucleic-acid synthesis, so some is used locally. (Point 6/7 AVP.)
Key Takeaways
- The transpiration stream carries water and dissolved ions upward; what goes up is, in bulk, delivered to the leaves.
- The growing points (meristems) of roots and shoots are net sinks, not net sources, and must be supplied via the phloem.
- The endodermis and Casparian strip control which substances enter the xylem at all.
Common Mistakes
- Saying only that "phosphate is used in respiration" — in the leaves the dominant phosphate demand is photosynthesis, so photosynthesis is the more relevant example here.
- Failing to mention the direction of xylem flow explicitly.
- Stating that phosphate is not needed at the growing points — it is, but the proportion delivered there is small because most follows the transpiration stream upward.
- Confusing xylem (one-way, upward) with phloem (two-way, source-to-sink).
Things to Be Careful About
- Always state that it is the water in the xylem that carries the phosphate upward — the link to transpiration is what gives the answer biological precision.
- Specify what the phosphate is used for in the leaves (ATP, NADP+, phospholipids) rather than the vague "it is used by the plant".
- The question says "suggest" — the mark scheme accepts a range of reasonable ideas, so any two biologically defensible points will earn full marks.
Gossypium hirsutum is the most common species of plant grown for the production of cotton across the world.
Scientists carried out an investigation to trace the pathway taken by phosphate ions from the leaves of cotton plants into the stems. The scientists used a radioactive isotope of phosphorus () to trace the pathway of phosphate ions.
Some cotton plants were divided into two groups: A and B.
In group A, the scientists:
- inserted impermeable waxed paper between the xylem and phloem in the stem below a leaf of each plant
- injected a solution containing phosphate ions labelled with (labelled phosphate ions) into a vein of each leaf, as shown in Fig. 5.1.
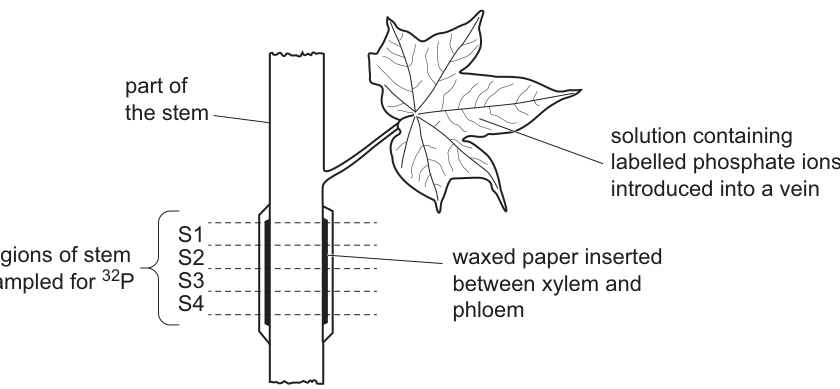
The procedure was repeated on the plants in group B but without inserting the waxed paper.
After one hour, the scientists determined the percentage of labelled phosphate ions in the four sections of the stem, S1 to S4, shown in Fig. 5.1. The results are shown in Table 5.1.
Table 5.1
| region of stem sampled | percentage of injected labelled phosphate ions in stem tissues | |||
|---|---|---|---|---|
| group A – stems with waxed paper | group B – stems with no waxed paper | |||
| phloem | xylem | phloem | xylem | |
| S1 | 12 | 1 | 15 | 5 |
| S2 | 7 | <1 | 10 | 6 |
| S3 | 13 | 0 | 5 | 2 |
| S4 | 5 | <1 | 3 | 1 |
Use Fig. 5.1 and the data in Table 5.1 to discuss the pathway taken by the solution containing phosphate ions labelled with in cotton plants.
Answer
- Phosphate ions leave the leaf mainly in the phloem: in S1 the phloem contains 12% (group A) and 15% (group B) of the injected phosphate, far more than the xylem in the same region (1% in A, 5% in B).
- The phloem transports the phosphate ions downwards in the stem: in group B the phloem values decrease steadily from S1 (15%) → S2 (10%) → S3 (5%) → S4 (3%).
- Phosphate ions can move from the phloem into the xylem (lateral transfer): in every region the xylem percentage is higher in group B (no wax) than in group A (with wax).
- The waxed paper blocks this lateral transfer: e.g. in S1 the xylem value is 1% with wax but 5% without wax; in S2 it is <1% vs 6%; in S3 it is 0% vs 2%; in S4 it is <1% vs 1%.
- Some of the phosphate ions leave the phloem and xylem and transfer into surrounding stem cells, since the total recovered in the sampled phloem and xylem of each region is well below 100% (and some may still be in the leaf after only one hour).
Phosphate leaves the leaf in the phloem and is transported downwards; some transfers laterally into the xylem, a movement which is blocked by the waxed paper.
Background Concept
Phloem translocation. The phloem is the plant's transport tissue for organic solutes (mainly sucrose) and for many mineral ions, including phosphate. Mature leaves are the main sources (net producers of photosynthate), while roots, fruits, developing seeds and the growing points are net sinks (net consumers). Solutes move in the phloem by mass flow: at the source they are actively loaded into the sieve tubes (using proton pumps and co-transporters), water follows by osmosis from the xylem, a high hydrostatic pressure builds, and at the sink solutes are unloaded and water leaves, so the bulk flow runs from high pressure (source) to low pressure (sink). Phloem flow can therefore be in any direction depending on which organ is the source and which is the sink.
Lateral transfer between xylem and phloem. Although xylem and phloem are separate conducting tissues, they lie close together in the vascular bundle, separated by only a few cell layers. Solutes (and water) can pass sideways from one to the other. This is biologically important — it allows, for example, mineral ions to be recycled from the xylem stream into the phloem for delivery to growing tissues, or for assimilates to be transferred out of the phloem into surrounding cells.
Radioactive tracers. is a radioactive isotope of phosphorus. It is chemically identical to ordinary but emits beta radiation that can be detected with a Geiger counter. By labelling phosphate ions with , the scientists can track exactly where the injected phosphate ends up after a set time.
Understanding the Question
The experimental design has two groups:
- Group A (treatment): a sheet of impermeable waxed paper is inserted between the xylem and the phloem in the stem, just below the leaf. This physically blocks any sideways movement of solutes between the two tissues.
- Group B (control): no waxed paper is inserted, so the tissues are in their normal anatomical contact and lateral transfer is possible.
Labelled phosphate is injected into a vein of the leaf, and after one hour the percentage that has reached each of four stem regions (S1, closest to the leaf, down to S4, farthest) is measured separately in the phloem and the xylem. We are asked to DISCUSS the pathway taken by the phosphate ions — in other words, to use the data to deduce the route, including the direction of flow and whether (and where) lateral transfer happens.
Approach
We work through the data systematically:
- Phloem vs xylem — where is most of the phosphate?
- The down-stem gradient in the phloem — which way is it moving?
- Group A vs group B xylem — is there evidence of lateral transfer?
- The total recovered — what does the missing fraction tell us?
For each conclusion we quote a specific data comparison to support it.
Step-by-Step Reasoning
Step 1 — Phloem is the main route out of the leaf. In every region and in both groups, the phloem contains far more labelled phosphate than the xylem. For example, in S1: A phloem = 12%, A xylem = 1%; B phloem = 15%, B xylem = 5%. The same is true in S2, S3 and S4. So the bulk of the phosphate leaves the leaf via the phloem. (Mark scheme point 1.)
Step 2 — Direction in the phloem. Looking at the phloem values in group B from top to bottom: S1 = 15%, S2 = 10%, S3 = 5%, S4 = 3%. The percentage decreases steadily as we move away from the leaf, showing that the phosphate is being carried DOWNWARDS in the phloem. The growing points of roots are typical sinks, so this downward movement makes biological sense. (Mark scheme point 2.)
Step 3 — Evidence for lateral transfer (phloem → xylem). Compare the xylem values between the two groups in each region:
| region | A (wax) xylem | B (no wax) xylem |
|---|---|---|
| S1 | 1% | 5% |
| S2 | <1% | 6% |
| S3 | 0% | 2% |
| S4 | <1% | 1% |
In every region the xylem percentage is higher in group B (no wax) than in group A (with wax). If the phosphate only came up from the roots in the xylem, the waxed paper (which is between the two tissues, not within the xylem) would have no effect on xylem values. The fact that the wax reduces the xylem count must mean that the wax is blocking phosphate that is trying to pass from the phloem into the xylem. So there is normally a sideways transfer from phloem to xylem. (Mark scheme points 3 and 4.)
Step 4 — Missing phosphate. The injected phosphate is not all accounted for in the phloem and xylem of the stem (e.g. S1 group B has 15% + 5% = 20%; where is the other 80%?). Some may still be in the leaf (the experiment ran for only one hour); some may have moved sideways into the surrounding cells of the stem (cortex, pith, parenchyma cells, vascular cambium). (Mark scheme points 6 and 7.)
Step 5 — Synthesised pathway. Phosphate is loaded into the phloem in the leaf → it travels downwards in the phloem by mass flow → along the way, some of the phosphate transfers sideways from the phloem into the xylem (and into surrounding cells) → in the control plants this lateral transfer occurs freely; in the treated plants the wax barrier prevents it.
Key Takeaways
- Phloem is the main long-distance transport route for phosphate out of mature leaves.
- Phloem transport follows a source-to-sink pattern; here the sink is below the leaf (likely the roots and other growing tissues).
- Lateral transfer between phloem and xylem is real and can be demonstrated by selectively blocking it.
- The waxed paper is a surgical tool that specifically interrupts lateral (radial) transfer without stopping longitudinal flow in either tissue.
- Radioactive tracers are a powerful method for tracking the movement of specific ions in a living plant.
Common Mistakes
- Saying the phosphate moves down in the xylem — it moves down in the phloem; only a small fraction crosses laterally into the xylem.
- Failing to compare the two groups — the comparison between A and B xylem values is the most direct evidence of lateral transfer.
- Misinterpreting the wax as blocking xylem flow upward — it is placed between xylem and phloem, so it blocks lateral transfer, not longitudinal flow.
- Quoting data from only one group or one region — the strongest conclusions come from looking at consistent trends across all four regions.
- Treating the missing phosphate as an error rather than as evidence that some is held up in the leaf or transferred to surrounding cells.
Things to Be Careful About
- The wax paper is between the two tissues; it does NOT block upward xylem flow from the roots.
- The S1 → S4 gradient in the B phloem is downward — the leaf is the source, the root is the sink.
- Always quote a numerical comparison to justify the claim of lateral transfer (e.g. "S1 xylem 1% with wax vs 5% without").
- Note the limitations of the data: not all of the injected phosphate is recovered, and only four regions of the stem are sampled.
Fig. 6.1 is a ribbon model of a molecule of haemoglobin.
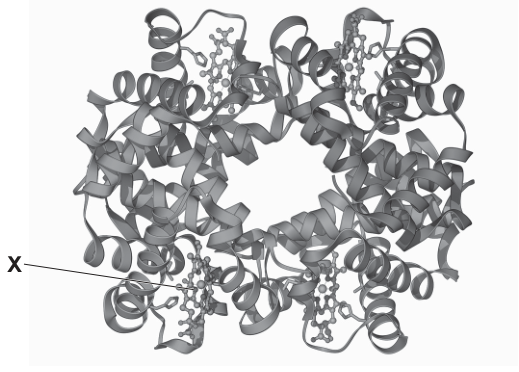
Answer
Haem (group)
Haem (group)
Background Concept
Haemoglobin is a globular, conjugated protein — a protein with a non-protein component attached. Each of its four polypeptide chains (two α and two β) carries a small non-protein ring-shaped molecule embedded in a hydrophobic pocket. This non-protein component is called a prosthetic group, and in haemoglobin it is the haem group.
The haem group is built around a porphyrin ring (four nitrogen-containing pyrrole rings joined by methine bridges) with a central iron ion (Fe²⁺) held in coordinate bonds. It is the iron that actually interacts with oxygen, not the protein chain itself. Because the prosthetic group is firmly bound, it is considered part of the functional haemoglobin molecule.
Understanding the Question
The stem shows a ribbon diagram of haemoglobin. The pointer labelled X leads to the small disc-like structure visible at the bottom-left of the molecule — the flat ring inserted into one of the four subunits. The question asks for the name of that structure.
Approach
Recognise the small ring structure with a metal ion at its centre as a haem group, distinguishing it from the polypeptide ribbons that make up the bulk of the molecule.
Step-by-Step Reasoning
- The ribbon model shows mostly coiled and folded polypeptide chains.
- The label X points to a compact, non-ribbon element — clearly a non-protein component.
- A non-protein component tightly associated with a protein is a prosthetic group; the specific prosthetic group in haemoglobin is the haem group (containing Fe²⁺).
- The mark scheme accepts "haem (group)" but does NOT accept "prosthetic group" alone (it is too general) and does NOT accept "Fe²⁺" alone (it is the ion inside the haem, not the structure as a whole).
Key Takeaways
- Haemoglobin is a conjugated protein: polypeptide + prosthetic group.
- The prosthetic group is the haem group; the iron at its centre binds oxygen.
- Four haem groups, one per polypeptide chain, allow each haemoglobin to carry up to four O₂ molecules.
Common Mistakes
- Writing "prosthetic group" — too vague; the mark scheme ignores this.
- Writing "Fe²⁺" or "iron" — the mark scheme ignores this. The iron is contained within the haem group.
- Writing "porphyrin ring" — not accepted as it is the framework of the haem group rather than its name.
Things to Be Careful About
- The label X is the haem group, not the polypeptide chain, not the whole haemoglobin, and not the iron ion on its own.
Answer
The iron in the haem group combines with (one) oxygen (molecule).
The iron in the haem group combines with (one) oxygen (molecule).
Background Concept
Oxygen is not very soluble in plasma, so it must be carried bound to a carrier protein. Haemoglobin's oxygen-binding site is the iron ion (Fe²⁺) at the centre of each haem group. The Fe²⁺ forms a reversible coordinate bond with one O₂ molecule, giving oxyhaemoglobin:
Because each haem binds one O₂, and there are four haem groups per haemoglobin, one haemoglobin molecule can carry up to four oxygen molecules. The bond is reversible, which is essential for oxygen release in respiring tissues.
Understanding the Question
Having identified X as the haem group, the question now asks what it does. The answer should be a single statement of its function in the haemoglobin molecule.
Approach
Recall that the haem group is the oxygen-binding site and that the actual binding atom is the iron ion at its centre. Frame the answer in terms of the iron + oxygen combination.
Step-by-Step Reasoning
- Function of the haem group: bind oxygen.
- The binding atom within the haem group is the Fe²⁺ ion.
- Each haem binds one O₂ (the mark scheme rejects "two or more").
- Allowed phrasings: "carries/transports/attaches oxygen" or "bonds with oxygen".
- The bond is reversible, allowing release at the tissues.
Key Takeaways
- The haem group's job is to bind one O₂ per haem via its central Fe²⁺.
- Each Hb has four haem groups, so up to four O₂ per Hb molecule.
- The bond is reversible — the basis of oxygen loading and unloading.
Common Mistakes
- Writing "binds carbon dioxide" — rejected; CO₂ is carried elsewhere (mainly as HCO₃⁻ in plasma, with some bound to globin chains, not haem).
- Writing "binds oxygen atoms" — rejected; oxygen is transported as O₂ molecules.
- Writing "binds two oxygens" or "many oxygens" — rejected; one haem binds one O₂.
- Saying only "carries oxygen" without making clear that it is the iron in the haem that does this — vague answers score zero.
Things to Be Careful About
- "Binds/attaches/combines/carries" oxygen is acceptable.
- "Oxygen atom" is wrong — it is the O₂ molecule.
Haemoglobin is described as having quaternary structure.
State what is meant by quaternary structure.
Answer
A protein that consists of more than one polypeptide chain.
More than one polypeptide chain.
Background Concept
Proteins are organised at four levels:
- Primary (1°): the sequence of amino acids linked by peptide bonds.
- Secondary (2°): regular coiling/folding (α-helix, β-pleated sheet) stabilised by H-bonds.
- Tertiary (3°): 3D folding of a single polypeptide, stabilised by H-bonds, ionic bonds, disulfide bridges and hydrophobic interactions.
- Quaternary (4°): the assembly of more than one polypeptide chain into the functional protein, with the same or different types of chain.
Haemoglobin is a classic example of a protein with quaternary structure: it has four polypeptide chains (2 α + 2 β), each with its own tertiary fold, and each carrying a haem prosthetic group. The four chains interact (hydrophobic interactions, salt bridges) to give the quaternary structure that is essential for the cooperative binding of oxygen (the sigmoidal oxygen dissociation curve).
Understanding the Question
The question gives the premise that haemoglobin has quaternary structure and asks the candidate to define what that means. The mark scheme rewards a definition focused on multiple polypeptide chains.
Approach
Give the textbook definition: quaternary structure = the arrangement of more than one polypeptide chain in a protein.
Step-by-Step Reasoning
- The mark scheme accepts "more than one polypeptide (chain)" or "2 or more".
- It rejects "more than 2", "many" or "multiple" (too vague), and ignores "amino acid chain".
- Stating the example "haemoglobin has four polypeptides" is allowed.
- A clean, textbook definition is enough for the mark.
Key Takeaways
- Quaternary structure = multiple polypeptide chains assembled into one functional protein.
- Different chains can be identical (e.g. insulin, two chains) or different (e.g. haemoglobin, α and β).
- Quaternary structure enables cooperativity and allosteric effects (e.g. Bohr shift).
Common Mistakes
- Writing "multiple", "many", or "more than 2" — the mark scheme rejects these.
- Writing "four polypeptide chains" alone is fine (allowed), but it should clearly be a definition, not just a count.
- Confusing quaternary with tertiary (3D folding of a single chain).
Things to Be Careful About
- "Polypeptide chain" is the right term — not "amino acid chain" (ignored), and not just "chain" (vague).
The effect of the partial pressure of oxygen () and the effect of the partial pressure of carbon dioxide () on the percentage saturation of haemoglobin was investigated.
A sample of mammalian blood was exposed to a gas mixture that contained increasing . In the experiment, the was maintained at . The percentage saturation of haemoglobin in the blood sample was determined as the increased.
The experiment was repeated with further samples of blood with a maintained at and at .
The results are shown in Fig. 6.2.
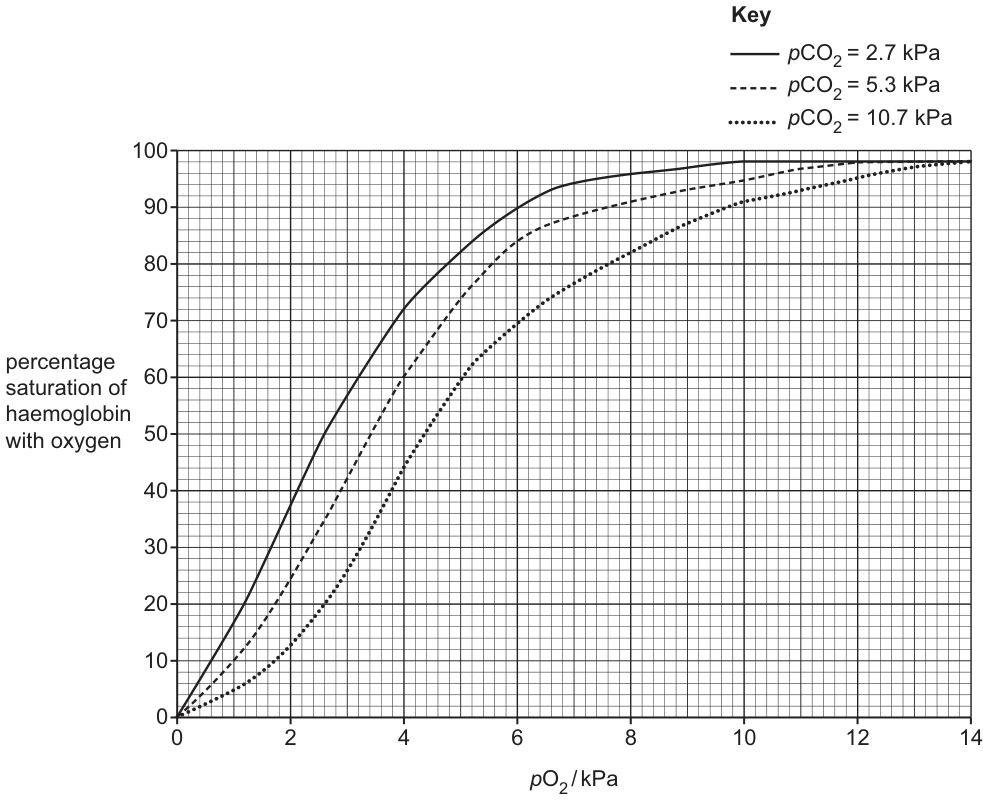
The of alveolar air is .
With reference to Fig. 6.2, state the likely partial pressure of oxygen in the alveoli of the mammal.
Answer
10–14 kPa (any value in this range).
10–14 kPa
Background Concept
Alveolar air has a high partial pressure of oxygen because fresh air is continuously delivered by ventilation. At this high pO₂, haemoglobin leaving the lungs is almost fully saturated — typically around 95–98% — which maximises the oxygen content of arterial blood.
On an oxygen dissociation curve, this corresponds to the upper plateau region: as pO₂ rises above about 8 kPa, the percentage saturation of haemoglobin approaches a maximum and is relatively insensitive to further increases in pO₂.
Understanding the Question
The stem tells us alveolar pCO₂ is 5.3 kPa, so the relevant curve is the dashed (middle) curve. The question asks for the pO₂ of the alveolar air. A precise value is impossible to read, so the mark scheme accepts a range.
Approach
Identify the dashed curve (pCO₂ = 5.3 kPa) and read off the pO₂ at which the curve is at its plateau (very high percentage saturation) — these are the values that match alveolar conditions.
Step-by-Step Reasoning
- The dashed curve reaches a near-plateau between roughly 8 and 14 kPa.
- The mark scheme accepts any value (or range) within 10–14 kPa — the upper, near-saturated part of the curve.
- A value in this range is biologically realistic for mammalian alveolar pO₂ (around 13 kPa in humans).
Key Takeaways
- Alveolar pO₂ corresponds to the upper plateau of the dissociation curve.
- Choose the curve matching the stated alveolar pCO₂ (5.3 kPa here).
- The mark scheme accepts a range, so an approximate read-off is sufficient.
Common Mistakes
- Reading a value from the wrong curve (e.g. taking a reading from the 2.7 kPa or 10.7 kPa curve).
- Giving a value in the middle of the curve (e.g. 4 kPa) — that would represent a saturating pO₂ only at the lower plateau, not the alveolar level.
Things to Be Careful About
- Match the curve by pCO₂, not just by position on the page.
- The answer is a range — there is no single correct value because the curve is essentially flat at the top.
Suggest the range of partial pressures of oxygen in respiring tissues and use Fig. 6.2 to give evidence for your answer.
Answer
Range: 1–6 kPa.
Evidence: in this range the percentage saturation of haemoglobin decreases steeply as pO₂ falls, so (oxy)haemoglobin dissociates and releases its oxygen.
1–6 kPa, with evidence that saturation decreases steeply as pO₂ falls.
Background Concept
Respiring tissues consume O₂ (for oxidative phosphorylation in mitochondria) and produce CO₂. As a result, the pO₂ inside active cells and in the tissue fluid immediately around them is lower than arterial blood, while pCO₂ is higher. The shape of the oxygen dissociation curve ensures that haemoglobin responds to this drop in pO₂ by releasing oxygen — and the steep middle portion of the curve is exactly where this unloading happens most efficiently. A small fall in pO₂ here causes a large fall in percentage saturation, so a large amount of O₂ is released.
Understanding the Question
The question asks the candidate to suggest a range of pO₂ values typical of respiring tissues, and to back up the suggestion with what Fig. 6.2 shows. Two marks: one for the range, one for the graphical evidence.
Approach
- Identify the curve matching tissue conditions. The Bohr shift (high tissue pCO₂) means the relevant curve is shifted to the right; at the tissues, pCO₂ is higher than the alveolar 5.3 kPa, so values around 5.3 kPa and above (e.g. 10.7 kPa) are plausible.
- Find the steep region of that curve — this is where small pO₂ changes give large changes in saturation, i.e. where unloading is efficient.
- Read off the pO₂ range covered by that steep region.
Step-by-Step Reasoning
- The curves are steepest in the middle, roughly between pO₂ = 1 kPa and pO₂ = 6 kPa, where saturation falls rapidly from about 80% down towards 20% or lower.
- This steep fall is precisely what is needed at respiring tissues: a small pO₂ decrease releases a lot of O₂.
- So the suggested range is 1–6 kPa.
- The graph-based evidence: in this pO₂ range the curve is steep — a fall in pO₂ produces a large decrease in percentage saturation, so haemoglobin releases its bound oxygen.
Key Takeaways
- Respiring tissues have low pO₂; the steep portion of the dissociation curve is the unloading zone.
- The shape of the curve is the "evidence": a steep drop in saturation over a small pO₂ change.
- Always anchor graph-based evidence in a specific feature of the curve.
Common Mistakes
- Giving a single figure (e.g. "4 kPa") — the mark scheme rejects a single number; a range is required.
- Just stating "saturation decreases" without referencing the graph's steep region.
- Choosing a pO₂ in the upper plateau (e.g. 12 kPa) where the curve is flat — that would not be efficient for unloading.
Things to Be Careful About
- "A single figure" is rejected; you must give a range.
- The evidence mark requires linking the steep section of the curve to oxygen release.
Use the information in Fig. 6.2 to describe the effect of increasing on the percentage saturation of haemoglobin with oxygen.
Answer
- As pCO₂ increases, the (oxygen dissociation) curve shifts to the right.
- The percentage saturation of haemoglobin (at a given pO₂) decreases as pCO₂ increases / haemoglobin has a lower affinity for O₂.
- Comparative data: at pO₂ = 4 kPa, saturation is ~75% at pCO₂ = 2.7 kPa, ~58% at pCO₂ = 5.3 kPa, and ~42% at pCO₂ = 10.7 kPa.
- The biggest difference between curves occurs in the middle of the pO₂ range; the curves converge at high pO₂ (near 100% saturation).
The curve shifts to the right; at a given pO₂ the percentage saturation of haemoglobin decreases as pCO₂ rises (with supporting comparative data).
Background Concept
The position of the haemoglobin oxygen dissociation curve depends on pCO₂ (and pH and temperature). Increasing pCO₂ lowers the affinity of haemoglobin for oxygen, so that for any given pO₂, less oxygen is bound. On a graph this appears as the curve shifting to the right (sometimes described as "the curve moves right and down").
The mechanism is the Bohr effect: CO₂ produced by respiring tissues combines with water to form carbonic acid, which dissociates to release H⁺. The H⁺ ions bind to haemoglobin and stabilise its deoxygenated (T) form, reducing O₂ affinity. More O₂ is therefore released exactly where it is needed.
Understanding the Question
The question requires a description of the effect visible in Fig. 6.2. The mark scheme awards up to 3 marks for: (1) the curve shifts to the right, (2) saturation decreases as pCO₂ increases, (3) supporting comparative data quote with both units (kPa and %). An additional point can be earned for commenting on the shape/position difference between curves.
Approach
- State the direction of the shift.
- State the change in saturation at a given pO₂.
- Read off two comparable data points (one for low pCO₂, one for high pCO₂ at the same pO₂) and quote the figures with the correct units.
- Comment on where the curves differ most.
Step-by-Step Reasoning
- Direction: comparing the 2.7 kPa curve with the 10.7 kPa curve, the latter lies to the right of the former. The whole curve shifts to the right as pCO₂ rises.
- Saturation: at the same pO₂ (e.g. 4 kPa), a higher pCO₂ gives a lower % saturation.
- Comparative data (use the same pO₂, two different pCO₂ values):
- Pattern: the biggest gap between curves is in the middle of the pO₂ range (around 2–6 kPa). At very high pO₂ (>10 kPa) the curves converge near 100% saturation.
Key Takeaways
- Higher pCO₂ → rightward shift of the curve → lower O₂ affinity.
- Always quote comparative data with units (kPa and %).
- The Bohr effect is most useful in the steep part of the curve.
Common Mistakes
- "The curve shifts downwards" — ignored by the mark scheme; the shift is to the right.
- Saying "saturation decreases" without specifying at a given pO₂ — the curves all reach about 100% at high pO₂.
- Quoting data without units, or using wrong units (e.g. mmHg instead of kPa).
- Failing to compare: quoting only one curve's data.
Things to Be Careful About
- Both units — kPa (for pO₂) and % (for saturation) — must each appear at least once in the answer.
- The shift is described as "to the right" (not "downwards").
- A comparative quote must give two pCO₂ values at the same pO₂.
Answer
Bohr shift (or Bohr effect).
Bohr shift
Background Concept
The phenomenon in which increasing pCO₂ (or decreasing pH) reduces the affinity of haemoglobin for oxygen is called the Bohr shift (or Bohr effect), after the Danish physiologist Christian Bohr who described it in 1904. It is one of several allosteric modulators of haemoglobin, alongside 2,3-BPG and temperature.
Mechanistically, H⁺ (from CO₂ + H₂O → H₂CO₃ → HCO₃⁻ + H⁺) and CO₂ itself bind to specific sites on the globin chains, stabilising the low-affinity T-state of haemoglobin and promoting O₂ release.
Understanding the Question
The candidate is asked simply to name the effect — the one already described in part (iii).
Approach
Identify the standard name for the pCO₂-dependent shift of the oxygen dissociation curve.
Step-by-Step Reasoning
- The effect is universally known as the Bohr shift (or Bohr effect).
- The mark scheme accepts either form.
- "Bohr effect" and "Bohr shift" are both standard textbook terms.
Key Takeaways
- Bohr shift = rightward shift of the ODC with rising pCO₂ (or falling pH).
- The effect is physiologically important because it occurs precisely where CO₂ is high — at respiring tissues.
Common Mistakes
- Writing "the Haldane effect" — that is the related but distinct effect: deoxygenated haemoglobin carries more CO₂.
- Writing "cooperative binding" — describes the sigmoidal shape, not the pCO₂ effect.
Things to Be Careful About
- Either "Bohr shift" or "Bohr effect" is accepted; pick one and write it clearly.
Answer
- More oxygen is released (at respiring tissues).
- This supplies oxygen to (respiring) tissues/cells to meet (their increased) demand.
- This maintains aerobic respiration.
More oxygen is released at respiring tissues, meeting the higher demand for aerobic respiration.
Background Concept
The Bohr shift is a beautifully tuned feedback system. Respiring tissues produce CO₂, which raises local pCO₂ and lowers pH. Both changes lower haemoglobin's O₂ affinity, so more O₂ is unloaded precisely at the cells that are consuming it most rapidly. This matches oxygen supply to oxygen demand without any neural or hormonal control.
The advantage is greatest during exercise: skeletal muscle respires faster, produces more CO₂, and so triggers more O₂ release — exactly when it is needed.
Understanding the Question
The question asks for a two-mark explanation of why the Bohr effect is useful to a mammal. The mark scheme offers any two from: (a) more O₂ is released/supplied; (b) the O₂ is supplied to tissues where demand is high; (c) aerobic respiration is maintained.
Approach
- State the direct effect: more O₂ released.
- State the purpose: to meet tissue demand.
- State the consequence: aerobic respiration continues.
Step-by-Step Reasoning
- The rightward shift of the curve at high pCO₂ means that at the pO₂ of respiring tissues, haemoglobin gives up more of its bound oxygen.
- This extra O₂ is delivered to the cells that produced the CO₂ — so the cells that respire fastest receive most O₂.
- More O₂ supports more oxidative phosphorylation, so aerobic respiration (and ATP production) is maintained even when demand rises (e.g. during exercise).
Key Takeaways
- Bohr shift = automatic matching of O₂ supply to tissue demand.
- The advantage is physiological: maintains aerobic ATP production under variable workload.
- The mechanism does not require any active regulation; it is a property of the haemoglobin molecule itself.
Common Mistakes
- Vague answers like "it is helpful" — the mark scheme requires a specific point about O₂ release and tissue demand.
- "Haemoglobin releases oxygen more readily" alone — this is ignored by the mark scheme (it is just a restatement of the effect, not the advantage).
- "Quicker / faster release" — ignored; the mark is for more O₂ released, not the speed.
- Confusing the Bohr shift with the Haldane effect (which is about CO₂ carriage, not O₂ release).
Things to Be Careful About
- Frame the answer as an advantage to the mammal (physiology) — not just as a description of the curve.
- Avoid the ignored phrase "haemoglobin releases oxygen more readily" — make the point about supply to respiring tissues and meeting demand.