Biology 9700/12 — May/June 2025
Cambridge AS Level · Multiple Choice (AS Level) · answer key with instant marking and worked solutions
Topics Cell Structure · Biological Molecules · Enzymes · Transport in Plants · Cell Membranes and Transport · Transport in Mammals · +5 more
Tap an option under each question to check it — your score builds as you go.
Which row shows possible uses of an eyepiece graticule?
| comparing the diameter of two cells viewed with a objective lens | calibrating a stage micrometer viewed with a objective lens | |
|---|---|---|
| A | ✓ | ✓ |
| B | ✓ | ✗ |
| C | ✗ | ✓ |
| D | ✗ | ✗ |
key
✓ = possible
✗ = not possible
Options
A row A
B row B
C row C
D row D
Working
- An eyepiece graticule has arbitrary units (no fixed length) and CAN be used to compare the diameters of two cells viewed at ×40. ✓
- A stage micrometer HAS a known scale; it is used to CALIBRATE the eyepiece graticule, not the other way around. ✗
Answer
B
B
Background Concept
A light microscope has two scales available for measuring specimens:
- Eyepiece graticule — a small glass disc with arbitrary graduations (units) etched into it, placed inside the eyepiece. It is superimposed on the specimen image. Because its units are arbitrary, the actual length represented by each division changes whenever the objective lens is changed.
- Stage micrometer — a slide with an accurately known scale (typically 0.1 mm divisions) printed on it. It sits on the stage in place of a normal slide.
To convert the graticule's arbitrary units into real units (mm or µm), the stage micrometer is used to calibrate the eyepiece graticule at each objective lens. This must be done separately for every magnification, because the relationship between graticule units and actual length changes with the lens in use.
Understanding the Question
The question gives a 2 × 2 table and asks which row correctly identifies what the eyepiece graticule CAN and CANNOT do. We need to evaluate two statements:
- Can the graticule be used to compare the diameters of two cells viewed at ×40?
- Can the graticule be used to calibrate a stage micrometer viewed at ×10?
Approach
For each statement, decide ✓ or ✗ by recalling the correct direction of the calibration relationship (stage micrometer → calibrates → eyepiece graticule) and what the graticule's arbitrariness means for its uses.
Step-by-Step Reasoning
- Statement 1 — comparing diameters at ×40: ✓ possible. As long as both cells are viewed with the SAME objective lens, the same graticule scale applies to both, so a direct comparison of graticule units is a valid comparison of actual diameters. Calibration is not even required for a relative comparison.
- Statement 2 — calibrating a stage micrometer at ×10: ✗ not possible. Calibration goes the OTHER way: the stage micrometer is the reference of known length and is used to convert graticule units into real units. An eyepiece graticule, with its arbitrary scale, cannot be used to give the stage micrometer a real length.
- Therefore the correct row is: ✓ (first column), ✗ (second column) — row B.
Key Takeaways
- Eyepiece graticule = measuring/comparing tool with arbitrary units.
- Stage micrometer = reference of known length used to calibrate the graticule.
- A comparison of two specimens does not require calibration; an absolute size does.
Common Mistakes
- Reversing the calibration relationship and thinking the graticule calibrates the stage micrometer — this is the most common error and leads candidates to pick A.
- Thinking the graticule cannot be used for comparison at all — leading to the other extreme.
Things to Be Careful About
- The direction of calibration is one-way: stage micrometer → eyepiece graticule.
- Comparison of sizes only requires both specimens to be viewed at the same magnification; it does not need calibration.
- Calibration must be repeated for every objective lens because each lens magnifies the graticule differently.
Which statement about a light microscope is correct?
Options
A As the distance to see two points as separate points decreases, the resolution also decreases.
B A bacterium in diameter will not be visible if the resolution is .
C Two membranes that are less than apart will be visible as two separate membranes if the wavelength of light is .
D The resolution will improve with visible light of a longer wavelength, such as red light.
Answer
B — a bacterium in diameter will not be visible if the resolution is .
Reasoning: , which is smaller than the resolution of . Because the object is smaller than the minimum resolvable distance, the microscope cannot distinguish it as a separate structure.
Why the others are wrong:
- A: as the minimum resolvable distance decreases, resolving power (resolution) increases, not decreases.
- C: resolution is roughly half the wavelength, so with the resolution is about ; structures less than apart cannot be seen as separate.
- D: resolution improves with shorter wavelength, not longer; red light gives poorer resolution.
B
Background Concept
Resolution is the minimum distance between two points at which they can still be seen as separate. It is the most important property of any microscope: a microscope can only show detail down to its resolution limit.
Resolution depends on the wavelength () of the radiation used and the numerical aperture of the lens system. A useful working rule for a light microscope is:
So with green light () a good light microscope has a resolution of roughly –. Any two structures closer together than this appear as a single blurred object.
Key consequences:
- Shorter wavelength → better (smaller) resolution. This is why electron microscopes (which use electrons with extremely short effective wavelengths) can resolve down to about .
- Resolution is not the same as magnification. A microscope can be made to magnify enormously, but if its resolution is poor, the image is just a larger blur — no new detail is revealed.
- An object must be larger than the resolution to be seen as a distinct structure.
Units to remember: .
Understanding the Question
This is a multiple-choice item on the meaning of resolution in a light microscope. Each option tests a different misconception:
- A confuses the relationship between minimum resolvable distance and resolving power.
- B tests whether you can apply the definition: an object smaller than the resolution cannot be seen.
- C tests whether you know that resolution is limited by wavelength and roughly equals .
- D tests whether you know which way the wavelength–resolution relationship goes.
The command word is implicit ("which is correct"); you must pick the single true statement and reject the false ones.
Approach
For each option, ask:
- What is the biological/physical principle it relies on?
- Does the statement correctly express that principle?
- If it involves numbers, convert to the same units and compare with the resolution.
Step-by-Step Reasoning
Option A — "As the distance to see two points as separate points decreases, the resolution also decreases."
The "distance to see two points as separate" is the resolution limit. If this limit gets smaller, the microscope can distinguish points that are closer together, meaning its resolving power is greater. So as the distance decreases, resolution (as an ability) increases. The statement reverses the relationship — incorrect.
Option B — "A bacterium in diameter will not be visible if the resolution is ."
Convert: .
The object () is smaller than the resolution (). An object smaller than the minimum resolvable distance cannot be seen as a distinct object — it appears as a fuzzy point or not at all. Correct.
Option C — "Two membranes less than apart will be visible as two separate membranes if the wavelength of light is ."
Resolution . Two structures less than apart fall below the resolution limit, so they will merge into a single blurred line. Incorrect.
Option D — "Resolution will improve with visible light of a longer wavelength, such as red light."
Because resolution , increasing wavelength worsens resolution. Shorter wavelengths (e.g. blue/violet light) give better resolution. This is also why electron microscopes, which use very short effective wavelengths, vastly outperform light microscopes. Incorrect.
Key Takeaways
- Resolution = the smallest distance at which two points can be seen as separate.
- An object must be larger than the resolution to be visible as a distinct structure.
- Resolution is inversely related to wavelength; shorter wavelength → better resolution.
- A useful approximation: .
- Resolution and magnification are different: high magnification with poor resolution just gives a larger blur.
- Remember for these numerical comparisons.
Common Mistakes
- Treating "resolution" as a single number that always goes up or down. Remember: smaller resolution value = better resolving power, but the resolving power itself is greater.
- Confusing resolution with magnification. A high magnification does not produce more detail if resolution is poor.
- Thinking that red light (longer wavelength) gives clearer images. It actually gives worse resolution; blue/violet light is preferred for high-resolution light microscopy.
- Forgetting to convert units when comparing object size with resolution ( vs ).
- Assuming any object can be made visible with enough magnification — false; the resolution limit is fixed by wavelength and lens quality.
Things to Be Careful About
- Always express both object size and resolution in the same units before comparing.
- Use the shortest wavelength available for the best optical resolution.
- The figure in option B is a typical best-case light-microscope resolution — just enough to be larger than the bacterium, so the bacterium cannot be resolved.
- This is why light microscopes cannot be used to see most viruses, ribosomes, or the internal detail of organelles such as mitochondria and chloroplasts; an electron microscope is required.
The electron micrograph shows a cell.
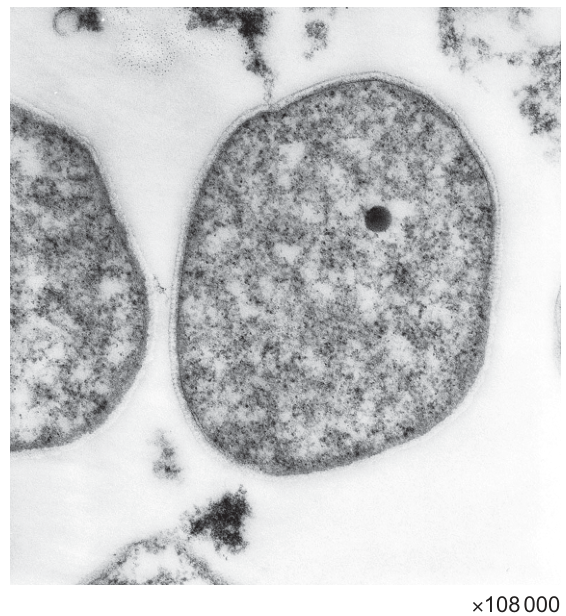
What is the actual maximum length of the cell?
Options
A
B
C
D
Working
Measure the maximum length of the cell in the printed image with a ruler.
Maximum image length ≈ 73 mm
Use the magnification formula:
Convert image size to micrometres (1 mm = 1000 µm):
Answer
B
B
Background Concept
In microscopy, the magnification of an image is the factor by which the specimen has been enlarged compared with its real size. The relationship between image size, actual size and magnification is:
which can be rearranged to:
Electron micrographs usually print the magnification on the figure (here, ). A useful sanity check: a typical bacterium is about – long, so an actual length of around half a micrometre to a few micrometres is reasonable for this specimen. Distractor D () would correspond to an image of about — far larger than the page — and is the classic error of forgetting to convert mm to µm. Distractor A () corresponds to the cell's width, not its length. Distractor C () is the value obtained if the conversion is missed and mm is treated as µm.
Understanding the Question
The question asks for the actual maximum length of the cell shown in Fig. 3.1. The micrograph is printed at a stated magnification of . To answer, the candidate must:
- Measure the longest dimension of the cell on the printed page with a ruler.
- Apply the magnification formula.
- Convert the image size into micrometres so it is on the same scale as the answer choices.
The cell is a prokaryote (no internal membrane-bound organelles, with a single dark nucleoid region visible), consistent with the small actual size obtained.
Approach
The plan is straightforward — the magnification formula is the only tool required. The trap is keeping the units consistent: the ruler gives millimetres, but the answers are in micrometres. Once the formula is set up with matching units, the arithmetic yields one of the four options directly.
Step-by-Step Reasoning
- Measure the printed cell. Lay a ruler along the longest axis of the cell. The cell's maximum length on the page is approximately .
- Convert to micrometres. .
- Apply the magnification formula. Divide image size by magnification:
- Match to the options. is option B. Option A () is the cell's width, not length. Options C and D result from unit-conversion errors.
Key Takeaways
- Always convert image size and actual size to the same unit before dividing.
- A handy conversion: .
- Use a ruler on the printed page (not on a screen) for accurate measurements.
- The magnification stated on a micrograph can be checked: for a typical bacterium (), at the cell will be about across on paper.
Common Mistakes
- Forgetting the unit conversion (treating as ): gives , which is not even among the options — but if one divides by instead of , you obtain option C.
- Measuring the wrong dimension (e.g. the shorter axis): gives option A ().
- Multiplying instead of dividing by the magnification: gives a value of tens of metres, which is not offered.
- Dividing the magnification by the image size (inverting the formula): gives an answer in the wrong units and orders of magnitude.
Things to Be Careful About
- Read the maximum length, not the average or width — the question specifies maximum length.
- Always quote the answer in the same unit requested (here, µm).
- Check that the answer is biologically sensible: a single-celled bacterium of is plausible (similar in size to Mycoplasma or some small cocci), whereas would be unusually large for a cell without internal compartments visible.
The table compares some biochemical molecules of P, Q, R and S.
| chlorophyll | DNA | RNA | peptidoglycan | |
|---|---|---|---|---|
| P | ✓ | ✓ | ✓ | ✗ |
| Q | ✗ | ✓ | ✓ | ✗ |
| R | ✗ | ✓ | ✓ | ✓ |
| S | ✗ | ✗ | ✓ | ✗ |
key
✓ = present
✗ = not present
Which row correctly identifies P, Q, R and S?
Options
| P | Q | R | S | |
|---|---|---|---|---|
| A | chloroplast | virus | mitochondrion | bacterium |
| B | chloroplast | mitochondrion | bacterium | virus |
| C | mitochondrion | virus | bacterium | chloroplast |
| D | virus | bacterium | mitochondrion | chloroplast |
Working
- P contains chlorophyll, DNA and RNA but no peptidoglycan → site of photosynthesis with its own genome but a eukaryotic organelle → chloroplast.
- Q contains DNA and RNA but no chlorophyll and no peptidoglycan → organelle with its own genome but no photosynthetic pigment → mitochondrion.
- R contains DNA, RNA and peptidoglycan but no chlorophyll → prokaryotic cell with the bacterial cell-wall polymer → bacterium.
- S contains only RNA (no DNA), no chlorophyll and no peptidoglycan → non-cellular particle with a nucleic acid genome but no cytoplasm or cell wall → virus.
Answer
B
B
Background Concept
All living cells share two features: a plasma membrane and some form of nucleic acid genome (DNA and/or RNA). Beyond that, key biochemical differences separate the major categories of biological entity that this question is asking you to identify.
- Eukaryotic organelles — chloroplasts and mitochondria. Both are believed to have originated from free-living prokaryotes that were engulfed by an ancestral eukaryotic cell (the endosymbiotic theory). As a result each carries its own small circular DNA molecule and its own ribosomes (hence RNA), and both replicate semi-independently. Chloroplasts additionally contain chlorophyll, the photosynthetic pigment that captures light energy. Neither organelle is surrounded by a cell wall containing peptidoglycan — that polymer is exclusively bacterial.
- Prokaryotic (bacterial) cells. Their cell wall is built around a mesh of peptidoglycan (murein), a polymer of alternating N-acetylglucosamine and N-acetylmuramic acid cross-linked by short peptides. This is the single most reliable biochemical marker distinguishing bacteria from archaea and eukaryotes. A typical bacterium contains a circular DNA chromosome, RNA, ribosomes, and a plasma membrane, but no membrane-bound organelles and no chlorophyll (with the special exception of cyanobacteria, which is not what this row is testing).
- Viruses. A virus is non-cellular: it consists of a nucleic-acid core (either DNA or RNA, never both) wrapped in a protein capsid, and sometimes a lipid envelope. It has no cytoplasm, no ribosomes of its own, no plasma membrane and no cell wall, so it contains neither chlorophyll nor peptidoglycan.
Understanding the Question
You are given a table that lists four biochemical markers — chlorophyll, DNA, RNA, peptidoglycan — and shows which are present (✓) or absent (✗) in four mystery entities P, Q, R and S. The four answer options each assign a different identity to P, Q, R and S. The task is to match the biochemical "fingerprint" of each row to a cell type.
The command word is implicit in an MCQ: you must select the one option in which every column matches the biology of the named structure.
Approach
Read off each row's pattern of ticks and crosses, then recall the defining biochemical feature(s) of each candidate. There are four diagnostic facts to keep separate:
- Chlorophyll → photosynthesis → chloroplast only (among the four candidates).
- Peptidoglycan → bacterial cell wall only.
- Both DNA and RNA → a cell with its own genome and ribosomes; excludes a typical virus.
- Only one of DNA/RNA, no peptidoglycan, no chlorophyll → virus.
Run these four tests against each row.
Step-by-Step Reasoning
Row P — chlorophyll ✓, DNA ✓, RNA ✓, peptidoglycan ✗.
The presence of chlorophyll immediately rules out a bacterium (most have none), a mitochondrion (no photosynthetic pigment), and a virus (no pigments at all). DNA + RNA with no peptidoglycan fits the chloroplast, which has its own genome and ribosomes but, as a eukaryotic organelle, lacks the bacterial peptidoglycan wall. → chloroplast.
Row Q — chlorophyll ✗, DNA ✓, RNA ✓, peptidoglycan ✗.
DNA and RNA are present (so it has its own genetic machinery) but there is no chlorophyll and no peptidoglycan. That profile matches an organelle with a genome but no photosynthetic machinery: the mitochondrion. → mitochondrion.
Row R — chlorophyll ✗, DNA ✓, RNA ✓, peptidoglycan ✓.
Peptidoglycan is the giveaway — it is unique to bacterial cell walls among the four candidates. Combined with DNA and RNA but no chlorophyll, this is a bacterium.
Row S — chlorophyll ✗, DNA ✗, RNA ✓, peptidoglycan ✗.
Only RNA is present. A cell cannot survive with RNA as its sole nucleic acid, so this is not a cell at all. No peptidoglycan and no chlorophyll are consistent with a non-cellular particle. → virus (specifically an RNA virus, e.g. HIV, influenza or coronavirus).
Putting these together: P = chloroplast, Q = mitochondrion, R = bacterium, S = virus. This corresponds to option B.
Why not the others?
- A swaps Q and R: it makes Q a virus (but Q has both DNA and RNA, which a virus cannot) and R a mitochondrion (but R has peptidoglycan, which a mitochondrion never does).
- C puts a mitochondrion in row P (but P has chlorophyll) and a chloroplast in row S (but S has neither DNA nor chlorophyll).
- D reverses several: P as a virus (P has chlorophyll), Q as a bacterium (Q has no peptidoglycan), R as a mitochondrion (R has peptidoglycan), and S as a chloroplast (S has no chlorophyll).
Only option B is biologically consistent across all four columns.
Key Takeaways
- Chlorophyll is found in chloroplasts (and in cyanobacteria, but not in other bacteria, mitochondria or viruses).
- Peptidoglycan is the diagnostic marker of a bacterial cell wall.
- Chloroplasts and mitochondria both contain DNA and RNA, supporting their endosymbiotic origin — but neither has peptidoglycan.
- Viruses contain either DNA or RNA, never both, and lack cytoplasm, ribosomes and any cell wall.
- When matching a structure to a set of biochemical markers, look for the unique marker first (here, chlorophyll for chloroplasts, peptidoglycan for bacteria, RNA-only for viruses), then use the remaining markers to confirm.
Common Mistakes
- Choosing A and assuming that "no peptidoglycan" alone identifies a virus. A mitochondrion also lacks peptidoglycan — the combination of RNA-only, no DNA and no chlorophyll is what identifies the virus.
- Confusing a chloroplast with a cyanobacterium. Cyanobacteria do have chlorophyll and peptidoglycan, so the "chlorophyll ✓ and peptidoglycan ✗" pattern in row P points to the chloroplast, not to a cyanobacterium.
- Forgetting that viruses have either DNA or RNA, and selecting S = bacterium because "bacteria have RNA". The decisive feature of S is the absence of DNA — bacteria always have DNA.
Things to Be Careful About
- The DNA/RNA pattern in the table is meant to distinguish genetic content, not transcription products. A cell that "only has RNA" in this context has no DNA genome — that is the definition of a (RNA) virus.
- "Peptidoglycan" must not be confused with peptone, pectin or cellulose — examiners will not credit those alternatives.
- The question uses ✓/✗ unambiguously; if you read "present" as "absent" or vice versa the whole chain of deductions collapses, so always re-check the key before committing.
Which cell structures contain enzymes and are enclosed by a double membrane?
1 nucleus
2 mitochondrion
3 chloroplast
Options
A 1, 2 and 3
B 1 and 2 only
C 1 only
D 2 and 3 only
Working
Apply both criteria to each organelle:
| Organelle | Contains enzymes? | Double membrane? |
|---|---|---|
| Nucleus | Yes (e.g. DNA polymerase, RNA polymerase) | Yes (nuclear envelope = two bilayers) |
| Mitochondrion | Yes (e.g. those of the Krebs cycle and oxidative phosphorylation) | Yes (outer and inner membranes) |
| Chloroplast | Yes (e.g. Rubisco and other Calvin cycle enzymes) | Yes (outer and inner membranes) |
All three satisfy both conditions.
Answer
A
A
Background Concept
Eukaryotic cells are compartmentalised into membrane-bound organelles, each with a characteristic structure suited to its function. Two membrane-bound compartments in particular are relevant here:
- The nucleus is surrounded by a nuclear envelope made of two phospholipid bilayers (an outer and an inner membrane) perforated by nuclear pores. Inside it lie chromatin and the nucleolus, and a battery of enzymes carry out DNA replication (DNA polymerases) and transcription (RNA polymerases), as well as DNA repair.
- Mitochondria have an outer membrane (smooth) and a highly folded inner membrane (forming cristae). The matrix and inner membrane house the enzymes of the Krebs cycle and the electron transport chain / oxidative phosphorylation, including ATP synthase.
- Chloroplasts (in plant cells) likewise have an outer and an inner membrane; inside, the stroma contains the enzymes of the Calvin cycle (notably Rubisco, the most abundant protein on Earth), while the thylakoid membranes carry the light-dependent reactions.
The "double membrane" criterion therefore points to the endosymbiotic-origin organelles (mitochondria and chloroplasts) plus the nucleus, which acquired its double envelope separately during eukaryotic evolution.
Understanding the Question
The question is a double-criterion filter. Each numbered organelle must satisfy both of the following:
- It contains enzymes (i.e. enzymes are located within it, not merely on its surface).
- It is enclosed by a double membrane (two phospholipid bilayers form its boundary).
The options A–D then ask which combination of the three organelles meets both criteria.
Approach
The strategy is simply to check each organelle independently against both criteria and then take the intersection.
- Nucleus — clearly contains enzymes (any textbook states this for replication and transcription). It is bounded by the nuclear envelope, which is universally described as a double membrane.
- Mitochondrion — textbook "powerhouse" with enzymes throughout the matrix and inner membrane. Two membranes, outer and inner.
- Chloroplast — photosynthesis requires many enzymes; bounded by outer and inner membranes (the thylakoids are internal, additional, but do not change the boundary count).
All three pass, so the answer is the option listing 1, 2 and 3.
Step-by-Step Reasoning
- Nucleus (1): Enzymes present? Yes — DNA polymerase, RNA polymerase, ligase, helicase, etc. Double membrane? Yes — nuclear envelope of two bilayers. → Passes both.
- Mitochondrion (2): Enzymes present? Yes — Krebs-cycle enzymes in the matrix, electron-transport-chain complexes and ATP synthase in the inner membrane. Double membrane? Yes — outer membrane and inner (cristae-bearing) membrane. → Passes both.
- Chloroplast (3): Enzymes present? Yes — Rubisco and other Calvin-cycle enzymes in the stroma; photosystem proteins and ATP synthase in the thylakoid membrane. Double membrane? Yes — outer and inner envelope membranes. → Passes both.
- Intersection: {1, 2, 3} → option A.
Key Takeaways
- Three eukaryotic organelles are bounded by a double membrane: the nucleus, the mitochondrion and the chloroplast.
- All three are also sites of enzyme activity — the nucleus for nucleic-acid metabolism, the mitochondrion for aerobic respiration, and the chloroplast for photosynthesis.
- Single-membrane organelles (ER, Golgi, lysosome, vacuole) and non-membrane-bound structures (ribosomes, centrosomes) fail one or both criteria.
Common Mistakes
- Choosing D (2 and 3 only) because the student remembers the "double-membrane = endosymbiotic" line and forgets the nucleus is also double-membrane-bound.
- Choosing B (1 and 2 only) by overlooking that chloroplasts too are double-membrane organelles (some students think the thylakoid stacks are the boundary).
- Choosing C (1 only) by thinking the nucleus is the only double-membrane compartment and forgetting that mitochondria and chloroplasts are too.
- Excluding chloroplast on the grounds that "plant cells are not in the syllabus" — they are, and double-membrane organelles are explicitly required knowledge.
Things to Be Careful About
- "Contains enzymes" is satisfied by enzymes inside the organelle, not merely attached to its outer surface; for example, ribosomes bound to the rough ER are not inside the ER lumen, so the ER does not score here on that ground either.
- The thylakoid system inside a chloroplast is a third, internal membrane system; it does not alter the fact that the chloroplast's envelope is a double membrane.
- The term "double membrane" refers to two distinct phospholipid bilayers, not to a thickened single membrane. The nuclear envelope qualifies because it is two bilayers separated by a perinuclear space and fused at nuclear pores.
What is the order of size of cell structures?
Options
| largest smallest | ||||
|---|---|---|---|---|
| A | centrioles | ribosomes | lysosomes | nucleoli |
| B | centrioles | nucleoli | lysosomes | ribosomes |
| C | nucleoli | lysosomes | centrioles | ribosomes |
| D | nucleoli | centrioles | ribosomes | lysosomes |
Working
Ribosomes are the smallest (~0.02 µm) and nucleoli the largest (~1–7 µm). Lysosomes are membrane-bound vesicles around 0.1–1 µm, larger than centrioles (~0.1 µm long). So the order from largest to smallest is:
Answer
C
C
Background Concept
Eukaryotic cells contain a range of membrane-bound and non-membrane-bound structures, each with a characteristic size range. Knowing these approximate sizes is essential for interpreting electron micrographs and for understanding how sub-cellular compartments fit inside a cell (which is typically 10–100 µm across).
The four structures in this question are:
- Nucleolus – a dense, non-membrane-bound region inside the nucleus where ribosomal RNA is transcribed and ribosome subunits are assembled. It is large enough to be seen with a light microscope, with a diameter of roughly 1–7 µm.
- Lysosome – a single-membrane-bound vesicle (~0.1–0.5 µm, occasionally up to ~1.2 µm) containing hydrolytic enzymes for intracellular digestion.
- Centriole – a cylindrical arrangement of microtubules, about 0.1–0.2 µm long and 0.02 µm in diameter, found in pairs within the centrosome.
- Ribosome – a small ribonucleoprotein particle about 0.020–0.030 µm (20–30 nm) in diameter, only visible with the electron microscope.
Understanding the Question
The command word here is implicit: rank the four cell structures from largest to smallest. The options present different orderings and we must pick the one that correctly places them by size.
Approach
First, identify the smallest and the largest of the four, then place the remaining two in between. Ribosomes are by far the smallest of the structures listed (only visible under an electron microscope), so they must be the rightmost (smallest) entry. Nucleoli are the largest, so they must be the leftmost entry. That immediately eliminates options A (ribosomes in 2nd place) and D (ribosomes in 3rd place). The remaining task is to decide whether centrioles or lysosomes are larger.
Step-by-Step Reasoning
- Eliminate using the extremes. Ribosomes (~0.02 µm) are smaller than centrioles (~0.1 µm long) and lysosomes (~0.1–1 µm), and certainly much smaller than nucleoli (~1–7 µm). So the correct order must end with ribosomes. Options A and D do not, so they are wrong.
- Distinguish B and C. Both B and C start with nucleoli and end with ribosomes; they differ only in the middle two entries. In option B the order is centrioles → nucleoli → lysosomes → ribosomes, which is wrong because nucleoli are larger than both centrioles and lysosomes and so should be the first entry (it is). However, B places centrioles second, ahead of lysosomes. In option C the order is nucleoli → lysosomes → centrioles → ribosomes.
- Compare lysosomes and centrioles. Lysosomes are membrane-bound vesicles about 0.1–1.2 µm in diameter, whereas centrioles are smaller cylindrical organelles about 0.1–0.2 µm long and only 0.02 µm wide. Therefore lysosomes are generally larger than centrioles, confirming order C.
Key Takeaways
- A useful size hierarchy for a eukaryotic cell is: whole cell > nucleus ≈ nucleolus > mitochondrion ≈ lysosome ≈ peroxisome > centriole > ribosome.
- Ribosomes (~20–30 nm) are the smallest commonly listed organelle and are only resolved by the electron microscope.
- Nucleoli are unusually large sub-nuclear structures because they are essentially factories for assembling ribosome subunits.
Common Mistakes
- Confusing centrioles with cilia or with the whole centrosome. The centrosome (a pair of centrioles plus pericentriolar material) is larger than a centriole, but each individual centriole is small.
- Placing ribosomes as the largest because they are described as the site of protein synthesis – function does not indicate size.
- Forgetting that nucleoli sit inside the nucleus and are much bigger than the free cytoplasmic organelles listed.
Things to Be Careful About
- "Lysosome" sizes vary with the material being digested; very large secondary lysosomes can approach 1 µm, but they are still larger than a centriole.
- The question uses the term "nucleoli" (plural of nucleolus) – a single nucleus may contain one or more nucleoli, each ~1–7 µm.
- At AS Level, exact micrometre values are not required; relative ordering is the skill being tested.
A sample of a solution of sucrose tested for reducing sugars remains blue, but when another sample of the same solution is tested for non-reducing sugars the solution turns red.
What explains these results?
Options
A During the non-reducing sugar test, an acid hydrolyses sucrose to glucose and fructose.
B During the non-reducing sugar test, sucrose molecules condense into polysaccharides.
C The reducing sugar test converts sucrose into glucose and fructose.
D The reducing sugar test hydrolyses monosaccharides to disaccharides.
Working
Sucrose is a non-reducing disaccharide: its glycosidic bond joins the two anomeric carbons (C1 of glucose and C2 of fructose), so no free aldehyde or ketone group is available to reduce Cu²⁺ in Benedict's reagent — hence the blue colour in the reducing sugar test.
In the non-reducing sugar test, the sample is first heated with dilute hydrochloric acid. The H⁺ ions catalyse the hydrolysis of the glycosidic bond in sucrose, splitting it into the two monosaccharides glucose and fructose. Both are reducing sugars (each has a free anomeric carbon once the bond is broken). After neutralisation with NaHCO₃, Benedict's reagent is added and the solution turns red, confirming the presence of reducing sugars produced by hydrolysis.
Answer
A
A
Background Concept
Sugars are classified as reducing or non-reducing depending on whether they possess a free aldehyde (–CHO) or ketone (–C=O) group that can open up and reduce Cu²⁺ ions in Benedict's reagent to Cu⁺ (forming the brick-red Cu₂O precipitate). All monosaccharides such as glucose and fructose are reducing. Sucrose is unusual: it is a disaccharide of glucose and fructose joined by an α-1,2-glycosidic bond that links both anomeric carbons simultaneously, leaving no free reducing group — making sucrose a non-reducing sugar.
The non-reducing sugar test exploits this by chemically breaking sucrose apart before applying Benedict's reagent. The procedure is:
- Add dilute hydrochloric acid (HCl) to the sample and heat (≈70 °C in a water bath for several minutes). The acid catalyses the hydrolysis of the glycosidic bond: .
- Cool and neutralise the acid with sodium hydrogencarbonate (NaHCO₃), because Benedict's reagent is alkaline and the HCl would prevent the colour change.
- Add Benedict's reagent, reheat, and observe. If reducing sugars are now present, the solution turns green, yellow, orange, or brick red depending on concentration.
Understanding the Question
The candidate is told that two tests were carried out on the same sucrose solution:
- Reducing sugar test (Benedict's only) → remains blue (negative, no reducing sugars detected).
- Non-reducing sugar test (HCl hydrolysis, neutralisation, then Benedict's) → turns red (positive).
The question asks which explanation accounts for the appearance of a positive result only after the non-reducing sugar test.
Approach
Identify the chemistry that happens only in the non-reducing sugar test. Both tests use Benedict's reagent at the end; the difference is the acid-hydrolysis step that comes first. That step must therefore be responsible for turning a non-reducing sugar into reducing sugars — i.e. hydrolysing the glycosidic bond of sucrose into glucose and fructose.
Step-by-Step Reasoning
- Option A — "During the non-reducing sugar test, an acid hydrolyses sucrose to glucose and fructose." This correctly describes the chemistry of the HCl step. The monosaccharides produced are both reducing, so Benedict's now gives a positive (red) result. ✓
- Option B — "Sucrose molecules condense into polysaccharides." This is wrong on two counts: the test is hydrolysis, not condensation; and condensation of sucrose into a polysaccharide (e.g. via sucrose-phosphate synthase to form starch-like products) does not happen under these conditions and would not produce a reducing end.
- Option C — "The reducing sugar test converts sucrose into glucose and fructose." This is false. The reducing sugar test (Benedict's alone) does not hydrolyse sucrose, which is exactly why the result stays blue. It cannot account for the positive result seen in the non-reducing test.
- Option D — "The reducing sugar test hydrolyses monosaccharides to disaccharides." This is chemically wrong and the wrong direction — hydrolysis goes from disaccharide to monosaccharides, not the reverse.
Only option A correctly identifies acid-catalysed hydrolysis of sucrose as the explanation for the differing test outcomes.
Key Takeaways
- Sucrose is the most common non-reducing disaccharide because both anomeric carbons are tied up in its glycosidic bond.
- The non-reducing sugar test uses dilute HCl to hydrolyse glycosidic bonds, releasing free reducing sugars before Benedict's reagent is applied.
- Always neutralise the acid (with NaHCO₃) before adding Benedict's, since the test requires alkaline conditions.
Common Mistakes
- Believing Benedict's reagent itself hydrolyses sugars — it does not; it only detects them after heating in alkaline conditions.
- Confusing hydrolysis (water added, bond broken) with condensation (water removed, bond formed).
- Thinking the reducing sugar test result of "blue" means no sugars are present at all — it means no reducing sugars. Sucrose is still in the solution.
Things to Be Careful About
- The acid hydrolysis step is the critical difference between the two tests — any explanation that ignores it is incomplete.
- Glucose and fructose are both reducing despite fructose being a ketose: in alkaline Benedict's solution, fructose isomerises to glucose via an enediol intermediate, so it is also detected as a reducing sugar.
- Do not credit answers that misstate the direction of hydrolysis or the role of Benedict's reagent.
Which molecules contain at least two double bonds?
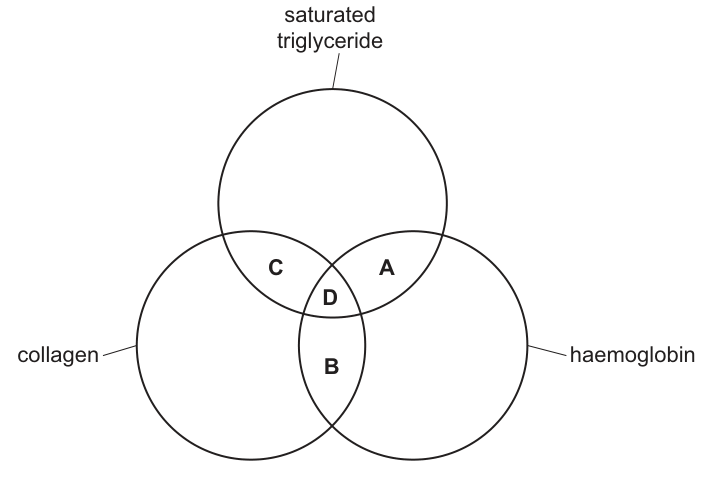
Options
A A
B B
C C
D D
Working
Identify the double bonds present in each of the three molecules shown in the Venn diagram:
- Saturated triglyceride: contains 3 ester linkages, each with a C=O double bond → 3 double bonds.
- Collagen: contains many peptide bonds along its polypeptide chains; each peptide bond is –C(=O)–N(H)– and includes a C=O double bond → many double bonds.
- Haemoglobin: contains 4 haem groups, each with a porphyrin ring containing multiple C=C and C=N double bonds → many double bonds.
All three molecules contain at least two double bonds, so the answer is the region representing the intersection of all three circles.
Answer
D
D
Background Concept
A covalent double bond consists of two shared pairs of electrons between two atoms. In the biomolecules relevant here, the double bonds of interest are the C=O (carbonyl) bond and the C=C / C=N bonds found in ring systems.
- In an ester linkage (–CO–O–), the carbon is double-bonded to one oxygen and single-bonded to another. A triglyceride has three such ester linkages, one for each fatty acid joined to the glycerol backbone.
- In a peptide bond (–CO–NH–), the carbon is double-bonded to oxygen. The peptide bond is usually drawn as a single bond, but resonance gives it partial double-bond character; chemically, it contains a C=O.
- In the porphyrin ring of haem, alternating single and double bonds (a conjugated π-system) give the ring its characteristic absorption spectrum and allow it to bind Fe²⁺.
Understanding the Question
Fig. 8.1 is a three-way Venn diagram of three biomolecules: saturated triglyceride, collagen, and haemoglobin. The intersections A, B, C and D are labelled regions, and the question asks which region represents molecule(s) that contain at least two double bonds. The correct answer (D) is the central intersection common to all three circles, so the question expects the candidate to recognise that each of the three molecules possesses at least two double bonds.
Approach
Survey the bonding within each molecule and count the double bonds:
- Saturated triglyceride → count C=O in its ester linkages.
- Collagen → count C=O in its peptide bonds (one per amino acid residue).
- Haemoglobin → count C=C and C=N in its porphyrin rings.
If all three qualify, the region of overlap common to all three (D) is the answer.
Step-by-Step Reasoning
Saturated triglyceride. "Saturated" refers to the fatty acid chains, which contain only C–C single bonds. However, the three fatty acids are joined to glycerol by ester bonds, and each ester bond contains a C=O double bond. With three ester linkages, a saturated triglyceride has three C=O double bonds — at least two. ✓
Collagen. Collagen is a fibrous protein built from many amino acids joined by peptide bonds. Each peptide bond (–CO–NH–) has a C=O double bond. A collagen molecule contains hundreds of amino acid residues, so it has hundreds of C=O double bonds — far more than two. ✓
Haemoglobin. Each of the four polypeptide chains of haemoglobin carries a haem group, whose porphyrin ring is a conjugated system with multiple C=C and C=N double bonds (typically 9–11 double bonds per porphyrin). Across four haem groups this is dozens of double bonds — at least two. ✓
Because all three molecules contain at least two double bonds, the correct region on the Venn diagram is the central region common to all three circles — region D.
Key Takeaways
- A "saturated" fatty acid chain lacks C=C double bonds, but a triglyceride still contains C=O double bonds in its ester linkages.
- Peptide bonds contain a C=O double bond; proteins therefore have many double bonds along their backbone.
- The haem (porphyrin) group in haemoglobin is rich in C=C and C=N double bonds.
- A Venn diagram question of this type requires you to evaluate each molecule against the stated criterion, then identify the correct region (intersection vs. single circle vs. pairwise overlap).
Common Mistakes
- Assuming "saturated" means no double bonds at all. The C=O of the ester linkages is often overlooked. A saturated fatty acid chain has no C=C double bonds, but the ester groups that attach it to glycerol do.
- Treating peptide bonds as purely single bonds. Because they are routinely drawn as –CO–NH–, students forget the C=O component; in fact every peptide bond is a carbonyl-containing linkage.
- Forgetting the haem group's double bonds. Candidates who only think about the protein (globin) part of haemoglobin miss the extensive C=C / C=N system in the porphyrin ring.
- Misreading the Venn diagram. Region A is only the saturated-triglyceride ∩ haemoglobin overlap, not the union; D is the triple overlap. The question requires the triple overlap because all three molecules must satisfy the criterion.
Things to Be Careful About
- The wording "at least two" is inclusive — a single double bond would not qualify, but two or more does.
- The answer is the intersection common to all three molecules (D), not the union — selecting "all three circles combined" would not match the labelled region on the diagram.
- Be precise about which bonds count: in CIE biology, both the C=O of esters/peptide bonds and the C=C / C=N of aromatic/porphyrin systems are recognised as double bonds.
Amylose, amylopectin and glycogen are all polysaccharides.
Enzyme X removes one maltose molecule at a time from the ends of a polysaccharide molecule by hydrolysis of -1,4-glycosidic bonds.
Which row shows how completely each of these molecules will be hydrolysed by enzyme X?
(Assume that each polysaccharide is composed of the same number of monomers before hydrolysis begins.)
Options
| least completely hydrolysed most completely hydrolysed | |||
|---|---|---|---|
| A | amylose | amylopectin | glycogen |
| B | amylose | glycogen | amylopectin |
| C | glycogen | amylose | amylopectin |
| D | glycogen | amylopectin | amylose |
Working
- The enzyme only hydrolyses α-1,4-glycosidic bonds, removing maltose from the non-reducing ends of chains.
- Amylose is an unbranched chain of glucose linked only by α-1,4 bonds — it has only 2 ends, but every bond can be cleaved, so the whole molecule is eventually hydrolysed → most completely hydrolysed.
- Amylopectin is branched; it has many ends (so more rapid attack) but the α-1,6 branch-point bonds cannot be cleaved, leaving a glucose stub at each branch point.
- Glycogen is more highly branched than amylopectin (more α-1,6 branch points) → more stubs remain unhydrolysed → least completely hydrolysed.
Therefore: least hydrolysed = glycogen, then amylopectin, then amylose.
Answer
D
D
Background Concept
The three storage polysaccharides in this question differ in two structural features that determine how an exo-acting enzyme can digest them:
-
The type of glycosidic bond joining the glucose monomers:
- α-1,4-glycosidic bonds form straight chains of glucose.
- α-1,6-glycosidic bonds form at branch points and create a fork in the chain.
-
The degree of branching, which controls how many non-reducing ends the molecule has.
The three molecules compared here are:
| Polysaccharide | Structure | Bonds present | Branching |
|---|---|---|---|
| Amylose | Linear, helical | α-1,4 only | None — 2 ends |
| Amylopectin | Branched | α-1,4 in chains, α-1,6 at branch points | Moderate — branch every ~25 glucose units |
| Glycogen | Highly branched | α-1,4 in chains, α-1,6 at branch points | Very frequent — branch every ~8–12 glucose units |
Enzyme X is an exo-acting maltose-releasing hydrolase — analogous to β-amylase. It binds at the non-reducing end of a chain and clips off maltose (two glucose units joined by α-1,4 linkage). It has two crucial specificities:
- It only attacks the end of a chain (it cannot cut in the middle).
- It only cleaves α-1,4 bonds; α-1,6 bonds are invisible to it.
Understanding the Question
We are asked to rank the three polysaccharides from least to most completely hydrolysed by enzyme X, given that they all start with the same number of glucose monomers. The answer depends not on the speed of hydrolysis but on how much of each molecule the enzyme can ultimately break down.
The key is to combine two ideas:
- More ends → more places for the enzyme to start clipping.
- More α-1,6 branch points → more "stubs" the enzyme cannot reach.
For a fixed total number of monomers, the more branched the molecule, the more α-1,6 bonds it must contain, and the more material will be left undigested.
Approach
- For each polysaccharide, identify which bonds are present and how many chain ends it has.
- Decide whether enzyme X can digest the entire molecule (only true if all bonds are α-1,4) or whether branch points will be left behind.
- Rank from the molecule that retains the most undigested material to the one that is fully digested.
Step-by-Step Reasoning
Amylose (linear). All links are α-1,4. There are only 2 ends, so the enzyme makes slow progress, but every bond it reaches can be cleaved. Working inward from each end, it can eventually dismantle the whole chain, leaving no unhydrolysed residue.
→ Most completely hydrolysed.
Amylopectin (moderately branched). Each branch point introduces an α-1,6 bond that the enzyme cannot cut. When the enzyme reaches the last α-1,4 bond before a branch, it leaves a single glucose stub attached via the α-1,6 bond. The more branch points, the more stubs remain. With moderate branching, a significant fraction of glucose units is locked into these stubs.
→ Intermediately hydrolysed.
Glycogen (highly branched). Glycogen is essentially amylopectin with much more frequent α-1,6 branch points. For the same total number of monomers, glycogen has far more branch points, so far more glucose is trapped in stubs that enzyme X cannot release. Almost the whole outer "shell" of each branch can be trimmed, but the inner stubs persist.
→ Least completely hydrolysed.
The ranking from least to most completely hydrolysed is therefore:
glycogen < amylopectin < amylose, which corresponds to option D.
Key Takeaways
- The completeness of hydrolysis by an exo-acting, α-1,4-specific enzyme depends on how many α-1,6 branch points the substrate contains — not just on how many ends it has.
- A linear α-1,4 polymer (amylose) can in principle be fully digested.
- More branching (amylopectin → glycogen) means more unhydrolysed stubs at each branch point, so less complete hydrolysis.
- This is one reason animals use a debranching enzyme (which cleaves α-1,6 bonds) alongside phosphorylase to mobilise glycogen completely.
Common Mistakes
- Confusing speed with completeness. A more branched molecule has more ends and is hydrolysed faster, but it leaves more undigested residue. The question asks about completeness, not rate.
- Thinking glycogen is more completely hydrolysed because it is more soluble or more highly branched. Branching is precisely what makes it less completely hydrolysed by an α-1,4-specific exo-enzyme.
- Forgetting that the enzyme only cleaves α-1,4 bonds. Many students assume any chain end can be attacked.
Things to Be Careful About
- "End" in this context means the non-reducing end of a glucose chain (the end with a free C4-OH, not the reducing C1-OH). A linear chain has one of each; a branched chain has only non-reducing ends at the tips of every branch.
- The CIE mark scheme often rewards stating both that the enzyme cannot cleave α-1,6 bonds and that branch points leave an unhydrolysed stub.
- The wording "assume the same number of monomers" is essential: without it, the answer would be confused with kinetic arguments about chain length.
Which property of water enables sweating to be an efficient means of losing heat from the body?
Options
A The latent heat of vaporisation of water is high.
B The specific heat capacity of water is high.
C Each water molecule can form a hydrogen bond with four water molecules.
D The forces of cohesion and adhesion on water molecules are very high.
Working
Sweating cools the body when sweat evaporates from the skin. For liquid water to become water vapour, the hydrogen bonds between water molecules must be broken. The energy required to do this (taken from the body as heat) is the latent heat of vaporisation. Because water's latent heat of vaporisation is high, a large amount of heat is removed from the skin per gram of sweat evaporated, making sweating an efficient cooling mechanism.
Answer
A
A
Background Concept
Water has several unusual properties that arise from its polar nature and the hydrogen bonds that form between water molecules. Three properties frequently tested in this context are:
- Specific heat capacity — the energy required to raise the temperature of 1 g of a substance by 1 °C. Water's specific heat capacity is high (~4.2 J g⁻¹ °C⁻¹), so a lot of heat must be added to warm water. This is important for buffering temperature changes in organisms and in aquatic environments.
- Latent heat of vaporisation — the energy required to convert 1 g of a liquid into a gas at the same temperature. Water's latent heat of vaporisation is high (~2260 J g⁻¹) because every water molecule in the liquid must break its hydrogen bonds to escape into the vapour phase.
- Cohesion and adhesion — the forces of attraction between like water molecules (cohesion, via hydrogen bonds) and between water and other surfaces (adhesion). These are central to water transport in xylem and to surface tension.
Understanding the Question
The stem asks which property of water is specifically responsible for sweating being an efficient means of losing heat. Sweating is a cooling mechanism that depends on the evaporation of water from the surface of the skin. The key word is evaporation — the phase change from liquid to gas — and the question is testing whether the candidate links this to latent heat of vaporisation rather than to specific heat capacity, hydrogen bonding, or cohesion/adhesion.
Approach
The correct line of reasoning is: sweating cools the body by evaporation → evaporation requires energy to break hydrogen bonds → this energy is taken from the body as heat → because the latent heat of vaporisation of water is high, a small mass of evaporated sweat removes a large quantity of heat. The candidate should reject options whose property, while important, is not the one directly responsible for the evaporative cooling of sweat.
Step-by-Step Reasoning
- Option A — correct. The latent heat of vaporisation is the energy needed to change liquid water into water vapour without any change in temperature. During evaporation from the skin, this energy is drawn from the body in the form of heat, lowering skin temperature. Because water's latent heat of vaporisation is high, the evaporation of even a small amount of sweat removes a large amount of heat, making sweating very efficient.
- Option B — incorrect. A high specific heat capacity means water warms up slowly for a given heat input. This is important for water acting as a temperature buffer (e.g., in blood plasma and in oceans) but is not the reason sweating cools the body; sweat leaves the body as a liquid and then evaporates, so its specific heat capacity is not the relevant property.
- Option C — incorrect. It is true that each water molecule can hydrogen-bond with up to four other water molecules (a feature that gives ice its open tetrahedral structure and water its high boiling point), but this statement does not by itself explain why evaporation cools efficiently. The relevant concept is how much energy must be supplied to break those bonds during vaporisation, i.e. the latent heat of vaporisation.
- Option D — incorrect. Cohesion (water–water attraction) and adhesion (water–other surface attraction) are properties that explain capillary rise and the cohesion–tension theory of water transport in the xylem, as well as surface tension. They do not explain cooling by evaporation.
Key Takeaways
- Sweating cools the body because evaporation of water requires a large input of energy (the latent heat of vaporisation), and this energy is taken from the skin as heat.
- Latent heat of vaporisation is associated with the breaking of intermolecular hydrogen bonds during the liquid → gas phase change; specific heat capacity is associated with a rise in temperature within a single phase.
- Be ready to distinguish water's role in (i) buffering temperature (specific heat capacity), (ii) evaporative cooling (latent heat of vaporisation), and (iii) bulk transport of water (cohesion, adhesion, surface tension).
Common Mistakes
- Choosing B because candidates confuse specific heat capacity with latent heat of vaporisation. Specific heat capacity describes heat absorption with a temperature change in the liquid; latent heat of vaporisation describes heat absorption during a phase change at constant temperature — it is the latter that powers evaporative cooling.
- Choosing C because hydrogen bonding is the underlying cause of many water properties, but on its own it does not answer the question of why sweating is an efficient cooling mechanism.
- Choosing D because cohesion/adhesion are highlighted when water transport in plants is discussed; they are not relevant to cooling by evaporation.
Things to Be Careful About
- Read the command word: the question asks for the property that makes sweating an efficient means of losing heat. The mechanism is evaporation, so the answer must be the property tied to phase change — latent heat of vaporisation.
- Do not over-credit the role of hydrogen bonding; it is the reason water has a high latent heat of vaporisation, but the property being asked for is the named, measurable quantity, not the underlying bonding arrangement.
- A common distracter pattern in this type of question is to offer a true statement about water that is irrelevant to the specific biological role described in the stem. Always anchor the chosen property to the named process (here, evaporation of sweat).
Which bonds are found in the levels of structure of a protein molecule?
Options
| primary structure | secondary structure | quaternary structure | |
|---|---|---|---|
| A | covalent bond | hydrogen bond | peptide bond |
| B | covalent bond | ionic bond | disulfide bond |
| C | peptide bond | hydrogen bond | ionic bond |
| D | peptide bond | ionic bond | disulfide bond |
Working
- The primary structure is the linear sequence of amino acids linked by peptide bonds (covalent bonds between the carboxyl group of one amino acid and the amino group of the next). Although a peptide bond is technically a covalent bond, in protein-structure tables it is always listed as a peptide bond. This rules out options A and B (which say "covalent bond" for the primary structure).
- The secondary structure (α-helix and β-pleated sheet) is stabilised by hydrogen bonds between the N–H of one peptide bond and the C=O of another, both in the polypeptide backbone. This rules out option D (which gives "ionic bond" for the secondary structure).
- The quaternary structure is the association of separate polypeptide subunits; it is held together by the same R-group interactions used in tertiary structure, including ionic bonds (salt bridges), hydrogen bonds, disulfide bridges, and hydrophobic interactions. Of the choices offered, ionic bond is correct.
Answer
C
C
Background Concept
A protein is a polypeptide — one or more chains of amino acids linked end-to-end. Each amino acid shares the same basic "backbone" (–NH–CH(R)–CO–) but differs in its R-group (side chain). The function of a protein depends on its precise 3D shape, and that shape is built up in four hierarchical levels:
- Primary structure — the order of amino acids along the chain. Amino acids are joined by peptide bonds (condensation reactions between the –COOH of one amino acid and the –NH₂ of the next, releasing water). A peptide bond is a special type of covalent bond, but in protein-structure terminology it is always referred to as a peptide bond.
- Secondary structure — regular, repeated coiling or folding of the backbone, producing the α-helix and β-pleated sheet. The coils/sheets are held in shape by hydrogen bonds between the N–H of one peptide bond and the C=O of another peptide bond a few residues away. The R-groups are not involved at this level.
- Tertiary structure — the overall 3D folding of a single polypeptide chain. This is stabilised by interactions between R-groups: hydrogen bonds, ionic (electrostatic) bonds, disulfide bridges (covalent S–S bonds between two cysteine residues), and hydrophobic interactions that bury non-polar R-groups in the interior.
- Quaternary structure — the assembly of two or more polypeptide subunits into one functional protein (e.g. haemoglobin's four globin chains). The same set of R-group interactions is used to hold the subunits together: hydrogen bonds, ionic bonds, disulfide bridges and hydrophobic interactions.
The mnemonic "peptide, hydrogen, R-group, R-group" is sometimes used: peptide bonds in primary, hydrogen bonds in secondary, and the R-group interactions (hydrogen, ionic, disulfide, hydrophobic) in tertiary and quaternary.
Understanding the Question
This is a multiple-choice question (Paper 1 style) in which the candidate must select, from a 3×4 table, the correct bond for each of the primary, secondary and quaternary levels of protein structure. The mark scheme accepts only one combination, so the bond labels must be matched to the levels exactly as taught. The command word is implicit ("which…?"), and the candidate must recall the standard table of bonds-vs-structure rather than reason it out from first principles.
Approach
The fastest route is to apply the "peptide, hydrogen, R-group" rule:
- Primary → peptide bond (eliminates A and B, which say covalent)
- Secondary → hydrogen bond (eliminates D, which says ionic)
- Quaternary → R-group interaction; the only one offered that fits is ionic bond (C), since both ionic and disulfide bonds are valid R-group interactions in quaternary structure.
Step-by-Step Reasoning
- Primary structure bond: The backbone of a protein is built by peptide bonds between amino acids. Although a peptide bond is a covalent bond, the CIE convention always labels it as a peptide bond in this kind of table — saying "covalent bond" is too vague and is rejected. Only options C and D offer "peptide bond" for the primary structure.
- Secondary structure bond: The α-helix and β-pleated sheet are held by hydrogen bonds along the polypeptide backbone. C offers "hydrogen bond" for the secondary structure; D offers "ionic bond", which is wrong (ionic bonds form between charged R-groups, not along the backbone). This selects option C.
- Quaternary structure bond: With two polypeptide chains now bonded to each other, R-group interactions dominate. Option C lists "ionic bond", which is one of the legitimate R-group interactions in quaternary structure (along with hydrogen bonds, disulfide bonds and hydrophobic interactions).
- Each column of option C — peptide, hydrogen, ionic — is consistent with the standard CIE summary of protein-structure bonding, so C is the unique correct answer.
Key Takeaways
- Primary = peptide (covalent, along the backbone)
- Secondary = hydrogen (between backbone N–H and C=O groups)
- Tertiary and quaternary = R-group interactions (hydrogen, ionic, disulfide, hydrophobic)
- A peptide bond IS a covalent bond, but the CIE mark scheme treats them as separate items in this question and rejects "covalent bond" as the answer for primary structure.
- For MCQ tables of this type, eliminate options column-by-column rather than trying to evaluate the whole row at once.
Common Mistakes
- Saying "covalent bond" for the primary structure — this is too general; the mark scheme requires "peptide bond" (options A and B are wrong for this reason).
- Confusing secondary and tertiary bonding — secondary-structure hydrogen bonds run along the backbone, not between R-groups. Candidates who put "ionic" or "disulfide" in the secondary column (option D) are mixing up the levels.
- Forgetting that quaternary structure uses the same bonds as tertiary — any of hydrogen, ionic, disulfide or hydrophobic bonds can hold subunits together. If an option offers a legitimate R-group bond in the quaternary column it is acceptable, even though other R-group bonds would also be correct biologically.
Things to Be Careful About
- In CIE mark schemes, "covalent bond" in the primary-structure column is rejected — write "peptide bond" specifically.
- The "hydrogen bond" answer for the secondary structure must refer to bonds between peptide-bond groups; "between R-groups" would be a tertiary/quaternary interaction.
- Do not let the fact that "peptide bond" is a type of "covalent bond" trick you into choosing A or B — these questions treat them as distinct entries in the table.
Prokaryotes and eukaryotes use extracellular enzymes.
Extracellular digestive enzymes are found in the external environments of some prokaryotes.
Some prokaryotes are digested by hydrolytic enzymes during phagocytosis by eukaryotic cells.
Which row shows the locations where extracellular enzymes are produced?
Options
| site of production of digestive enzymes used by prokaryotes | site of production of hydrolytic enzymes used by eukaryotic phagocytes | |
|---|---|---|
| A | inside cells | inside cells |
| B | inside cells | outside cells |
| C | outside cells | inside cells |
| D | outside cells | outside cells |
Working
'Extracellular' describes where an enzyme functions, not where it is made. All enzymes are proteins synthesised on ribosomes inside cells. The two enzymes in the question are both produced intracellularly and only act outside the cell afterwards:
- Digestive enzymes used by prokaryotes — secreted across the plasma membrane to digest substrates in the external environment; synthesised on ribosomes inside the prokaryote cell.
- Hydrolytic enzymes used by eukaryotic phagocytes — stored in lysosomes (formed via the rough ER and Golgi apparatus) within the phagocyte; synthesised inside the eukaryotic cell and released into the phagosome after engulfment.
Both sites of production are inside cells, so the correct row is A.
Answer
A
A
Background Concept
Enzymes are globular proteins, and like all proteins they are synthesised on ribosomes. In both prokaryotes and eukaryotes, ribosomes carry out translation, so every enzyme — regardless of where it ends up acting — is produced inside a cell. The terms intracellular and extracellular describe the site of action of an enzyme, not its site of synthesis.
- Extracellular enzymes are secreted across the plasma membrane and act outside the cell. Examples include bacterial amylases, proteases and cellulases released into the surrounding medium to break down large substrates into smaller molecules that can then be absorbed.
- Intracellular enzymes act within the cell that makes them. In eukaryotes, hydrolytic (digestive) enzymes that need to be kept separate from the cytoplasm are packaged into lysosomes by the rough endoplasmic reticulum and Golgi apparatus. Phagocytes use these lysosomal hydrolases to digest engulfed microorganisms inside a phagosome.
Understanding the Question
The stem reminds us that both prokaryotes and eukaryotes use extracellular enzymes, then describes two examples:
- A prokaryote that secretes digestive enzymes into its external environment.
- A eukaryotic phagocyte that digests an engulfed prokaryote using hydrolytic enzymes.
The table asks for the site of production of each enzyme, not the site of action. The four rows offer combinations of 'inside cells' or 'outside cells' for each of the two enzymes.
The trap is the word 'extracellular' — many students read 'extracellular enzymes' and assume 'outside cells' for production, but the prefix only refers to where the enzyme works.
Approach
For each enzyme, decide where it is synthesised:
- A prokaryotic secreted enzyme: made on cytoplasmic ribosomes, then exported through the plasma membrane → produced inside cells.
- A eukaryotic phagocyte's lysosomal hydrolase: made on ribosomes of the rough ER, processed in the Golgi, packaged into lysosomes → produced inside cells.
Both productions are intracellular, giving row A.
Step-by-Step Reasoning
- The word extracellular in the stem applies to the digestive enzymes secreted by the prokaryote. Although these enzymes act outside the prokaryote, they are still synthesised by ribosomes inside the prokaryote cytoplasm and only then exported. So the site of production is inside cells.
- The hydrolytic enzymes inside the eukaryotic phagocyte are lysosomal enzymes. They are made by ribosomes on the rough ER, modified in the Golgi apparatus, and stored in lysosomes — all inside the phagocyte. They are released into the phagosome only after the phagocyte has engulfed a prokaryote. Site of production is inside cells.
- Cross-checking the table, only row A ('inside cells' / 'inside cells') is consistent with both productions being intracellular.
- Distractors:
- B is wrong because it places the phagocyte's hydrolases outside cells; in reality they are stored in lysosomes inside the phagocyte.
- C is wrong because prokaryotic secreted enzymes are made inside, not outside, the cell.
- D is wrong for the same reasons as B and C combined.
Key Takeaways
- All enzymes are proteins and are therefore synthesised on ribosomes — i.e. inside cells.
- The labels intracellular and extracellular refer to the location of action, not the location of production.
- Lysosomal hydrolases are a classic example of an enzyme that is intracellular in production and intracellular in action (within the phagosome/lysosome compartment), even though the substrate (an engulfed bacterium) is 'foreign'.
Common Mistakes
- Reading 'extracellular enzyme' as 'produced outside the cell'. The prefix describes function, not synthesis.
- Assuming that because the substrate (a bacterium) is outside the cell, the enzymes digesting it are also extracellular. During phagocytosis the substrate is brought inside the phagocyte, into a phagosome that fuses with a lysosome, so digestion is intracellular.
- Confusing 'secreted' with 'made'. A secreted enzyme has to be made before it can be secreted, and synthesis always happens inside a cell.
Things to Be Careful About
- Keep the two contexts strictly separate: the prokaryote's own secreted enzymes versus the phagocyte's lysosomal enzymes. The question is testing both at once.
- Note the careful wording in the table: 'site of production', not 'site of action' — this is the cue that should prompt you to think about ribosomes, not secretion.
- Don't be misled by the presence of the word 'extracellular' at the top of the question; apply the definition correctly to the production sites asked for in the table.
Amylase breaks down starch molecules.
Which substance will have the same number of molecules for the duration of this reaction?
Options
A amylase
B water
C maltose
D amylose
Working
Amylase is an enzyme — it acts as a biological catalyst and is not consumed during the reaction, so the number of amylase molecules stays constant.
Evaluating the other options:
- B (water): water is a reactant in this hydrolysis reaction; it is used up as the glycosidic bonds are broken, so the number of water molecules decreases.
- C (maltose): maltose is a product of the breakdown of starch; the number of maltose molecules increases as the reaction proceeds.
- D (amylose): amylose is a substrate (a component of starch); the number of amylose molecules decreases as they are hydrolysed.
Answer
A
A
Background Concept
Enzymes are biological catalysts — they speed up metabolic reactions without being changed or used up themselves. The molecules of an enzyme can therefore take part in many successive reaction cycles, binding substrate at the active site, catalysing its conversion to product, releasing the product and then binding another substrate molecule.
Amylase catalyses the hydrolysis of starch. Starch is a polymer made of α-glucose units linked by glycosidic bonds; it consists of two components, amylose (mostly unbranched) and amylopectin (branched). Hydrolysis means that a water molecule is added across each glycosidic bond that is broken, releasing smaller sugars such as maltose (a disaccharide of two glucose units). The full reaction is:
Because water is consumed (not produced) this reaction is a hydrolysis.
Understanding the Question
The question asks which substance has a constant number of molecules over the course of the reaction. To answer it, the molecules involved must be sorted into the three roles of a catalysed reaction:
- Enzyme (catalyst) — unchanged in quantity.
- Substrate(s) — consumed, so quantity falls.
- Product(s) — generated, so quantity rises.
Approach
Identify which of the four options is the enzyme, which is a substrate and which is a product. The enzyme is the only one whose molecule count will remain the same throughout.
Step-by-Step Reasoning
- Amylase (option A) is the enzyme that catalyses the breakdown of starch. Like all enzymes, it is not consumed by the reaction. Its molecule count therefore stays the same — it can bind substrate, release product and bind again indefinitely (until something else denatures or degrades it).
- Water (option B) is a reactant in hydrolysis. Each time a glycosidic bond in starch is broken, one water molecule is incorporated into the products. The number of free water molecules therefore decreases during the reaction.
- Maltose (option C) is a product. As starch is broken down, more and more maltose molecules appear in the mixture, so the number of maltose molecules increases.
- Amylose (option D) is a substrate. It is being broken down, so the number of intact amylose molecules decreases over time.
Only amylase remains constant — answer A.
Key Takeaways
- Enzymes are catalysts: they are not consumed and not changed in the reactions they catalyse.
- In a hydrolysis reaction, water is a reactant (its number falls), substrates are consumed and products accumulate.
- Recognising the role of each component (enzyme / substrate / product) is the fastest way to predict how its quantity will change.
Common Mistakes
- Choosing water: students often forget that hydrolysis uses water; they assume that because enzymes work in watery surroundings the water is somehow inert.
- Choosing amylose: confusing amylose (a substrate component of starch) with amylase (the enzyme). The similar-looking names are a classic trap.
- Choosing maltose: thinking that anything listed must change — but maltose is a product, so it increases rather than decreases; either way, it does not stay constant.
Things to Be Careful About
- The answer depends on the time-scale of the reaction. Over very long times the enzyme may eventually be denatured by heat or pH, but within the duration of a normal reaction the enzyme count is effectively constant.
- Make sure the number of molecules is what's constant — enzymes may temporarily bind substrate (forming an enzyme–substrate complex), but the total number of enzyme molecules (free + bound) does not change.
Which graphs could show the effect of pH on the rate of enzyme-catalysed reactions?
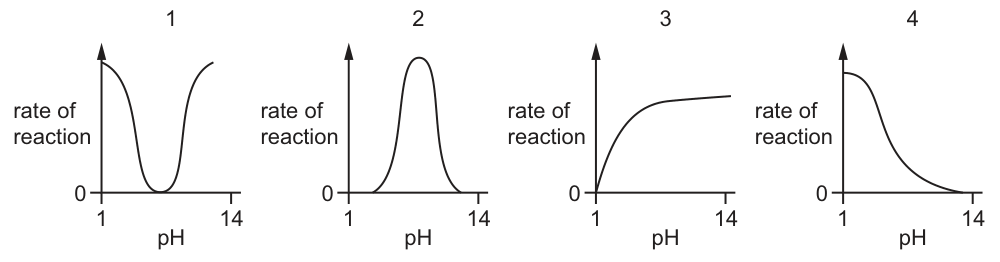
Options
A 1 and 2
B 1 and 3
C 2 and 4
D 3 and 4
Working
Enzymes have an optimum pH at which the active site is in its correct shape and the rate of reaction is maximal. On either side of the optimum, the rate decreases because the change in H⁺/OH⁻ concentration disrupts the ionic and hydrogen bonds that maintain tertiary structure, denaturing the active site.
The valid pH curves for an enzyme are therefore:
- a single bell-shaped curve (e.g. most enzymes, with an optimum around neutral pH) — Graph 2.
- the same shape, but with the peak shifted to one end of the pH range (e.g. pepsin in the stomach has an optimum near pH 2), so the curve appears to start high and fall as pH rises — Graph 4.
Graph 1 (two peaks) is not a typical enzyme response, and Graph 3 (a plateau) does not represent enzyme denaturation at extreme pH.
Answer
C
C
Background Concept
Enzymes are globular proteins whose tertiary structure is held together by hydrogen bonds, ionic bonds and hydrophobic interactions. The active site — the small pocket where substrate binds — has a specific 3-D shape that is only complementary to the substrate within a narrow pH window.
When the pH moves away from the optimum:
- Excess H⁺ (low pH) or OH⁻ (high pH) changes the ionisation of R groups in the amino acids lining the active site (e.g. –COOH ⇌ –COO⁻ and –NH₂ ⇌ –NH₃⁺).
- The disrupted ionic/H-bond network alters the shape of the active site so the substrate can no longer bind efficiently.
- At extremes of pH the enzyme becomes denatured, although it does not always unfold completely.
This produces a characteristic bell-shaped plot of rate against pH with a single optimum (e.g. amylase near pH 7, pepsin near pH 2, trypsin near pH 8). Different enzymes simply have their optimum at different positions on the pH scale.
Understanding the Question
The question presents four different shapes of graph plotting rate of reaction against pH (from 1 to 14) and asks which could correctly show the effect of pH on an enzyme-catalysed reaction. "Could" is important: any shape that is biologically plausible for some enzyme is acceptable. We must therefore consider not just the common neutral-optimum case, but also enzymes adapted to unusual pH environments.
Approach
Mentally superimpose a single bell-shaped curve on each of the four graphs. Any graph that is consistent with one bell-shaped curve (peaked somewhere between pH 1 and 14) is valid; any graph that cannot be generated from a single bell-shaped curve is not.
Step-by-Step Reasoning
Graph 1 — two peaks (low pH and high pH) with a trough in the middle. A single enzyme has only one optimum pH. Two peaks would require two different enzymes, each with its own optimum. This is not a valid representation of an enzyme-catalysed reaction. ❌
Graph 2 — single bell-shaped peak around neutral pH. This is the textbook enzyme pH curve and is unambiguously correct. ✔
Graph 3 — rate rises and then plateaus as pH increases. A plateau implies the enzyme is unaffected by high pH; in reality the active site would be denatured and the rate would fall. Not a valid enzyme curve. ❌
Graph 4 — rate starts high at low pH and decreases as pH rises. This is exactly the shape of a bell-shaped curve whose optimum lies at the left-hand (acid) end of the pH scale, just like pepsin (optimum pH ≈ 2) in the stomach. The descending arm of the bell is being plotted, but the curve itself is still the standard enzyme shape. ✔
Therefore the two graphs that could correctly show the effect of pH on enzyme activity are 2 and 4, giving answer C.
Key Takeaways
- A correct enzyme pH curve is bell-shaped with one optimum.
- Different enzymes have different optima; the position of the optimum on the pH axis depends on the enzyme's environment (e.g. pepsin at pH 2, salivary amylase near pH 7, trypsin at pH 8).
- A two-peaked curve or a plateau cannot be produced by a single enzyme.
Common Mistakes
- Rejecting Graph 4 because the optimum is not shown as a peak. The peak is just at the very low-pH end of the range; the descending arm is still consistent with a normal bell-shaped curve.
- Accepting Graph 1 because it "shows two optima". A single enzyme has a single optimum; a two-peaked graph would only make sense for a mixed enzyme solution, not for a single enzyme.
- Accepting Graph 3 because the rate is high. Real enzymes denature at extreme pH, so a plateau is biologically impossible.
Things to Be Careful About
- The question asks which graphs could show the effect, so a graph with an optimum at the edge of the pH range is still valid as long as the overall shape is a single bell.
- Don't confuse an enzyme's pH response (bell-shaped) with its temperature response (bell-shaped but with a sharp fall at high temperature due to denaturation). The plateau in Graph 3 is not even a typical temperature response.
- Always read the axis labels: both axes are the same for all four graphs (rate of reaction vs. pH from 1 to 14).
After a heart attack, the enzyme lactate dehydrogenase leaks into the blood plasma from damaged heart muscle.
What is required to measure the activity of lactate dehydrogenase activity in a sample of blood plasma?
| sterilisation of blood plasma by heating | incubation of sample with substrate for lactate dehydrogenase | incubation of sample with lactate dehydrogenase inhibitor | |
|---|---|---|---|
| A | ✓ | ✓ | ✓ |
| B | ✗ | ✓ | ✓ |
| C | ✗ | ✓ | ✗ |
| D | ✗ | ✗ | ✓ |
key
✓ = required
✗ = not required
Options
A row A
B row B
C row C
D row D
Working
To measure the activity of lactate dehydrogenase in a blood plasma sample, the sample must be incubated with the substrate for lactate dehydrogenase so that the enzyme can catalyse its reaction; the rate of product formation (or substrate depletion) is then measured.
- Sterilisation by heating is not required and would actually denature the enzyme, destroying its activity.
- An inhibitor is not required; adding an inhibitor would reduce activity and prevent accurate measurement.
Only the incubation with substrate is required: ✗ ✓ ✗.
Answer
C
C
Background Concept
Lactate dehydrogenase (LDH) is an intracellular enzyme found in many tissues, including heart muscle. It catalyses the interconversion of lactate and pyruvate:
Because LDH is normally contained inside cells, its presence in blood plasma is a clinical marker of tissue damage (e.g. after a myocardial infarction / heart attack).
Measuring enzyme activity in a sample always requires the same core elements:
- The enzyme (already present in the blood plasma sample).
- A supply of its substrate in excess, so the enzyme has something to act upon.
- Controlled conditions (suitable temperature, pH).
- A way of quantifying the reaction (e.g. following NADH absorbance at 340 nm with a colorimeter/spectrophotometer, since NADH absorbs light at that wavelength but NAD⁺ does not).
The rate of product formation (or substrate loss) per unit time gives the enzyme activity.
Understanding the Question
The question asks which of three procedural steps is genuinely required to measure LDH activity in a plasma sample. The steps are:
- Sterilising the blood plasma by heating.
- Incubating the sample with the substrate for LDH.
- Incubating the sample with an LDH inhibitor.
Each must be judged on whether it contributes to, or interferes with, measuring how fast LDH catalyses its reaction.
Approach
Apply first principles of enzyme assays: an enzyme assay needs the enzyme + substrate + a measurable signal, under suitable conditions. Any step that destroys the enzyme or suppresses its activity defeats the purpose of the assay.
Step-by-Step Reasoning
- Sterilisation by heating — not required. LDH is a protein; heating it to sterilising temperatures would denature it, destroying its tertiary structure and active site. You would then be measuring zero activity. Sterilisation is also unnecessary: a clinical assay is performed on the sample, not on a culture.
- Incubation with substrate for LDH — required. Without substrate, no reaction occurs and the activity cannot be quantified. Adding lactate (with NAD⁺) allows LDH to catalyse the reaction, and the production of pyruvate (or NADH) can be measured over time.
- Incubation with an LDH inhibitor — not required. An inhibitor would slow or stop the reaction, preventing an accurate measurement of activity. Inhibitors are used in separate inhibition studies, not in standard activity assays.
Therefore the required combination is ✗ ✓ ✗, which corresponds to row C.
Eliminating the other options:
- A (✓ ✓ ✓) — heating destroys the enzyme.
- B (✗ ✓ ✓) — adding an inhibitor defeats the purpose of measuring activity.
- D (✗ ✗ ✓) — without substrate, no reaction can be measured at all.
Key Takeaways
- An enzyme activity assay requires enzyme + substrate + quantifiable signal under suitable conditions.
- Heating a protein-based sample denatures the enzyme and must be avoided.
- Inhibitors suppress activity and are not part of a standard activity measurement.
- LDH in plasma is a diagnostic marker for tissue damage (e.g. myocardial infarction) because the enzyme leaks out of damaged cells.
Common Mistakes
- Choosing A because "sterilisation sounds like good lab practice" — heating denatures the protein enzyme.
- Choosing B because an inhibitor sounds scientifically useful — it prevents the very activity you are trying to measure.
- Choosing D because incubation steps are routine — without substrate there is nothing for the enzyme to do.
Things to Be Careful About
- "Required" in this context means necessary to obtain a valid measurement of activity, not "good practice in general".
- Remember that enzymes are proteins and are heat-sensitive.
- The standard clinical LDH assay relies on following NADH production (or disappearance) spectrophotometrically — the substrate (lactate) and coenzyme (NAD⁺) are both essential.
Which graph correctly shows and ?
Options
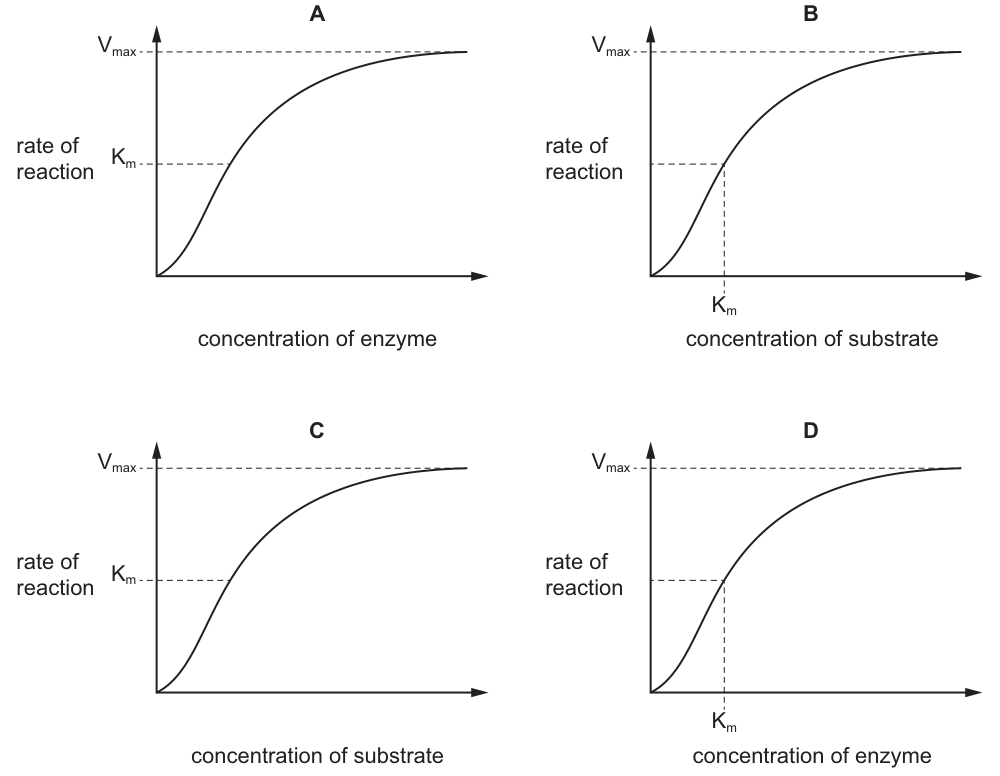
Answer
is the Michaelis constant, defined as the concentration of substrate at which the reaction rate equals . It is therefore read off the x-axis of a rate-vs-[substrate] graph at the point corresponding to half the maximum rate.
- Graph A uses [enzyme] on the x-axis and places on the y-axis — both incorrect.
- Graph B uses [substrate] on the x-axis and places on the x-axis at half — correct.
- Graph C uses [substrate] on the x-axis but places on the y-axis — incorrect.
- Graph D uses [enzyme] on the x-axis — is not defined for varying enzyme concentration.
B
B
Background Concept
When the rate of an enzyme-catalysed reaction is plotted against substrate concentration (with enzyme concentration held constant), the curve has a characteristic shape:
- At low [substrate], the rate rises almost linearly because every substrate molecule quickly finds an empty active site.
- As [substrate] increases, the active sites become saturated; the rate levels off at a plateau, , because the enzyme molecules are working as fast as they can and the rate is limited by the finite number of active sites available per unit time.
The Michaelis constant, , is defined as the substrate concentration at which the reaction rate is exactly half of . It is an inverse measure of the apparent affinity of the enzyme for its substrate: a small means the enzyme reaches half its maximum rate at a low [substrate] (high affinity); a large means the enzyme needs a lot of substrate before it gets going (lower apparent affinity).
Crucially, is a property of the enzyme–substrate pair, so it is only meaningful when the x-axis is concentration of substrate. If you instead plot rate against concentration of enzyme (with substrate held in excess), the rate simply rises in direct proportion to [enzyme] — there is no plateau imposed by active-site saturation in the same way, and is not defined on such a graph.
Understanding the Question
The question supplies four Michaelis-Menten-style curves and asks which one correctly displays both and . Two features must be right simultaneously:
- The independent variable on the x-axis must be concentration of substrate (not enzyme), because is a substrate concentration.
- The position of must be read off the x-axis (a substrate concentration value), specifically at the [substrate] that gives a rate equal to . Drawing on the y-axis is a misuse of the term.
Approach
Eliminate each graph by checking (a) the axis label and (b) where the dashed lines place . The graph that passes both tests is the answer.
Step-by-Step Reasoning
- Graph A: x-axis = concentration of enzyme, and is marked on the y-axis. Wrong on both counts — is not defined for varying [enzyme], and a constant cannot sensibly sit on the y-axis of a rate plot.
- Graph B: x-axis = concentration of substrate (correct), and the dashed line drops from half on the y-axis down to on the x-axis (correct). This is the textbook definition of . Correct.
- Graph C: x-axis = concentration of substrate (correct), but is placed on the y-axis (incorrect). has units of concentration, so it must sit on the x-axis.
- Graph D: x-axis = concentration of enzyme (incorrect). has no defined position on a rate-vs-[enzyme] graph.
Only Graph B satisfies both requirements.
Key Takeaways
- is the plateau rate — the maximum rate when all active sites are saturated with substrate.
- is the [substrate] at — always read off the x-axis of a rate-vs-[substrate] graph.
- only makes sense on a Michaelis–enten plot (rate vs [substrate]); it is not a feature of rate vs [enzyme] graphs.
Common Mistakes
- Drawing on the y-axis because is there — confusing the axis on which each quantity belongs.
- Assuming any plateau-shaped curve is a valid / diagram, regardless of what is plotted on the x-axis.
- Treating as a property of the enzyme alone rather than of the enzyme–substrate pair.
Things to Be Careful About
- has units of concentration (e.g. ) and so must appear on the concentration axis (x-axis), not on the rate axis (y-axis).
- A rate-vs-[enzyme] curve also plateaus, but for a different reason (running out of substrate, not active sites); is not read from such a graph.
Cell membranes become less fluid as the temperature decreases.
Bacteria and yeast cannot regulate their cell temperatures.
How do bacteria and yeast maintain the fluidity of their cell membranes when the temperature decreases?
1 They increase the numbers of unsaturated fatty acids in their phospholipid molecules.
2 They increase the numbers of saturated fatty acids in their phospholipid molecules.
3 They increase the numbers of cholesterol molecules in their cell membranes.
Options
A 1 and 3
B 1 only
C 2 and 3
D 2 only
Working
As temperature falls, phospholipid fatty acid tails pack more closely together, so the membrane becomes more viscous and less fluid. Bacteria and yeast counteract this by altering membrane composition.
- Statement 1 – Increase unsaturated fatty acids: TRUE. Unsaturated fatty acids contain C=C double bonds that introduce kinks in the hydrocarbon tails, preventing tight packing and so maintaining fluidity at low temperatures.
- Statement 2 – Increase saturated fatty acids: FALSE. Saturated fatty acids have no double bonds, so their tails pack tightly together — this would make the membrane even less fluid at low temperatures.
- Statement 3 – Increase cholesterol molecules: TRUE. Cholesterol (and the equivalent sterol ergosterol in yeast) disrupts the regular packing of phospholipid tails, acting as a fluidity buffer that helps maintain membrane fluidity as the temperature falls.
Both statements 1 and 3 are correct, giving option A.
Answer
A
A
Background Concept
The fluid mosaic model describes the cell-surface membrane as a phospholipid bilayer in which phospholipids and proteins can move laterally. The fluidity of the membrane is determined mainly by the nature of the fatty acid tails of the phospholipids and, in many cells, by the presence of cholesterol.
- Saturated fatty acids have no carbon–carbon double bonds. Their tails are straight, so they pack together tightly. Tighter packing makes the membrane more viscous and less fluid.
- Unsaturated fatty acids contain one or more C=C double bonds. Each double bond introduces a kink (bend) in the tail, which prevents neighbouring tails from packing closely. This keeps the membrane more fluid.
- Cholesterol sits among the phospholipid tails. At high temperatures it restrains phospholipid movement and reduces fluidity; at low temperatures it prevents the tails from packing too closely, so it maintains fluidity. In effect, cholesterol is a fluidity buffer.
When the temperature drops, phospholipid tails lose kinetic energy and pack more closely, so membranes tend to become more rigid. Organisms that cannot control their own body temperature (poikilotherms such as bacteria and yeast) must therefore adjust the composition of their membranes to keep them functional.
Understanding the Question
The stem tells us two things:
- Membranes become less fluid as temperature decreases (a consequence of reduced kinetic energy of the fatty acid tails).
- Bacteria and yeast are unable to regulate their own internal temperature.
The question then asks how these organisms maintain membrane fluidity at low temperatures, and gives three candidate mechanisms. Each statement is independent, and the candidate must decide which of them are valid responses. The options pair the statements: 1 only, 2 only, 1 and 3, or 2 and 3.
Approach
Evaluate each statement by asking: Does this change to the membrane counteract the stiffening caused by lower temperature? If yes, the statement is correct; if no, or if it makes things worse, the statement is wrong.
Step-by-Step Reasoning
Statement 1: increase the numbers of unsaturated fatty acids.
Unsaturated tails have kinks that prevent close packing, so introducing more of them keeps the membrane more fluid. This directly counteracts cold-induced rigidification. Statement 1 is correct.
Statement 2: increase the numbers of saturated fatty acids.
Saturated tails are straight and pack tightly. Adding more of them would make the membrane even less fluid — the opposite of what is needed at low temperature. Statement 2 is incorrect.
Statement 3: increase the numbers of cholesterol molecules.
Cholesterol (and the analogous sterol ergosterol made by yeast) inserts between phospholipid tails. By disrupting regular packing it raises membrane fluidity when the temperature is low. Some bacteria also contain sterol-like molecules (hopanoids) that play the equivalent role, and yeast is a eukaryote that produces ergosterol. For the purposes of A-level biology, increasing cholesterol/sterol is accepted as a valid mechanism in both bacteria and yeast. Statement 3 is correct.
Since statements 1 and 3 are both correct, the answer is the option that combines 1 and 3 — option A.
Key Takeaways
- Membrane fluidity is controlled by fatty-acid saturation and by sterols such as cholesterol.
- Cold → less fluid membrane; cells respond by increasing unsaturated fatty acids and cholesterol (or equivalent sterols).
- Increasing saturated fatty acids has the opposite effect and would worsen cold-induced rigidification.
Common Mistakes
- Choosing D (2 only) because students associate 'more saturated' with 'stronger membrane' rather than thinking about packing and fluidity.
- Choosing B (1 only) and forgetting that cholesterol has a fluidity-buffering role, or assuming wrongly that cholesterol is found only in animal cells.
- Choosing C (2 and 3) by confusing the effect of saturated fatty acids with that of unsaturated ones.
Things to Be Careful About
- The word 'cholesterol' is not strictly accurate for yeast (which uses ergosterol) or for most bacteria, but the Cambridge mark scheme accepts statement 3 as a valid mechanism for these organisms.
- 'Saturated' and 'unsaturated' describe the fatty acid portion of the phospholipid, not the phospholipid head.
- Read the stem carefully: it specifies organisms that cannot regulate temperature — adaptations must therefore be compositional, not behavioural.
Samples X, Y and Z are epidermal tissues cut from an onion. Each epidermal tissue was immersed in one of three different concentrations of a salt solution for 30 minutes.
A student observed each tissue sample with a light microscope. Then the student estimated the concentration of each salt solution using a scale.
The diagram shows the scale. P, Q and R represent the estimated concentration of the three salt solutions.

The photomicrographs show the appearance of the tissues in samples X, Y and Z.
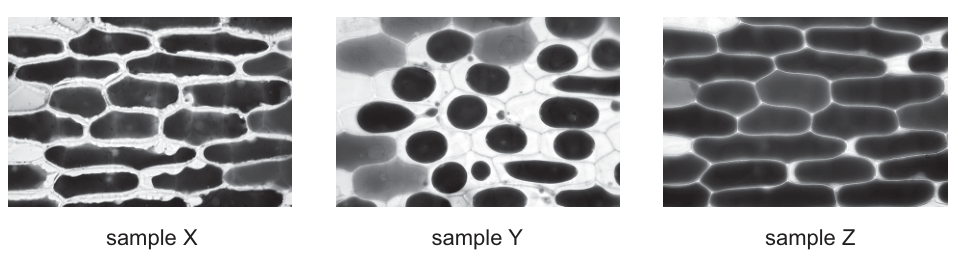
Which row shows the estimated concentrations of the salt solutions in which samples Y and Z were immersed?
Options
| sample Y | sample Z | |
|---|---|---|
| A | P | Q |
| B | P | R |
| C | Q | R |
| D | R | P |
Answer
D
Reasoning
-
In sample Y the protoplasts are clearly shrunken and pulled away from the cell walls (severe plasmolysis). This means the cells lost water by osmosis, so the external solution had a much lower (more negative) water potential than the cell contents — i.e. a highly concentrated salt solution. On the scale this corresponds to R.
-
In sample Z the protoplasts are pressed against the cell walls (turgid, no plasmolysis). This means the cells did not lose water, so the external solution was hypotonic / very dilute. On the scale this corresponds to P.
Therefore Y = R and Z = P, which is row D.
D
Background Concept
Osmosis is the net movement of water molecules across a partially permeable membrane from a region of higher water potential () to a region of lower water potential. Water potential is measured in ; pure water has and all solutes lower the water potential (solutions have a negative ).
When a living plant cell (with a rigid cellulose cell wall and a partially permeable cell surface membrane) is placed in a salt solution:
- Hypotonic solution (external higher than the cell's ): water enters the vacuole, the protoplast swells and presses against the cell wall — the cell is turgid.
- Isotonic solution (external = cell ): no net movement of water.
- Hypertonic solution (external lower than the cell's ): water leaves the vacuole, the protoplast shrinks and pulls away from the cell wall — the cell is plasmolysed.
Plasmolysis therefore only occurs when the external solution is more concentrated than the cell sap, and the more concentrated the solution, the more severe the plasmolysis.
Understanding the Question
Three onion epidermal tissues (X, Y, Z) have been immersed in three different salt solutions of unknown concentration for 30 minutes. The student has then used a light microscope to look at each sample and estimated the concentration of each solution by placing it on a scale running from "distilled water" (low concentration, left) to "concentrated salt solution" (high concentration, right). Three points P, Q and R are marked along the scale.
The candidate is given a photomicrograph of each sample and must decide, from the appearance of the cells, where on the scale Y and Z belong.
The command word is essentially "interpret and deduce" — read the photomicrographs, recognise the extent of plasmolysis, and translate that into a position on the concentration scale.
Approach
- Decide for each of Y and Z whether the cells are turgid, incipiently plasmolysed, or fully plasmolysed.
- Link degree of plasmolysis to external concentration: more plasmolysis → higher concentration → further to the right on the scale.
- Match Y and Z to the appropriate letters (P, Q or R) and select the row.
Step-by-Step Reasoning
-
Sample Y: the photomicrograph shows onion cells in which the dark, rounded protoplasts are clearly shrunken and lying free in the centre of each cell, with obvious empty space between the protoplast and the cell wall. The cell wall is still rectangular, but the protoplast is no longer touching it. This is severe plasmolysis, meaning the external solution had a much lower (more negative) water potential than the cell contents. The cells lost a lot of water, so the salt solution was very concentrated — point R on the scale.
-
Sample Z: the photomicrograph shows onion cells that look normal, with the protoplast pressed firmly against the cell wall and no visible gap between the protoplast and the wall. This is a turgid appearance; the cells did not lose water, so the external solution was hypotonic (dilute) relative to the cell contents. The salt solution had a very low concentration — point P on the scale.
-
Putting the two together: Y = R, Z = P, which is row D.
(For completeness, X sits between these extremes — turgid but in a slightly more concentrated solution than Z, so it would correspond to Q. The student uses exactly this kind of reasoning to place each tissue on the scale.)
Key Takeaways
- Plasmolysis is the visible result of a plant cell losing water to a hypertonic external solution.
- The more negative the external water potential, the more severe the plasmolysis.
- This is the standard method for estimating the water potential of a plant tissue: find the concentration at which plasmolysis is just about to occur (incipient plasmolysis) — the cell's is approximately equal to that of the solution at that point.
Common Mistakes
- Looking at the cell wall rather than the protoplast. The cell wall is rigid and does not change shape; it is the protoplast that shrinks.
- Assuming that any empty-looking cell is plasmolysed. Empty-looking space between cells (where they are not touching) is normal in epidermal strips and is not plasmolysis — the diagnostic feature is a gap between the protoplast and its own cell wall.
- Reversing the direction of the scale: P is on the distilled water side (dilute), R is on the concentrated salt solution side.
- Confusing "incipient plasmolysis" with "full plasmolysis" and swapping Y and Z.
Things to Be Careful About
- "Turgid" means the protoplast is in contact with the cell wall, but the wall prevents further expansion — this happens in a hypotonic (or very dilute) solution, not in distilled water being a "concentrated" one.
- The scale is not evenly graded in any specified units; what matters is the order P (low) < Q (medium) < R (high) and the relative position of each sample on that order.
- Onion epidermis is coloured because of anthocyanin in the vacuole; this is what makes the protoplasts appear dark in the photomicrograph and makes plasmolysis easy to see.
The graph shows the results of an osmosis investigation using potato tissue.
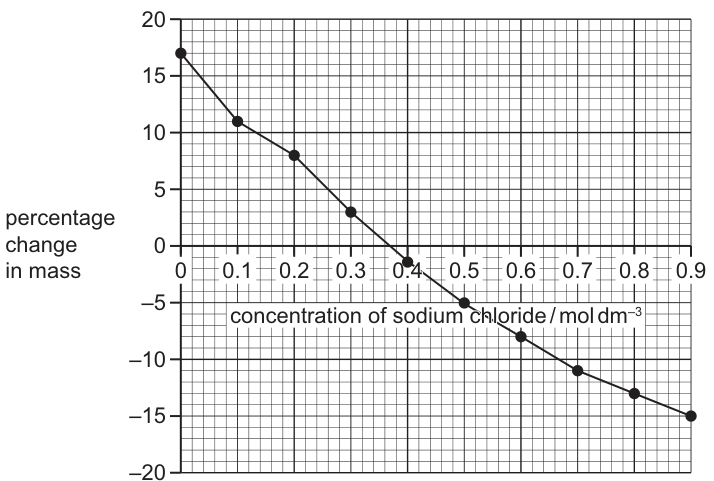
What is the concentration of sodium chloride solution that has the equivalent water potential to this potato tissue and what is correct about the movement of water at that point?
Options
A and no net movement of water
B and net movement of water out of the potato tissue
C and no net movement of water
D and net movement of water into the potato tissue
Working
At the point where there is no change in mass of the potato tissue, the line on the graph crosses the x-axis. From the graph this occurs at approximately . At this concentration the water potential of the sodium chloride solution is equal to the water potential of the potato cells, so water molecules enter and leave the cells at equal rates — there is no net movement of water.
Answer
A
A
Background Concept
Osmosis is the net movement of water molecules across a partially permeable membrane from a region of higher (less negative) water potential to a region of lower (more negative) water potential. Plant cells in a solution of higher water potential gain mass (turgid); in a solution of lower water potential they lose mass (plasmolysed). The concentration at which a plant tissue neither gains nor loses mass is the point at which the water potential of the external solution equals the water potential of the cells — at this point water still moves in both directions across the membrane, but the rates in each direction are equal, so there is no net change in mass.
Understanding the Question
A graph of percentage change in mass against sodium chloride concentration is the standard way to present an osmosis experiment with potato chips. The y-axis shows percentage change in mass (a positive value = tissue gained water, a negative value = tissue lost water). The x-axis shows the external solute concentration. The question asks: (1) at what concentration does the line cross zero change in mass, and (2) what does that point mean for the movement of water?
Approach
The key step is to identify the x-intercept of the curve — the concentration at which the line crosses the y = 0 line. By reading across from the data points: at 0.3 mol/dm³ the change is +3% (still gaining mass) and at 0.4 mol/dm³ the change is about −1% (slight loss), so the x-intercept lies between these, at approximately 0.37 mol/dm³. Biologically, this is the concentration whose water potential matches that of the potato cells, and consequently there is no net water movement.
Step-by-Step Reasoning
- The graph shows a negative linear relationship: as the sodium chloride concentration increases, the percentage change in mass decreases, going from +17% (mass gain) at 0 mol/dm³ to −15% (mass loss) at 0.9 mol/dm³.
- The x-intercept is the concentration at which the curve crosses the y = 0 line. From the graph, this occurs at approximately 0.37 mol/dm³.
- At this point, the water potential inside the potato cells () is exactly equal to the water potential of the surrounding solution (). Because there is no water potential gradient, there is no net movement of water into or out of the cells — even though water molecules continue to cross the membrane in both directions.
- The answer is therefore A: 0.37 mol/dm³ and no net movement of water.
Why the other options are wrong:
- B (17 mol/dm³, water out): the value 17 comes from misreading the y-intercept (the +17% change in mass at 0 mol/dm³) as a concentration. At 17 mol/dm³, far more water would leave the cells than the graph shows.
- C (0 mol/dm³, no net movement): in pure water the cells gain mass dramatically (the graph shows +17% at 0 mol/dm³), so there is a large net influx of water, not zero movement.
- D (0.9 mol/dm³, water in): at the highest concentration tested, the cells lose about 15% of their mass, indicating a net outflow of water, not inflow.
Key Takeaways
- The x-intercept of a percentage-change-in-mass vs concentration graph gives the concentration at which the external solution has the same water potential as the tissue.
- "No net movement of water" at this point is correct: water molecules still move across the membrane in both directions, but at equal rates, so the net change is zero.
- A negative slope on such a graph is expected: as external solute concentration rises, the external water potential falls, and water leaves the cells.
Common Mistakes
- Reading the y-intercept (a percentage) as a concentration.
- Confusing "no net movement" with "no movement of water at all" — water molecules still cross the membrane in both directions; only the net flux is zero.
- Selecting the highest concentration on the x-axis (0.9 mol/dm³) because the curve ends there, instead of identifying the x-intercept.
Things to Be Careful About
- Read the x-intercept carefully; values close together (0.3, 0.4) make a small reading error easy.
- "No net movement" is the precise wording — do not write "no movement of water".
- The water potential of pure water is defined as 0 kPa, and solutes make water potential negative; the potato cell sap has a (negative) water potential equal to that of a 0.37 mol/dm³ NaCl solution.
Some agar was coloured pink using a pH indicator. The pink agar was then used to make three agar cubes with different dimensions.
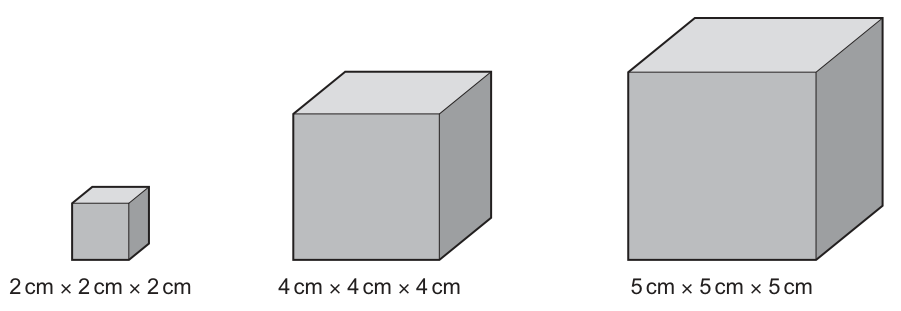
The cubes were placed in a beaker and covered with hydrochloric acid. The temperature of the experiment was standardised at .
Hydrochloric acid diffused into the agar cubes causing the cubes to become colourless.
What is the surface area to volume ratio of the agar cube that became colourless in the least amount of time?
Options
A
B
C
D
Working
The acid diffuses from the outside in, so the cube with the greatest surface area to volume ratio decolourises fastest.
For the smallest cube (2 cm × 2 cm × 2 cm):
Answer
D
D
Background Concept
Diffusion is the passive net movement of molecules from a region of higher concentration to a region of lower concentration. The rate at which a substance can diffuse into a solid object is limited by two factors:
- Surface area – diffusion only occurs across exposed surfaces, so a larger surface area lets more molecules enter per unit time.
- Distance to the centre – molecules must travel from the outside to the inside; the further the centre is, the longer diffusion takes.
The combination of these two factors is captured by the surface area to volume ratio (SA:V). As an object gets larger while staying the same shape, its volume grows faster than its surface area (volume scales with the cube of the linear dimension, surface area only with the square), so SA:V falls sharply with size. Small objects therefore exchange substances with their surroundings far more efficiently than large objects of the same shape.
Understanding the Question
Three agar cubes (coloured pink with a pH indicator) of side 2 cm, 4 cm and 5 cm are immersed in 0.1 mol dm⁻³ HCl at 20 °C. The acid diffuses into each cube and turns the indicator colourless. We are asked which cube becomes colourless first, and specifically for the SA:V ratio of that cube.
The key biological point: diffusion enters from the surface, so the cube whose centre is reached soonest is the one with the largest SA:V — the smallest cube.
Approach
- Identify which cube will decolourise fastest (the smallest, 2 cm cube).
- Calculate its surface area and volume.
- Form the SA:V ratio and match it to the options.
Step-by-Step Reasoning
Which cube decolourises fastest?
The acid must travel from the surface to the centre. For a cube of side :
- Maximum diffusion distance = (from face to centre).
- A 2 cm cube has a centre only 1 cm in; a 5 cm cube has a centre 2.5 cm in. The small cube is reached far sooner.
Equivalently, comparing SA:V values:
- 2 cm cube:
- 4 cm cube:
- 5 cm cube:
The 2 cm cube has by far the highest ratio, so it becomes colourless first.
Calculating SA:V for the 2 cm cube:
A cube has 6 identical square faces, each of area .
This matches option D.
(For comparison, options A and C correspond to the 5 cm and 4 cm cubes respectively, and option B (0.83:1) is not produced by any of the three cubes — it would correspond to a much larger cube. The distractor values are designed to catch students who pick the wrong cube.)
Key Takeaways
- Diffusion into a solid is limited by surface area (entry) and path length to the centre (distance).
- For objects of the same shape, smaller size = larger SA:V ratio = faster exchange with the surroundings.
- This is why cells, organelles and exchange surfaces (villi, alveoli, root hairs) are all small or highly folded — to keep SA:V high and exchange efficient.
- The classic agar-cube / HCl experiment is the standard practical demonstration of this principle.
Common Mistakes
- Picking the largest cube, thinking it has the most surface area. While the 5 cm cube does have more absolute surface area than the 2 cm cube, its volume is much greater still, so the SA:V ratio is smaller and diffusion is slower.
- Forgetting that a cube has 6 faces, not 4 or 5, when calculating surface area.
- Dividing the wrong way round: SA:V means surface area divided by volume, not the other way around.
- Picking option C (1.2:1), which is the SA:V of the 5 cm cube, having misidentified the fastest-decay cube.
Things to Be Careful About
- Always state the SA:V ratio as a number (e.g. 3.0) compared to 1, not as a single number on its own — both numbers matter.
- Keep units consistent: if side is in cm, surface area is in cm² and volume in cm³, and the ratio carries units of cm⁻¹; for comparison purposes we express it as a pure number relative to 1.
- Note the order of the ratio: conventionally SA:V (not V:SA), so 3.0:1 means "3 cm² of surface for every 1 cm³ of volume".
- The temperature (20 °C) and HCl concentration (0.1 mol dm⁻³) are standardised because diffusion rate depends on these — but they affect all three cubes equally, so they do not change which cube decolourises first.
The diagram shows the arrangement of chromosomes with attached spindle fibres during a stage of mitosis.
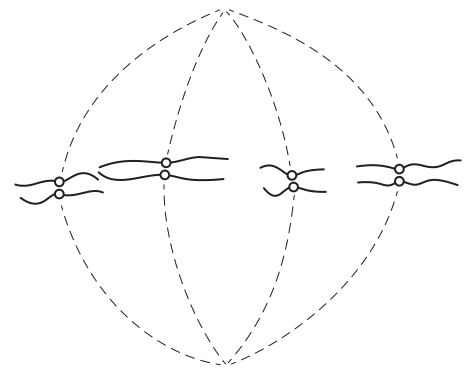
Which row correctly identifies the stage of mitosis and describes what is happening?
Options
| stage of mitosis | description | |
|---|---|---|
| A | anaphase | chromosomes are being pulled towards the centromeres |
| B | metaphase | sister chromatids are replicating prior to separation |
| C | metaphase | chromosomes are being positioned along the equator of the cell |
| D | anaphase | sister chromatids are being pulled towards the poles of the cell |
Working
The diagram shows sister chromatids that have separated at the centromere and are being drawn towards opposite poles of the cell by the shortening spindle fibres. This is the defining feature of anaphase. The chromatids moving towards the centromeres (option A) is incorrect — it is the chromosomes that move towards the poles via their centromeres, not the other way round. Option B is wrong because replication occurs during S phase of interphase, not during metaphase. Option C describes metaphase, but the figure shows separation of sister chromatids, not alignment at the equator.
Answer
D
D
Background Concept
Mitosis is a continuous process traditionally divided into four stages — prophase, metaphase, anaphase and telophase — by which a cell divides to produce two genetically identical daughter nuclei. Before mitosis, during S phase of interphase, each chromosome is replicated so that it consists of two identical sister chromatids held together at a centromere.
Key events of the stages relevant to this question:
- Metaphase: spindle fibres (made of microtubules) attach to the centromeres of the chromosomes and line the chromosomes up along the equator (metaphase plate) of the cell. Each chromosome still consists of two sister chromatids joined at the centromere.
- Anaphase: the centromeres split and the sister chromatids separate. The spindle fibres shorten, pulling each chromatid (now an individual chromosome) towards opposite poles of the cell. This is the only stage at which sister chromatids physically separate.
Understanding the Question
The diagram shows a cell with spindle fibres radiating from two opposite poles, attached to chromosomes in the central region of the cell. We are asked to identify which mitotic stage this represents and to choose the description that correctly matches that stage. The command word is implicit — we need to recognise the stage and select the accurate description.
Approach
Look at two features in the figure: (1) where the chromosomes are positioned, and (2) whether the sister chromatids are still joined or have separated. Match these observations to the definitions of metaphase versus anaphase, and then check which option's description is biologically correct for that stage.
Step-by-Step Reasoning
- Position of the chromosomes: In the diagram, the chromosomes are not neatly lined up along a single equatorial line. Instead, they appear as separated groups moving apart from the centre towards each pole. This movement away from the equator towards the poles is characteristic of anaphase, not metaphase.
- State of the chromatids: The chromatids have separated from one another — there are now individual chromosomes (formerly sister chromatids) heading towards each pole. Separation of sister chromatids occurs only in anaphase.
- Eliminate option A: It calls the stage anaphase (correct) but says chromosomes are being pulled towards the centromeres. This is biologically wrong — chromosomes move away from the equator towards the poles, pulled by spindle fibres attached at the centromere.
- Eliminate option B: Metaphase does not involve DNA replication. Replication of DNA to form sister chromatids occurs during the S phase of interphase, before mitosis begins.
- Eliminate option C: Although the stage is correctly named as metaphase, the diagram does not show chromosomes lined up at the equator with sister chromatids still joined — it shows separation and movement. So the description does not match the figure.
- Confirm option D: The stage is anaphase, and sister chromatids are being pulled towards the poles of the cell by the shortening spindle fibres. This matches both the diagram and the biological definition of anaphase.
Key Takeaways
- Anaphase = sister chromatids separate at the centromere and are pulled to opposite poles.
- Metaphase = chromosomes (each still with two chromatids) line up at the equator.
- Spindle fibres attach to chromosomes at the centromere; movement is of the chromosomes/chromatids towards the poles, not the other way round.
- DNA replication occurs in interphase (S phase), not during any stage of mitosis.
Common Mistakes
- Confusing metaphase and anaphase because both have chromosomes near the middle of the cell — the key is whether the sister chromatids are still joined (metaphase) or separating (anaphase).
- Stating that chromosomes are pulled towards the centromeres — the centromere is part of the chromosome; the whole chromosome moves towards the pole.
- Saying DNA replication happens during mitosis — replication happens in interphase, well before the nuclear division stages begin.
Things to Be Careful About
- Look carefully at the image: even if chromosomes appear near the centre, check whether the chromatids have split and are moving apart — that signals anaphase.
- The spindle fibres in the diagram extend from each pole to the centromeres; the shortening of these fibres (not their attachment alone) is what moves the chromatids.
- When an MCQ gives two correct-sounding answers, scrutinise the description: the stage name and the description must both be accurate.
During which phase of the cell cycle does DNA replication take place?
Options
A
B
C M
D S
Working
The cell cycle is divided into interphase (G₁, S, G₂) and mitosis/cytokinesis (M phase). DNA replication occurs during the S phase, named for synthesis of new DNA, producing two sister chromatids per chromosome.
Answer
D
D
Background Concept
The mitotic cell cycle describes the series of events a eukaryotic cell goes through to divide and produce two genetically identical daughter cells. It is conventionally divided into two major stages:
- Interphase – the longer, preparatory part of the cycle. It is itself subdivided into three phases:
- G₁ (Gap 1) – the cell grows, synthesises proteins and organelles, and carries out its normal metabolic roles.
- S (Synthesis) phase – the cell replicates its entire genome. Each chromosome is copied to form two sister chromatids held together at the centromere by cohesin proteins.
- G₂ (Gap 2) – the cell continues to grow, synthesises proteins required for mitosis (e.g. tubulin for spindle fibres), and checks the replicated DNA for errors before committing to division.
- M phase (Mitosis + Cytokinesis) – the replicated chromosomes are separated and the cell divides. Mitosis itself has four stages (prophase, metaphase, anaphase, telophase) followed by cytokinesis.
The name "S phase" is short for synthesis, referring specifically to the synthesis (replication) of DNA. It is the only phase during which DNA replication occurs, because once a cell enters M phase the chromosomes condense and become inaccessible to the replication machinery.
Understanding the Question
The stem asks which named phase of the cell cycle is the location of DNA replication. The options are the four canonical phases: G₁, G₂, M, and S. The question is a direct recall item, with no figure or scenario to interpret — the candidate simply needs to match DNA replication to the correct named phase.
Approach
Recall that:
- G₁ = growth, no DNA replication.
- S = DNA synthesis (replication).
- G₂ = further growth and preparation, no DNA replication.
- M = mitosis, no DNA replication.
DNA replication is therefore confined to the S phase.
Step-by-Step Reasoning
- DNA replication must occur before mitosis so that each daughter cell receives a complete copy of the genome.
- Within the cell cycle, replication is restricted to interphase; during M phase the DNA is condensed into visible chromosomes and is not replicated.
- The G phases (G₁ and G₂) are "gap" phases devoted to growth, protein synthesis and checkpoint control — they do not include DNA replication.
- The remaining interphase phase, S, is the one specifically dedicated to DNA synthesis, hence option D.
Key Takeaways
- DNA replication occurs during the S phase of interphase.
- The cell cycle order is G₁ → S → G₂ → M.
- G₁ and G₂ are growth/checkpoint phases; S is the synthesis (DNA replication) phase; M is mitosis plus cytokinesis.
- Cells that exit the cycle (e.g. neurons, mature red blood cell precursors) arrest in a state called G₀, not in any of G₁, S, G₂ or M.
Common Mistakes
- Confusing S phase with G₂ — G₂ is after replication, not the phase in which it happens.
- Choosing M phase, perhaps because "M" is the most prominent letter of the cell cycle and the phase most often described in textbooks.
- Believing replication happens in G₁ — G₁ precedes S, and the DNA is still in its unreplicated, single-chromatid state.
Things to Be Careful About
- The cell cycle in plants and animals follows the same broad G₁/S/G₂/M structure; the question is testing the universal eukaryotic model.
- "Synthesis" in S phase refers to DNA synthesis specifically — RNA and protein synthesis occur throughout interphase and beyond.
Human body cells in interphase have 46 chromosomes.
What is correct about the number of telomeres present in prophase of a human body cell?
Options
A 46 as there is one telomere at the end of 46 chromosomes
B 92 as there is one telomere at each end of 46 chromosomes
C 92 as there is one telomere at the end of 92 chromatids
D 184 as there is one telomere at each end of 92 chromatids
Working
- Human body cells enter mitosis with 46 chromosomes.
- By prophase, DNA replication in interphase has occurred, so each chromosome consists of 2 sister chromatids.
- Total chromatids = .
- Each chromatid has 2 ends, and each end has 1 telomere.
- Total telomeres = .
Answer
D
D
Background Concept
A chromosome in a non-dividing (interphase) cell consists of a single DNA molecule. Before mitosis begins, during the S phase of interphase, the DNA is replicated semi-conservatively, producing two identical DNA double helices. Once the DNA has replicated and the chromatin condenses, the structure is referred to as a chromosome consisting of two sister chromatids held together at the centromere.
A telomere is a repetitive, non-coding nucleotide sequence (TTAGGG repeats in humans) found at each end of a linear DNA molecule. Its job is to protect the coding DNA from degradation and to prevent the ends of chromosomes from being recognised as DNA damage. Because each DNA molecule — i.e. each chromatid — has two ends, every chromatid carries exactly two telomeres, one at each end.
Understanding the Question
The question gives the starting chromosome number (46) for a human body (somatic) cell and asks for the number of telomeres present at prophase. The key things to combine are:
- The number of chromatids at prophase (after DNA replication, so double the chromosome number).
- The number of telomeres per chromatid (2).
The distractors try to tempt you into either (a) counting one telomere per chromatid instead of two, (b) counting one telomere per chromosome, or (c) using 46 as if no replication had occurred.
Approach
Use the chain: chromosomes → chromatids (×2) → telomeres (×2 per chromatid). So the multiplier on the original 46 is .
Step-by-Step Reasoning
- Human body cells have 46 chromosomes. ✓ (given)
- By prophase, each chromosome has replicated and consists of 2 sister chromatids. Therefore, total chromatids = .
- Each chromatid is a separate linear DNA molecule with its own two ends, so each chromatid has 2 telomeres.
- Total telomeres = .
- Check the options:
- A (46) — wrong: ignores replication and counts one telomere per chromosome.
- B (92) — wrong: only counts the chromatids, treating each as having one telomere.
- C (92) — wrong: counts chromatids correctly but mistakenly gives only one telomere per chromatid.
- D (184) — correct: 92 chromatids × 2 telomeres each.
Key Takeaways
- A telomere caps each end of a linear DNA molecule; there is one telomere per end, so 2 telomeres per DNA molecule (per chromatid).
- Before mitosis, DNA replication doubles the chromatid number compared with the chromosome number.
- The arithmetic shortcut: telomeres at prophase = (original chromosome number) × 4.
Common Mistakes
- Saying there is one telomere per chromatid. A chromatid, like any linear DNA molecule, has TWO ends, and therefore TWO telomeres.
- Confusing chromosomes and chromatids. Counting telomeres per chromosome (only 2 per chromosome) instead of per chromatid (4 per chromosome once replicated) halves the answer.
- Using the unreplicated chromosome number. Telomere questions in mitosis must use the post-replication chromatid number, not the interphase chromosome number.
Things to Be Careful About
- The wording "at the end of" in options A and C is a deliberate trap — telomeres sit at each end, not at one end.
- This is a prophase question, not a G1 interphase question; replication has already happened.
- The principle is the same in meiosis after S phase, so a similar question could appear in a meiosis context with different chromosome numbers.
Sometimes hydrogen bonds form temporarily between the bases of two strands of RNA.
How many hydrogen bonds form when guanine and uracil each bind to their complementary base?
Options
| guanine | uracil | |
|---|---|---|
| A | 3 | 3 |
| B | 3 | 2 |
| C | 2 | 3 |
| D | 2 | 2 |
Working
In RNA, complementary base pairing follows the same hydrogen-bonding pattern as DNA, except that uracil replaces thymine:
- Guanine (G) pairs with cytosine (C) — 3 hydrogen bonds
- Adenine (A) pairs with uracil (U) — 2 hydrogen bonds
Therefore guanine forms 3 H-bonds and uracil forms 2 H-bonds with their respective complementary bases.
Answer
B
B
Background Concept
DNA and RNA are both nucleic acids whose two strands (or single strand folded back on itself, or two RNA strands base-paired) are held together by hydrogen bonds between complementary bases. The bases fall into two groups based on their chemical structure:
- Purines (double-ring): adenine (A) and guanine (G)
- Pyrimidines (single-ring): cytosine (C), thymine (T, DNA only) and uracil (U, RNA only)
Because of the geometry of their hydrogen-bond donor and acceptor groups, a purine can only hydrogen-bond with a specific pyrimidine. This is the principle of complementary base pairing.
The standard pairing rules and hydrogen-bond counts are:
| Base pair | Number of H-bonds |
|---|---|
| A — T (DNA) | 2 |
| A — U (RNA) | 2 |
| G — C (DNA or RNA) | 3 |
Understanding the Question
The stem specifies that two strands of RNA are temporarily held together by hydrogen bonds between their bases, and asks how many hydrogen bonds form when each of two specific bases — guanine and uracil — binds to its complementary partner.
The command word is implicit: the candidate must identify the correct number from the four option combinations. The tricky element is that the question is framed in an RNA context, but most students memorise the H-bond counts using the DNA pairings (G–C = 3, A–T = 2). The same numbers apply to RNA because the H-bonding donor/acceptor arrangement is identical for A–U and A–T pairs.
Approach
- Identify the complementary base for guanine in RNA — it is cytosine.
- Recall the H-bond count for a G–C pair — 3.
- Identify the complementary base for uracil in RNA — it is adenine.
- Recall the H-bond count for an A–U pair — 2 (the same as A–T in DNA).
- Match the pair (3, 2) to the correct option.
Step-by-Step Reasoning
- Guanine: G is a purine. Its complementary pyrimidine is cytosine. A G–C base pair is stabilised by three hydrogen bonds (the same number whether in DNA or RNA).
- Uracil: U is a pyrimidine. Its complementary purine is adenine. An A–U base pair is stabilised by two hydrogen bonds. The reason A–U behaves like A–T (and not like G–C) is that the relevant H-bond donor/acceptor groups on uracil occupy essentially the same positions as those on thymine.
- So the required values are guanine = 3 and uracil = 2, which matches option B.
Key Takeaways
- The complementary pairing rules in RNA are A–U and G–C, parallel to the A–T and G–C rules in DNA.
- The H-bond counts (2 for A–U/T, 3 for G–C) are a property of the bases' chemistry, not of the molecule as a whole, so they transfer directly between DNA and RNA.
- A useful mnemonic: G-C has 3 (G and C are the "stronger" pair), A-T/U has 2.
Common Mistakes
- Choosing A (3 and 3): assuming every RNA base pair is held by 3 hydrogen bonds.
- Choosing C (2 and 3): swapping the values, often by confusing which base pairs with which.
- Choosing D (2 and 2): applying the A–T count to both bases by mistake.
Things to Be Careful About
- Do not assume the numbers change between DNA and RNA — the H-bond count depends only on the two bases involved.
- Thymine is not present in RNA, so the question's mention of uracil is the cue to use the RNA pairing rule (A–U, not A–T) — but the H-bond count happens to be the same.
- Read the table carefully: the order of the columns is guanine then uracil, so the answer must list the G-value first.
The table shows all the possible DNA triplet codes for some amino acids.
| amino acid | DNA triplet code |
|---|---|
| cysteine | ACA |
| cysteine | ACG |
| tryptophan | ACC |
| isoleucine | TAA |
| isoleucine | TAG |
| isoleucine | TAT |
| methionine | TAC |
The amino acid sequence is shown.
methionine – isoleucine – cysteine – tryptophan
What is the maximum number of different DNA sequences that could produce this amino acid sequence?
Options
A 1
B 4
C 6
D 7
Answer
For each amino acid, count the number of possible DNA triplet codes from the table:
- methionine: 1 (TAC)
- isoleucine: 3 (TAA, TAG, TAT)
- cysteine: 2 (ACA, ACG)
- tryptophan: 1 (ACC)
Maximum number of DNA sequences =
C
C
Background Concept
The genetic code is read as triplets of bases (codons), and each codon specifies one amino acid. The code is degenerate, meaning that most amino acids are coded for by more than one codon. In contrast, some amino acids (such as methionine and tryptophan in this table) have only a single codon, and these are said to be non-degenerate.
Because the code is read as a sequence of independent codons, the number of different DNA sequences that can code for a given short peptide is found by multiplying together the number of possible codons for each amino acid in the chain. (Note: the table presents the codes as DNA triplets; in real biology the table would normally be read as mRNA codons, but the arithmetic is identical — only the base identity changes.)
Understanding the Question
The question lists every DNA triplet that codes for each of four amino acids. It then asks how many different DNA sequences (i.e. different four-codon combinations) could give the short peptide:
methionine – isoleucine – cysteine – tryptophan
The command is "maximum number of different DNA sequences". The candidate must treat every possible codon for each amino acid as a free choice and combine the choices.
Approach
- Read from the table how many codons are available for each amino acid in the sequence.
- Apply the multiplication (fundamental counting) principle: the total number of possible combinations is the product of the per-position choices.
Step-by-Step Reasoning
- methionine — only one DNA triplet in the table: TAC. Choices = 1.
- isoleucine — three DNA triplets: TAA, TAG, TAT. Choices = 3.
- cysteine — two DNA triplets: ACA, ACG. Choices = 2.
- tryptophan — one DNA triplet: ACC. Choices = 1.
Combine by multiplication:
So six different DNA sequences can code for this tetrapeptide. The matching option is C (6).
Key Takeaways
- The genetic code is degenerate; the degree of degeneracy varies between amino acids (1, 2, 3, 4 or 6 codons in real life).
- For a chain of amino acids, the number of possible nucleic-acid sequences is the product of the codon choices at each position (multiplication principle).
- Methionine and tryptophan are examples of amino acids with a single codon each.
Common Mistakes
- Forgetting that several amino acids in the table have multiple codons and only counting one option for each — this gives 1, not 6.
- Adding instead of multiplying (1 + 3 + 2 + 1 = 7, which is the distractor D).
- Treating the triplet as mRNA rather than DNA — the count is the same, but the candidates should not get distracted by T/U wording.
Things to Be Careful About
- Read the table carefully: cysteine has two entries, isoleucine has three, but methionine and tryptophan each have only one.
- The multiplication principle applies because the choice of codon at one position is independent of the choice at every other position.
- Do not be tempted by answer D (7); that value arises only if you accidentally add the numbers instead of multiplying them.
Which row is correct for transpiration?
Options
| definition of transpiration | comparison of water potential | |
|---|---|---|
| A | evaporation of water from leaf surfaces | higher inside air spaces in the leaf than the air outside |
| B | evaporation of water from leaf surfaces | lower inside air spaces in the leaf than the air outside |
| C | loss of water vapour from leaves | lower inside air spaces in the leaf than the air outside |
| D | loss of water vapour from leaves | higher inside air spaces in the leaf than the air outside |
Working
Transpiration is defined as the loss of water vapour from the leaves (mainly through the stomata), not the loss of liquid water. This eliminates options A and B, which incorrectly say "evaporation of water from leaf surfaces."
For the water potential comparison: the air inside the leaf's air spaces is saturated with water vapour (high relative humidity), so its water potential is higher (less negative) than that of the drier external atmosphere. This gradient in water potential drives water vapour out of the leaf down a water potential gradient.
Only option D combines the correct definition with the correct water potential comparison.
Answer
D
D
Background Concept
Transpiration is the loss of water vapour from a plant, principally through small pores called stomata in the leaves. The water evaporates from the moist cell walls of the mesophyll cells into the air spaces within the leaf, and then diffuses out of the stomata into the surrounding atmosphere. The term must specify water vapour — the loss of liquid water from a plant is called guttation and occurs through different structures (hydathodes) under different conditions.
Water potential () describes the tendency of water to move from one place to another. Pure water has , and any solution has a more negative (lower) water potential. Water moves down a water potential gradient, from regions of higher (less negative) water potential to regions of lower (more negative) water potential.
Inside the leaf's air spaces, the air is close to saturation with water vapour, so its water potential is high (close to 0 kPa). Outside the leaf, the atmosphere is usually much drier, so its water potential is more negative. This gradient is what drives water vapour to diffuse out of the leaf.
Understanding the Question
This is a multiple-choice question with a 2 × 2 design. The two columns test two separate ideas:
- Definition of transpiration — does the candidate know that it is loss of water vapour (not liquid water, not just "evaporation")?
- Water potential comparison — does the candidate know which side (inside the leaf's air spaces, or the external air) has the higher water potential?
The command word is implicit: "Which row is correct", meaning only one option correctly matches both criteria.
Approach
The strategy is to eliminate options column by column:
- First, identify the correct definition of transpiration.
- Second, identify the correct direction of the water potential gradient.
- Then select the single option that gets both correct.
Step-by-Step Reasoning
Step 1 — Test the definition column.
The Cambridge definition of transpiration is: the loss of water vapour from the leaves (and stems) of a plant. The word vapour is the key term.
- A: "evaporation of water from leaf surfaces" — incorrect. This describes evaporation of liquid water, and the term "vapour" is missing. This is a frequent trap answer.
- B: same incorrect definition as A — eliminated.
- C: "loss of water vapour from leaves" — correct.
- D: "loss of water vapour from leaves" — correct.
So we are left with C and D.
Step 2 — Test the water potential comparison column.
Inside the leaf, water evaporates from the spongy mesophyll cell walls into the air spaces, so the air in these spaces is humid (often 100% relative humidity). High humidity means a high (less negative) water potential. Outside the leaf, the atmosphere is usually drier, so the water potential is lower (more negative).
Therefore the water potential inside the air spaces is higher than outside. Water vapour diffuses from the higher water potential (inside) to the lower water potential (outside).
- C: "lower inside air spaces in the leaf than the air outside" — incorrect; reverses the gradient.
- D: "higher inside air spaces in the leaf than the air outside" — correct.
Step 3 — Conclusion.
Only option D has both statements correct.
Key Takeaways
- Transpiration is specifically the loss of water vapour, not liquid water.
- The water potential inside a leaf's air spaces is higher than that of the external atmosphere because the air inside is saturated with water vapour.
- This water potential gradient (high inside → low outside) is the driving force for the diffusion of water vapour out through the stomata.
- Be alert to precise wording in definitions — CIE marks often hinge on a single keyword such as "vapour".
Common Mistakes
- Confusing transpiration with evaporation of liquid water. Students often write "evaporation of water from the leaves" — this is wrong because it omits "vapour" and is also imprecise about the location (transpiration is mainly through stomata, not the whole leaf surface).
- Reversing the water potential gradient. A common error is to assume the inside of the leaf is "wetter" and therefore has a lower water potential. In fact, water potential is highest where water is most free to move; saturated air has a higher water potential than dry air, so the inside of the leaf is higher than outside.
- Confusing water potential with water content or humidity. All three are linked but are not the same. The water potential gradient is the actual physical driving force for the diffusion of water vapour.
Things to Be Careful About
- The word vapour is non-negotiable in the definition — marks are routinely lost by omitting it.
- Water potential is measured in kPa and is usually negative (or zero for pure water). "Higher water potential" means closer to zero (less negative), not a larger absolute value.
- Transpiration occurs mainly through stomata in the leaves; a small amount also occurs through the cuticle (cuticular transpiration) and through lenticels in stems, but the bulk is stomatal.
- The driving force is a water potential (or, equivalently, a water vapour concentration / partial pressure) gradient between the humid air inside the leaf and the drier air outside — not suction from above (that is the cohesion-tension theory, which explains how the transpiration pull is transmitted downwards through the xylem).
Which features of companion cells and xylem vessel elements make them suitable for their function?
Options
| companion cells | xylem vessel elements | |
|---|---|---|
| A | transport contents of cell in one direction only | lignified walls provide support |
| B | cellulose walls provide support | nuclei allow cell division |
| C | nuclei allow cell division | gaps between cells allow rapid transport |
| D | numerous mitochondria supply energy | absence of cytoplasm allows mass flow |
Working
Companion cells carry out active loading of sucrose into sieve tube elements, a process requiring large amounts of ATP. They therefore contain numerous mitochondria to supply this energy.
Xylem vessel elements are dead at maturity; they have no cytoplasm, so the lumen is open and water can pass through as a mass flow with no obstruction.
Answer
D
D
Background Concept
Plants move substances over long distances in two specialised vascular tissues:
-
Xylem transports water and mineral ions from roots to leaves. Xylem vessel elements are long, hollow, tube-like cells formed end-to-end. They are dead at functional maturity — they have lost their cytoplasm and end walls have dissolved away, leaving a continuous, empty lumen. Their walls are thickened with lignin, which waterproofs them and gives mechanical support. This combination of an empty, continuous tube with strong walls is ideal for the mass flow of water driven by transpiration pull.
-
Phloem translocates assimilates (mainly sucrose) from sources (e.g. mature leaves) to sinks (e.g. roots, growing shoots, fruits, storage organs). The conducting cells are sieve tube elements, which are living but have lost their nuclei and most organelles. Each sieve tube element is closely associated with one or more companion cells that retain a nucleus and dense cytoplasm, including numerous mitochondria. Because the companion cell and its sieve tube element develop from the same mother cell, they remain connected by plasmodesmata.
The companion cell performs the metabolic work for the sieve tube element. Loading sucrose into the sieve tube is largely an active process driven by a proton-sucrose co-transporter, so the cell needs abundant ATP — hence the many mitochondria.
Understanding the Question
This is a multiple-choice question with two columns. The candidate must select the row in which both the description of the companion cell and the description of the xylem vessel element correctly link a structural feature to its function. The distractors typically mix correct-sounding but inaccurate statements (e.g. claims about cellulose walls, nuclei, or one-way transport) with the row's other entry.
Approach
Recall the diagnostic features of each cell type:
| Cell type | Key features supporting function |
|---|---|
| Companion cell | Many mitochondria (for ATP to load sucrose actively); nucleus present; dense cytoplasm |
| Xylem vessel element | Dead at maturity; no cytoplasm (open lumen); lignified walls; end walls perforated |
Then evaluate each row, checking that the companion cell statement AND the xylem statement are both true.
Step-by-Step Reasoning
Row A — "transport contents of cell in one direction only" for the companion cell. Companion cells do not transport material in one direction only; phloem translocation is reversible depending on where the sources and sinks are. Wrong.
Row B — "cellulose walls provide support" for the companion cell. The cell wall of a companion cell is cellulose-based like any plant cell wall, but this is not the feature that suits it for its function. "Nuclei allow cell division" for the xylem vessel element is incorrect because mature xylem vessel elements are dead and have no nucleus at all. Wrong on both counts.
Row C — "nuclei allow cell division" for the companion cell. Companion cells do have nuclei, but the function of the nucleus is not to enable cell division in the mature tissue. "Gaps between cells allow rapid transport" for xylem vessel elements is a poor description; xylem vessels form a continuous tube by dissolution of the end walls, not by leaving gaps. Wrong on both counts.
Row D — "numerous mitochondria supply energy" for the companion cell: correct — companion cells have many mitochondria to produce ATP for the active loading of sucrose into the sieve tube. "Absence of cytoplasm allows mass flow" for the xylem vessel element: correct — mature xylem vessel elements are dead with no cytoplasm, leaving an empty lumen through which water moves freely as a mass flow. Both correct → D.
Key Takeaways
- Companion cells are metabolically active, with many mitochondria, to power active loading of sucrose into the sieve tube (the companion cell–sieve tube element complex is sometimes called the "transfer cell" unit).
- Xylem vessel elements are dead, hollow tubes — the absence of cytoplasm and the perforation of end walls together produce a low-resistance pathway for mass flow of water driven by the transpiration stream.
- Many MCQ distractors recycle vocabulary from the topic (e.g. "lignin", "cellulose", "nuclei") but misassign the structure–function link; always check the specific claim against the specific cell type.
Common Mistakes
- Assuming companion cells transport only one way: phloem flow is bidirectional depending on source/sink locations.
- Forgetting that xylem vessel elements are dead: any answer that credits a xylem vessel with metabolic activity (a nucleus, mitochondria, "active" transport) is wrong.
- Confusing end-wall perforation (xylem, forming a continuous vessel) with gaps between cells — the latter would be a leak, not a feature.
Things to Be Careful About
- "Lignified walls provide support" is a true statement about xylem but does not appear in option D; do not be distracted into thinking a true-but-irrelevant statement makes a row correct.
- The question asks for features that make the cells suitable for their function — focus on the link between structure and role, not on incidental biology.
The diagram shows some root cells.
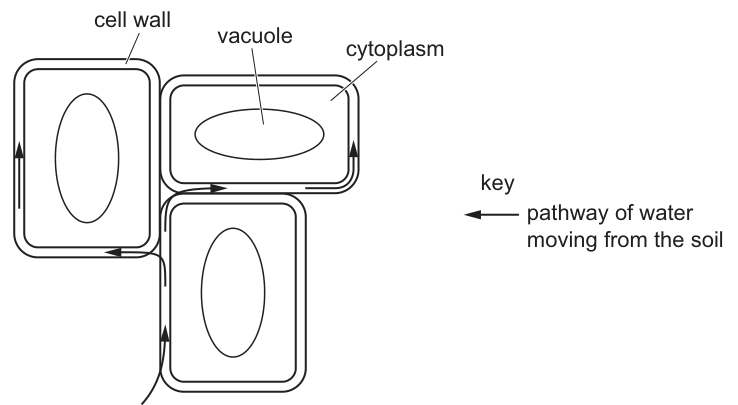
Which statement is correct for the pathway shown by the arrows?
Options
A Water will be blocked by a band of suberin.
B Water will move through the Casparian strip.
C Water will pass easily through the root endodermis.
D Water will pass through plasmodesmata.
Working
The arrows in Fig. 28.1 show water moving from the soil through the cell walls of the first two cells (the apoplast pathway) and then being diverted into the cytoplasm of the third cell. This point, where apoplastic water is forced to cross the plasma membrane and enter the symplast, corresponds to the endodermis. The endodermal cell walls are impregnated with a band of suberin (the Casparian strip), which is waterproof and blocks the apoplastic pathway.
Answer
A
A
Background Concept
Water enters a plant root from the soil and travels to the xylem via two main routes:
- Apoplast pathway – water moves through the continuous network of cell walls and intercellular spaces, never crossing any plasma membrane.
- Symplast pathway – water moves from cytoplasm to cytoplasm via plasmodesmata (cytoplasmic connections between adjacent cells), having crossed a plasma membrane at some point.
- Vacuolar pathway – water moves through the vacuoles, crossing both the plasma membrane and the tonoplast.
The endodermis is a single layer of cells surrounding the vascular tissue (stele) of the root. The radial and transverse walls of endodermal cells are impregnated with suberin, forming the Casparian strip. Suberin is a waxy, hydrophobic substance that is impermeable to water and dissolved solutes. The Casparian strip therefore acts as an apoplastic barrier: water moving through cell walls cannot continue past the endodermis via the apoplast, and is forced to cross the endodermal plasma membrane into the symplast.
This barrier is biologically important because it gives the plant control over which solutes enter the xylem — only those that can cross a membrane (by transport proteins) can reach the vascular tissue.
Understanding the Question
The diagram (Fig. 28.1) shows three adjacent root cells with arrows tracing the path of water from the soil. The arrows go along the cell walls of the first two cells, then turn and enter the cytoplasm of the third cell. The command is to identify which statement correctly describes this pathway.
Approach
Recognise that the change of direction — from travelling through cell walls to entering the cytoplasm — is the visual signature of water being forced to leave the apoplast at the endodermis. The reason water is forced to do this is the Casparian strip (a band of suberin). The correct answer must therefore describe the suberin barrier that is causing this diversion.
Step-by-Step Reasoning
- Interpret the diagram. Water moves from the soil, along the cell walls (apoplast) of the outer two cells, then is shown crossing the plasma membrane into the cytoplasm of the next cell. This is the moment water encounters the endodermis.
- Apply knowledge of the endodermis. The endodermis has a Casparian strip — a band of suberin in the radial walls — which is impermeable to water.
- Evaluate the options:
- A — Water will be blocked by a band of suberin. This correctly describes the Casparian strip blocking apoplastic water flow, forcing it into the symplast (as shown in the diagram). ✔
- B — Water will move through the Casparian strip. Incorrect: the Casparian strip blocks water, it does not conduct it.
- C — Water will pass easily through the root endodermis. Incorrect: water can only cross the endodermis by entering the symplast (crossing a membrane), which the diagram explicitly shows is not "easy" — the pathway has just been diverted from the cell wall into the cytoplasm.
- D — Water will pass through plasmodesmata. Incorrect in this context: the arrows show water crossing the plasma membrane from outside the cell (apoplast) into the cytoplasm, not moving cytoplasm-to-cytoplasm through plasmodesmata.
- Conclusion. The correct answer is A.
Key Takeaways
- The apoplast (cell walls) is a continuous pathway for water until it reaches the endodermis.
- The Casparian strip, made of suberin, is waterproof and blocks the apoplastic pathway.
- Past the endodermis, water must travel via the symplast (cytoplasm/plasmodesmata).
- A diagram showing water leaving the cell wall and entering the cytoplasm is depicting the apoplast-to-symplast switch at the endodermis.
Common Mistakes
- Choosing B because it mentions the Casparian strip — but the strip is a block, not a channel.
- Choosing C because "water does pass through the endodermis" — true, but the statement ignores that the route is constrained; the diagram specifically illustrates the constraining event.
- Choosing D by confusing the symplast pathway (plasmodesmata between cells) with the symplast entry point (crossing the plasma membrane at the endodermis). The arrow in the figure crosses a membrane, not a plasmodesma.
Things to Be Careful About
- Suberin is the substance; the Casparian strip is the structure formed by suberin in the endodermal radial walls. Examiners may accept either term, but "suberin" is the material answer here.
- Read the arrows carefully: the change of direction (from cell wall into cytoplasm) is the diagnostic feature of the endodermis in any such diagram.
- Plasmodesmata connect the cytoplasm of adjacent cells; in this diagram water is entering a cell from its apoplast, not from a neighbouring cell's cytoplasm.
The graph shows the diameter of a tree trunk at different times.
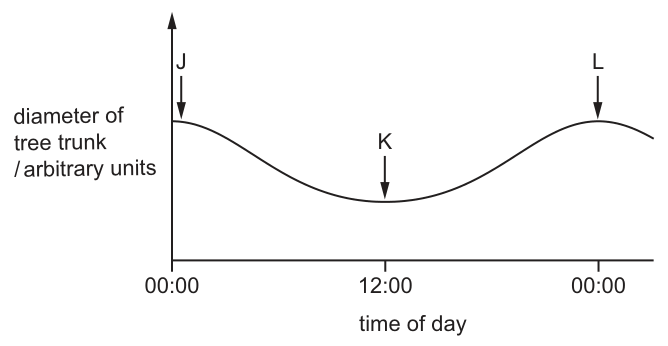
Which statement is correct?
Options
A J shows the expansion of the trunk as water fills the xylem during transpiration.
B K shows a reduction in diameter of the trunk as water is lost from the phloem due to translocation.
C K shows a reduction in diameter of the trunk due to water held in tension in the xylem.
D L shows the expansion of the trunk as the phloem tissue acts as a sink at night.
Working
The graph shows trunk diameter is largest at 00:00 (J and L) and smallest at 12:00 (K). During the day, high rates of transpiration pull water up through the xylem under tension (the cohesion-tension theory). This tension places the water column under negative pressure, which causes the elastic walls of the xylem and surrounding tissues to be pulled inward slightly, shrinking the trunk. At night, transpiration is very low, the tension is released, and the trunk expands again.
Evaluating the options:
- A: J is at 00:00, when transpiration is minimal, not maximal; and the trunk is large because water is NOT under tension. Incorrect.
- B: The diurnal shrinkage is not due to water loss from the phloem. Phloem transport (translocation) is not the cause. Incorrect.
- C: K is at 12:00, when transpiration is high and xylem water is under tension, pulling the trunk diameter to its minimum. Correct.
- D: At night, photosynthates stored in leaves are loaded into the phloem, so the phloem acts as a source, not a sink. Trunk expansion at night is due to release of xylem tension, not phloem behaviour. Incorrect.
Answer
C
C
Background Concept
Water moves up a plant from roots to leaves through the xylem in a continuous column. The driving force is transpiration pull, described by the cohesion-tension theory: water evaporating from the mesophyll cell walls in the leaf creates a negative pressure (tension) at the top of the column. Because water molecules cohere to one another (via hydrogen bonds) and adhere to the walls of the narrow xylem vessels, this tension is transmitted all the way down to the roots, pulling water upward. While under tension, the xylem water column exerts an inward pull on the vessel walls, which are slightly elastic. The net effect is that, during the day when transpiration is highest, the xylem and the surrounding tissues of the trunk are pulled inward very slightly, reducing the trunk's diameter. At night, when stomata close and transpiration almost stops, the tension is released and the trunk returns to its wider, relaxed diameter. This is a real and measurable phenomenon recorded by dendrometers.
The phloem, by contrast, translocates assimilates (mainly sucrose) from sources to sinks using mass flow driven by a pressure gradient produced by proton pumps and active loading at the source. Phloem function does not drive the diurnal change in trunk diameter.
Understanding the Question
The graph shows trunk diameter over 24 hours. Point J is at 00:00 (midnight) with a high diameter, point K is at 12:00 (midday) with a low diameter, and point L is at the next 00:00 (midnight) again with a high diameter. The question asks which statement about the biology behind the J, K and L points is correct. The command word is implicit (identify the correct statement), and we need to choose between explanations that invoke xylem, phloem, sources and sinks.
Approach
The cleanest way to choose the right option is to match each graph feature to the biology:
- Minimum at 12:00 (K) — when transpiration is highest, so xylem water is most under tension.
- Maximum at 00:00 (J and L) — when transpiration is minimal, so xylem water is not under tension.
- Phloem behaviour (sources and sinks) is irrelevant to the trunk diameter change at this scale.
Step-by-Step Reasoning
- Option A says J (00:00) shows expansion because water is filling the xylem during transpiration. At 00:00 transpiration is very low because stomata are closed in darkness, and the trunk is widest precisely because the xylem water is NOT being pulled through under tension. The reasoning is reversed. Reject.
- Option B says K (12:00) shows shrinkage because water is lost from the phloem by translocation. Phloem does not lose water on this timescale; phloem sieve tubes are under positive (turgor) pressure for mass flow, not tension. The trunk shrinkage is due to xylem tension, not phloem water loss. Reject.
- Option C says K (12:00) shows shrinkage due to water held in tension in the xylem. This is exactly the cohesion-tension explanation: high midday transpiration puts the xylem water column under negative pressure, which slightly contracts the elastic xylem vessels and reduces the trunk diameter. Accept.
- Option D says L (00:00) shows expansion because the phloem acts as a sink at night. At night, leaves have no photosynthesis, so they cannot be sources; sucrose is instead loaded from stored starch in the leaves, so the leaves (and the trunk's storage parenchyma) are the source and the growing roots/tissues are the sinks. In any case, the trunk expansion at night is due to release of xylem tension, not phloem sink behaviour. Reject.
Key Takeaways
- The cohesion-tension theory states that transpiration pulls xylem water up under negative pressure.
- Xylem water under tension pulls the vessel walls inward, very slightly shrinking the trunk during the day.
- The trunk is widest at night when transpiration is minimal and the xylem water is not under tension.
- Phloem translocation operates by turgor-driven mass flow between sources and sinks; it does not cause the diurnal trunk diameter change.
Common Mistakes
- Confusing the direction of the trunk change: students may think the trunk must expand during the day because water is moving upward faster. In fact, it is the tension itself that pulls the trunk inward.
- Attributing the change to phloem. The phloem is under positive pressure for mass flow, and the volumes of sugar transported in 12 hours are far too small to account for the trunk diameter change.
- Confusing sources and sinks: in the day the leaves are a source; at night the leaves still act as a source for the phloem (using stored starch), while roots and growing tissues are sinks.
Things to Be Careful About
- "Water under tension" is the precise term; the column is under negative pressure, not being squeezed by positive pressure.
- The trunk diameter change is very small (fractions of a millimetre in a real tree) but is detectable with a sensitive dendrometer.
- Phloem and xylem are not interchangeable; do not swap their roles when interpreting a graph like this.
The plan diagrams of transverse sections of two plant organs are shown. These are not drawn to scale.
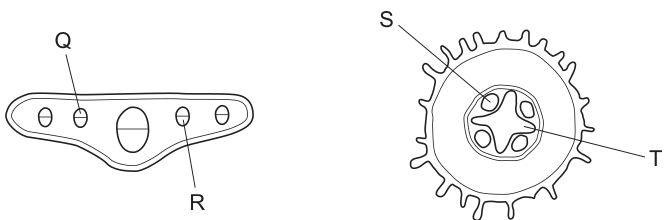
Which tissues contain proton pumps?
Options
A Q and S
B Q and T
C R and S
D R and T
Working
Proton pumps (H-ATPases) are located in the plasma membranes of living plant cells that perform active transport. Within vascular tissues:
- Xylem parenchyma cells (the living cells surrounding dead xylem vessels) use proton pumps to actively load mineral ions into the xylem vessels for transport in the transpiration stream.
- Companion cells of the phloem use proton pumps to actively load sucrose into the sieve tubes (the basis of the mass-flow hypothesis).
From the plan diagrams:
- Q = phloem of the leaf (small circle within the vascular bundle)
- R = xylem of the leaf (large circle within the vascular bundle)
- S = phloem of the root (strand between the arms of the central xylem)
- T = xylem of the root (central star-shaped tissue)
R (leaf xylem) contains xylem parenchyma cells with proton pumps. S (root phloem) contains companion cells with proton pumps. The combination matching both is R and S.
Answer
C
C
Background Concept
Proton pumps are plasma-membrane proteins (H-ATPases) that hydrolyse ATP to pump hydrogen ions (H) out of the cell against their concentration gradient. The resulting electrochemical gradient is then used to drive the secondary active transport of other solutes (such as sucrose or mineral ions) into the cell via co-transporters (symporters) or antiporters.
In plant vascular tissues, two locations are particularly important:
- Companion cells of the phloem. These small, densely cytoplasmic cells are metabolically very active and contain abundant mitochondria. Their plasma-membrane proton pumps export H, and a sucrose–H symporter then brings sucrose into the companion cell, from which it passes into the adjacent sieve tube via plasmodesmata. This is the active-loading step that initiates the mass flow of assimilates from source to sink.
- Xylem parenchyma cells. These living cells surround the dead, water-conducting xylem vessels. Their proton pumps energise the active loading of mineral ions (cations in particular) from the surrounding tissue into the xylem vessels, contributing to the ion composition of the xylem sap and to the root pressure that can supplement the transpiration-driven ascent of water.
The dead xylem vessels themselves and the highly reduced sieve tubes lack significant numbers of proton pumps; the pumping activity is concentrated in the living, metabolically active cells associated with each tissue.
Understanding the Question
The question shows two plan diagrams of plant organ transverse sections and asks which of the four labelled tissues (Q, R, S, T) contain proton pumps. The four options pair a leaf tissue with a root tissue:
- Q = phloem of the leaf
- R = xylem of the leaf
- S = phloem of the root
- T = xylem of the root
The command word is "which", so the candidate must select the combination that includes only tissues whose living cells carry proton pumps. The correct answer is C (R and S).
Approach
Identify each label from the diagrams, then decide for each tissue whether the living cells in that tissue (xylem parenchyma or companion cells) possess proton pumps. The conducting cells themselves (vessels, sieve tubes) are not the site of pumping — the loading is done by the surrounding living cells.
Step-by-Step Reasoning
-
Identify the tissues from the diagrams.
- The left diagram is a leaf transverse section. In leaf vascular bundles, the xylem is on the adaxial (upper) side and consists of the largest vessel elements, while the phloem is on the abaxial (lower) side with smaller sieve tubes. Q (smaller circle) is therefore phloem; R (larger circle) is xylem.
- The right diagram is a root transverse section, identified by the root hairs on the epidermis. The vascular cylinder in the centre has a star-shaped xylem with phloem strands lying between its arms. S points to a phloem position; T points to the central xylem.
-
Recall where proton pumps are found.
- In xylem tissue: proton pumps reside in xylem parenchyma cells (not the dead vessels). These are present in both leaf and root xylem.
- In phloem tissue: proton pumps reside in companion cells (not the sieve tubes). These are present in both leaf and root phloem.
-
Match the answer to the tissues asked about.
- R (leaf xylem) — contains xylem parenchyma with proton pumps. ✓
- S (root phloem) — contains companion cells with proton pumps. ✓
- Q (leaf phloem) — also contains companion cells with proton pumps, but the answer must match the labelled pair.
- T (root xylem) — also contains xylem parenchyma with proton pumps, but again the labelled pair must be selected.
-
Select the option containing R and S. That is option C.
Key Takeaways
- Proton pumps are H-ATPases embedded in plasma membranes; they use ATP to pump H out of the cell, creating an electrochemical gradient that drives secondary active transport.
- In the phloem, the active loading step (essential to the mass-flow hypothesis) takes place in the companion cells via a proton-pump / sucrose–H symporter mechanism.
- In the xylem, proton pumps in xylem parenchyma cells contribute to active loading of mineral ions into the vessels.
- Mature xylem vessels are dead and lack membranes; mature sieve tubes have reduced cytoplasm. The pumping work is done by the living cells that support each conducting tissue.
- Plan diagrams identify tissues by their position and appearance, not by individual cells; recognition of xylem (large empty vessels, central in roots, adaxial in leaves) and phloem (smaller, between xylem arms in roots, abaxial in leaves) is essential.
Common Mistakes
- Confusing xylem and phloem from the diagrams. In a leaf vascular bundle, xylem is the larger adaxial tissue; in a root, xylem is the central star. Mistaking these will lead to the wrong letter being selected.
- Assuming the conducting cells themselves (vessels, sieve tubes) carry the proton pumps. Vessels are dead and have no membranes or pumps; sieve tubes have very reduced cytoplasm. The work is done by companion cells (phloem) and xylem parenchyma (xylem).
- Thinking proton pumps are only in the phloem. Although the mass-flow context is the most familiar CIE example, proton pumps are also present in xylem parenchyma for ion loading. Both tissues contain proton pumps.
- Believing all four options are correct because both xylem and phloem have proton pumps. The question requires choosing the specific labelled pair that matches the given diagrams; the answer is determined by which letters label which tissues.
Things to Be Careful About
- Read the diagram labels carefully: Q and R are in the leaf, S and T are in the root. Pairings that mix organs are still possible (and correct, in this case, the answer pairs a leaf tissue with a root tissue).
- Within a vascular bundle, xylem vessels are larger than phloem sieve tubes, which helps distinguish them on a plan diagram where individual cells are not drawn.
- The proton-pump mechanism described for the mass-flow hypothesis is specifically the phloem one; remember that a separate, less commonly discussed proton-pump activity occurs in xylem parenchyma for ion loading.
The diagrams show three types of blood cells, which are all drawn to the same scale.
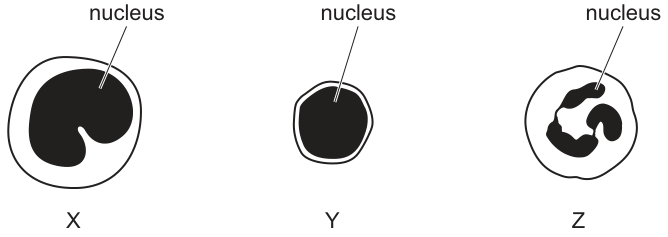
Which row shows the characteristics of the cells?
Options
| name of blood cell X | engulfs pathogens by endocytosis | each responds to one antigen | |
|---|---|---|---|
| A | monocyte | Y | Z |
| B | monocyte | Z | Y |
| C | lymphocyte | Y | Z |
| D | lymphocyte | Z | Y |
Working
- X has a large kidney-shaped nucleus that occupies much of the cell → monocyte.
- Y has a large round nucleus filling most of the cell (little cytoplasm) → lymphocyte.
- Z has a multi-lobed nucleus → neutrophil.
- Neutrophils (Z) are phagocytes that engulf pathogens by endocytosis.
- Lymphocytes (Y) each respond to one specific antigen (clonal specificity of B- and T-cells).
Answer
B
B
Background Concept
Blood contains several types of white blood cell (leucocyte), each recognisable by its nuclear shape and each with a distinct role in defence. The three most commonly examined are:
- Monocyte — the largest leucocyte; has a large, characteristic kidney- (or horseshoe-) shaped nucleus and abundant cytoplasm. In the tissues it differentiates into a macrophage.
- Lymphocyte — a small cell with a large, round nucleus that almost fills the cell, leaving only a thin rim of cytoplasm. There are B-lymphocytes (antibody production) and T-lymphocytes (cell-mediated immunity), each bearing receptors for one specific antigen.
- Neutrophil — a polymorphonuclear leucocyte with a nucleus divided into several connected lobes (2–5 lobes). It is the most abundant phagocyte in the blood and is the first responder to bacterial infection.
Two key functions to distinguish here:
- Phagocytosis (a form of endocytosis) — engulfment and digestion of pathogens or debris. Performed by phagocytes: neutrophils and monocytes/macrophages.
- Antigen-specific response — each lymphocyte clone carries receptors for a single antigen; on first exposure, only the matching clone proliferates (primary response) and the body retains memory cells for a faster secondary response.
Understanding the Question
We are shown three blood cells (X, Y, Z) drawn to the same scale and must match them to two functional statements: which one engulfs pathogens by endocytosis, and which one responds to one specific antigen. We are also told the name of cell X. The first step is to identify each cell from its appearance, then to attribute the functions.
Approach
- Identify each cell purely from nuclear morphology (the only observable feature in the diagram).
- Link the cell to its function: phagocytes engulf pathogens; lymphocytes are antigen-specific.
- Pick the row that gives the correct name for X and the correct cells for the two function columns.
Step-by-Step Reasoning
- Identifying X: the largest cell with a kidney-shaped (indented) nucleus is a monocyte. This rules out options C and D, which name X as a lymphocyte.
- Identifying Y: a small cell whose round nucleus occupies almost the whole cell, with only a thin rim of cytoplasm, is a lymphocyte. Lymphocytes are the cells of specific immunity; each clone responds to one specific antigen. So the "responds to one antigen" column must be Y.
- Identifying Z: the cell with a multi-lobed nucleus is a neutrophil. Neutrophils are phagocytes that engulf pathogens by endocytosis (phagocytosis). So the "engulfs pathogens by endocytosis" column must be Z.
- The row that combines all three is X = monocyte, engulfing cell = Z, antigen-specific cell = Y → option B.
Key Takeaways
- Nuclear shape is the key diagnostic feature for identifying blood cells on micrographs/diagrams:
- kidney/horseshoe → monocyte
- round, fills the cell → lymphocyte
- multi-lobed → neutrophil
- Phagocytosis (engulfment by endocytosis) is the role of neutrophils and monocytes/macrophages, not lymphocytes.
- Specificity for a single antigen is a defining property of lymphocytes (B- and T-cells), not of phagocytes.
- A useful exam mnemonic: "Neutrophil = Neuclear lobes = phagocyte"; "Lymphocyte = large round nucleus = specific antigen response".
Common Mistakes
- Confusing monocytes with neutrophils because both can phagocytose — but in this diagram the monocyte is X (kidney-shaped nucleus), not the cell with the lobed nucleus.
- Assuming that because lymphocytes "respond to antigens", they engulf them — they do not; phagocytes engulf, lymphocytes recognise specifically.
- Naming X as a lymphocyte on the basis of size alone — size without nuclear shape is misleading; a monocyte is the largest leucocyte, but its defining feature is the kidney-shaped nucleus.
Things to Be Careful About
- The question is a triple-match (name + two functions). A correct first identification (X = monocyte) only eliminates half the options; you must still check both function columns.
- "Endocytosis" here means phagocytosis in particular; the mark scheme treats engulfment of a whole pathogen as a form of endocytosis.
- Do not read the table carelessly — the cells in the function columns refer to Y and Z, not to X again.
The graph shows oxygen dissociation curves for three animals. The shape of each curve is influenced by respiration rate and the affinity of haemoglobin for oxygen.
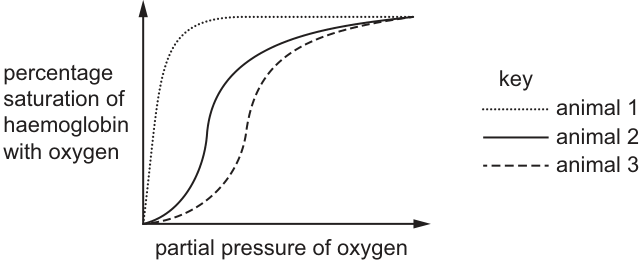
What can be concluded from the graph?
Options
A Animal 1 has haemoglobin adapted to have a higher affinity for oxygen than animal 2.
B Animal 3 has haemoglobin adapted to have a higher affinity for oxygen than animal 2.
C Animal 3 has haemoglobin adapted to maintain a lower respiration rate than animal 2.
D Animal 1 has haemoglobin adapted to maintain a higher respiration rate than animal 2.
Working
The oxygen dissociation curve is shifted to the left when haemoglobin has a higher affinity for oxygen (it becomes more saturated at a given partial pressure of O₂), and to the right when affinity is lower.
From Fig. 32.1:
- Animal 1's curve is to the left of animal 2's → animal 1 has a higher affinity for O₂ than animal 2.
- Animal 3's curve is to the right of animal 2's → animal 3 has a lower affinity for O₂ than animal 2.
- The graph shows percentage saturation vs partial pressure of O₂; the position of the curve indicates affinity, not respiration rate. Respiration rate cannot be read from the curve's position.
Evaluating the options:
- A ✓ — animal 1's curve is left of animal 2's, so higher affinity.
- B ✗ — animal 3 is to the right, so lower affinity, not higher.
- C ✗ — curve position does not indicate respiration rate.
- D ✗ — curve position does not indicate respiration rate.
Answer
A
A
Background Concept
Haemoglobin is the oxygen-carrying pigment in red blood cells. Its ability to bind and release oxygen is described by the oxygen dissociation curve, which plots the percentage saturation of haemoglobin with oxygen against the partial pressure of oxygen (pO₂).
The curve is sigmoid (S-shaped) because haemoglobin is a tetramer with four subunits. Binding of O₂ to the first subunit increases the affinity of the remaining subunits (cooperative binding), producing the steep middle portion of the curve.
The position of the curve carries key information:
- A curve shifted to the left means haemoglobin becomes saturated at a lower pO₂ — i.e. it has a higher affinity for oxygen. Such haemoglobin loads O₂ readily but unloads it less easily. Examples include fetal haemoglobin (HbF) and the haemoglobin of animals living at high altitude.
- A curve shifted to the right means haemoglobin needs a higher pO₂ to become saturated — i.e. it has a lower affinity. It loads O₂ less readily but unloads it more easily where it is needed. The Bohr shift (effect of increased CO₂ / lower pH) and increased temperature both shift the curve to the right, which is exactly what active respiring tissues need.
A common confusion: the curve position tells you about affinity, not directly about respiration rate. Although the stem says the shape is influenced by respiration rate, you cannot read a value for respiration rate off the graph.
Understanding the Question
We are given three sigmoid dissociation curves on the same axes (percentage saturation on the y-axis, partial pressure of O₂ on the x-axis). Animal 1 is the leftmost (dotted), animal 2 is in the middle (solid), and animal 3 is the rightmost (dashed). We are asked what can be concluded from the graph, with four options about affinity and respiration rate.
The command word is essentially "conclude" — only statements directly supported by the graph should be selected.
Approach
For each option, check whether the claim follows directly from the curve's position:
- Identify which curve lies to the left/right of which.
- Translate position into affinity (left = higher, right = lower).
- Reject any option that claims something the graph does not show (e.g. respiration rate).
Step-by-Step Reasoning
Step 1 — Read the positions.
From Fig. 32.1, at any chosen pO₂, animal 1 has the highest % saturation, animal 2 is intermediate, and animal 3 has the lowest. Equivalently, animal 1 reaches a given % saturation at the lowest pO₂, and animal 3 needs the highest pO₂.
Step 2 — Convert position to affinity.
- Animal 1 (leftmost) → highest affinity for O₂.
- Animal 2 (middle) → intermediate affinity.
- Animal 3 (rightmost) → lowest affinity for O₂.
Step 3 — Test option A.
"Animal 1 has haemoglobin adapted to have a higher affinity for oxygen than animal 2." Animal 1's curve is to the left of animal 2's, so animal 1's Hb has the higher affinity. Supported by the graph → A is correct.
Step 4 — Test option B.
"Animal 3 has haemoglobin adapted to have a higher affinity for oxygen than animal 2." Animal 3 is to the right of animal 2, so it has lower, not higher, affinity. Contradicted by the graph → B is wrong.
Step 5 — Test options C and D.
Both make claims about "respiration rate". The graph only displays percentage saturation versus pO₂; nothing on the axes or in the curves tells us the absolute respiration rate of any animal. Although the stem mentions that respiration rate influences the shape of the curve, the curve's position is not a measure of respiration rate. Neither C nor D can be concluded from the graph.
Key Takeaways
- Left-shifted curve = higher O₂ affinity; right-shifted curve = lower affinity.
- The dissociation curve tells you about binding/unloading behaviour, not about absolute respiration rate.
- A "conclusion" question only allows statements directly supported by the figure — be wary of options that import concepts (like respiration rate) that the graph does not actually plot.
Common Mistakes
- Reading position backwards: thinking that a right-shifted curve means higher affinity because it "holds onto" O₂ better. The opposite is true — right-shifted Hb releases O₂ more readily but picks it up less easily.
- Confusing affinity with respiration rate: the stem mentions respiration rate, but the graph shows affinity. A curve being more or less saturated at a given pO₂ is about binding, not metabolic rate.
- Comparing the wrong pair: option B compares animal 3 with animal 2, but animal 3 is to the right of animal 2, so it has lower affinity — easy to misread.
Things to Be Careful About
- Always justify the conclusion in terms of curve position relative to another curve — never assert affinity without saying which curve is left/right of which.
- Distinguish between what influences the curve (temperature, pCO₂, pH, 2,3-BPG, respiration rate) and what the curve shows (affinity for O₂).
- A curve being steep in the middle is a separate property from its lateral position; both contribute to the curve's behaviour but only position tells you about relative affinity.
Which statements about a mammalian heart are correct?
1 The right atrium and right ventricle contain deoxygenated blood going to the lungs.
2 The left atrium and left ventricle contain oxygenated blood going to the pulmonary circulation.
3 The left ventricle has a thicker wall than the right ventricle and delivers blood at higher pressure.
4 The pressure of blood in the aorta is less than that in the pulmonary artery.
Options
A 1, 3 and 4
B 1 and 3 only
C 2, 3 and 4
D 2 and 4 only
Working
Statement 1 — The right atrium receives deoxygenated blood from the body via the venae cavae, and the right ventricle pumps it to the lungs through the pulmonary artery. Correct.
Statement 2 — The left atrium and left ventricle contain oxygenated blood, but they supply the systemic circulation (via the aorta), not the pulmonary circulation. Incorrect.
Statement 3 — The left ventricle pumps blood around the whole body, so its wall is thicker than the right ventricle's and it generates higher pressure. Correct.
Statement 4 — The aorta carries blood at higher pressure than the pulmonary artery because the systemic circulation has greater resistance than the pulmonary circulation. Incorrect.
Only statements 1 and 3 are correct.
Answer
B
B
Background Concept
The mammalian heart is a double pump. The right side handles the pulmonary circulation (heart → lungs → heart), while the left side handles the systemic circulation (heart → body → heart).
- Right atrium → receives deoxygenated blood from the body via the superior and inferior venae cavae.
- Right ventricle → pumps this deoxygenated blood to the lungs through the pulmonary artery.
- Left atrium → receives oxygenated blood returning from the lungs via the pulmonary veins.
- Left ventricle → pumps oxygenated blood to the entire body through the aorta.
Because the systemic circulation has a much longer pathway and higher resistance than the pulmonary circulation, the left ventricle must generate substantially more force. This is why the left ventricular wall is roughly three times thicker than the right, and why aortic pressure exceeds pulmonary artery pressure.
Understanding the Question
This is a multiple-choice question (Paper 1). Four statements are given, and the candidate must select the option that lists only the correct statements. The question tests recall and understanding of:
- Which chambers hold oxygenated versus deoxygenated blood.
- Where each side of the heart sends its blood (pulmonary vs. systemic).
- The relationship between wall thickness and pressure generated.
- The relative pressures in the aorta and pulmonary artery.
Approach
Evaluate each statement independently against what is known about cardiac anatomy and haemodynamics, then match the set of correct statements to one of the four options.
Step-by-Step Reasoning
Statement 1: "The right atrium and right ventricle contain deoxygenated blood going to the lungs."
- The right atrium receives deoxygenated blood from the body via the venae cavae.
- The right ventricle pumps that deoxygenated blood through the pulmonary artery to the lungs, where it is oxygenated.
- This statement is correct.
Statement 2: "The left atrium and left ventricle contain oxygenated blood going to the pulmonary circulation."
- The left side does contain oxygenated blood.
- However, the left ventricle ejects blood into the aorta for the systemic circulation, not the pulmonary circulation.
- This statement is incorrect.
Statement 3: "The left ventricle has a thicker wall than the right ventricle and delivers blood at higher pressure."
- The left ventricular myocardium is much thicker because it must pump blood throughout the entire body against higher systemic resistance.
- It therefore generates higher pressure than the right ventricle (which only pumps to the nearby lungs).
- This statement is correct.
Statement 4: "The pressure of blood in the aorta is less than that in the pulmonary artery."
- Aortic pressure (typically ~120/80 mmHg at rest) is higher than pulmonary artery pressure (typically ~25/8 mmHg), because the systemic circulation offers more resistance.
- The statement reverses the true relationship.
- This statement is incorrect.
Only statements 1 and 3 are correct, matching option B.
Key Takeaways
- The right side of the heart handles deoxygenated blood and the pulmonary circulation; the left side handles oxygenated blood and the systemic circulation.
- The left ventricle has the thickest wall because it must generate the highest pressure to overcome systemic vascular resistance.
- Aortic pressure > pulmonary artery pressure at all times in the cardiac cycle.
Common Mistakes
- Confusing pulmonary and systemic circuits: Students often mix up which side of the heart supplies which circulation, leading them to accept statement 2.
- Thinking both sides generate equal pressure: Because both sides are part of the same heart, students may incorrectly assume that pressure in the aorta and pulmonary artery are similar, accepting statement 4.
- Confusing the pulmonary artery (carries deoxygenated blood) with pulmonary veins (carry oxygenated blood): A reminder that arteries are defined by direction of flow away from the heart, not by oxygen content.
Things to Be Careful About
- "Artery" always means a vessel carrying blood away from the heart, regardless of oxygen content. The pulmonary artery is the only named artery that carries deoxygenated blood.
- The pulmonary circulation is a low-pressure, low-resistance system; the systemic circulation is a high-pressure, high-resistance system.
- "Going to the lungs" = pulmonary circulation; "going to the body" = systemic circulation. Read each statement carefully for this distinction.
How is most carbon dioxide transported in the blood?
Options
A as carbaminohaemoglobin
B as carbonic acid
C as hydrogencarbonate ions
D in solution in cytoplasm
Working
In respiring tissues, CO₂ diffuses into red blood cells where carbonic anhydrase catalyses its reaction with water:
Most of the H⁺ binds to haemoglobin and most of the diffuses out into the plasma (chloride shift), so the majority of CO₂ is carried as hydrogencarbonate ions (~70%). Smaller fractions are carried as carbaminohaemoglobin (~20–25%) and dissolved directly in the cytoplasm (~5–10%).
Answer
C
C
Background Concept
Carbon dioxide is produced continuously in respiring cells as a waste product of aerobic respiration. It must be removed from tissues and carried in the blood to the lungs for exhalation. CO₂ is poorly soluble in blood plasma, so it is transported by three main mechanisms, each making up a different proportion of the total load:
- Hydrogencarbonate ions (HCO₃⁻) – the largest fraction, around 70% of CO₂.
- Carbaminohaemoglobin – CO₂ bound to the amine (–NH₂) groups of globin chains on haemoglobin, about 20–25%.
- Dissolved CO₂ in the cytoplasm/plasma, around 5–10%.
The conversion of CO₂ to HCO₃⁻ is catalysed by the enzyme carbonic anhydrase, found inside red blood cells. The reaction is reversible, so in the lungs the HCO₃⁻ re-enters red blood cells, is converted back to CO₂, and diffuses out to be exhaled.
The chloride shift is important here: as HCO₃⁻ diffuses out of red blood cells into the plasma, Cl⁻ ions move in to maintain electrical balance. H⁺ produced at the same time is buffered by binding to haemoglobin, preventing a large fall in blood pH (the Haldane effect also favours Hb binding of CO₂ in peripheral tissues and release in the lungs).
Understanding the Question
The question asks for the form in which most CO₂ is carried in the blood. This is a recall question on a quantitative fact from the Transport in Mammals topic — the word most is the critical qualifier. All four options are real, but only one is the dominant method.
Approach
Identify the three transport methods and recall their approximate proportions. Select the option corresponding to the largest fraction.
Step-by-Step Reasoning
- Option A – carbaminohaemoglobin: This is real and contributes ~20–25% of CO₂ transport, but it is not the largest fraction, so it is wrong.
- Option B – carbonic acid (H₂CO₃): H₂CO₃ is the intermediate formed by the action of carbonic anhydrase, but it immediately dissociates into H⁺ + HCO₃⁻. Very little CO₂ actually travels as H₂CO₃; it is essentially a transient species, so this option is wrong.
- Option C – hydrogencarbonate ions (HCO₃⁻): About 70% of CO₂ is carried in this form, having been converted inside red blood cells and then exported into plasma. This is the dominant method.
- Option D – in solution in cytoplasm: A small fraction (~5–10%) of CO₂ does dissolve in the cytoplasm/plasma, but it is the smallest of the three methods, so it is wrong.
Therefore the correct answer is C.
Key Takeaways
- ~70% of CO₂ is transported as hydrogencarbonate ions (HCO₃⁻) in blood plasma — the dominant method.
- Carbonic anhydrase inside red blood cells catalyses the conversion of CO₂ to H₂CO₃, which dissociates into H⁺ + HCO₃⁻.
- The chloride shift and buffering of H⁺ by haemoglobin allow large amounts of HCO₃⁻ to be carried without drastically changing blood pH.
- Carbaminohaemoglobin (~20–25%) and dissolved CO₂ (~5–10%) are minor contributors.
Common Mistakes
- Selecting A (carbaminohaemoglobin) because the question is about blood — students remember that CO₂ binds to haemoglobin but forget this is the minor route.
- Selecting D (in solution in cytoplasm) by confusing this with the O₂ transport story (most O₂ is bound to haemoglobin, not dissolved).
- Selecting B (carbonic acid) by confusing the intermediate H₂CO₃ with the final transported form, which is its dissociation product HCO₃⁻.
Things to Be Careful About
- The answer requires the dominant form, not just any valid form. The qualifier most must not be overlooked.
- Distinguish H₂CO₃ (carbonic acid, the unstable intermediate) from HCO₃⁻ (hydrogencarbonate, the transported ion). Only HCO₃⁻ scores the mark.
- The chloride shift is the mechanism that lets HCO₃⁻ accumulate in plasma; it is part of the same pathway but is not itself a transport method.
Which row shows the tissues that are present in the wall of the trachea and the wall of the bronchus?
| cartilage | ciliated epithelium | smooth muscle | |
|---|---|---|---|
| A | ✓ | ✓ | ✓ |
| B | ✓ | ✓ | ✗ |
| C | ✓ | ✗ | ✓ |
| D | ✗ | ✓ | ✗ |
key
✓ = present
✗ = not present
Options
A row A
B row B
C row C
D row D
Working
The wall of the trachea contains cartilage (C-shaped rings), ciliated epithelium (with goblet cells) and smooth muscle. The wall of the bronchus has the same three tissues: cartilage (in plates rather than complete rings), ciliated epithelium and smooth muscle. Therefore all three tissues (✓, ✓, ✓) are present in both walls.
Answer
A
A
Background Concept
The human gas exchange (respiratory) system conducts air from the trachea down through two main bronchi, which branch into secondary and tertiary bronchi and then bronchioles before reaching the alveoli. The walls of the trachea and bronchi share a common set of tissue types that support their function in air conduction:
- Cartilage: provides rigid support that holds the airway open, preventing collapse during the pressure changes of breathing. In the trachea this forms incomplete C-shaped rings; in the bronchi the cartilage is present as irregular plates.
- Ciliated epithelium: pseudostratified ciliated columnar epithelium lines the lumen. The cilia beat in a coordinated manner to move the mucus layer (secreted by goblet cells) upwards towards the pharynx, where it is swallowed. This is the mucociliary escalator.
- Smooth muscle: allows the airway diameter to be regulated by the autonomic nervous system. In conditions such as asthma, contraction of this smooth muscle (bronchoconstriction) narrows the airway.
These three tissues are present in both the trachea and the bronchi. They begin to change as the airways branch into smaller bronchioles, where the cartilage disappears first and the smooth muscle becomes the dominant structural component, before the alveoli — which have no cartilage, no smooth muscle and no cilia.
Understanding the Question
The question provides a table of three tissues (cartilage, ciliated epithelium, smooth muscle) and asks which combination of present/not present ticks applies to both the tracheal wall and the bronchial wall. Because the three tissues listed are exactly the ones common to the walls of both airways, the row with all three ticks (✓) is the correct answer.
Approach
Recall the tissue composition of the tracheal and bronchial walls and check which tissues are common to both. Then match that combination to one of the four rows.
Step-by-Step Reasoning
- Tracheal wall tissues: cartilage (C-rings), ciliated epithelium, smooth muscle, plus goblet cells and elastic fibres — all three listed tissues are present (✓, ✓, ✓).
- Bronchial wall tissues: cartilage (plates), ciliated epithelium, smooth muscle — all three listed tissues are present (✓, ✓, ✓).
- The intersection of tissues present in both walls is {cartilage, ciliated epithelium, smooth muscle} — every one of them.
- Row A: ✓, ✓, ✓ — matches the intersection. ✓
- Row B: ✓, ✓, ✗ — incorrectly excludes smooth muscle, which is present in both. ✗
- Row C: ✓, ✗, ✓ — incorrectly excludes ciliated epithelium, which lines both airways. ✗
- Row D: ✗, ✓, ✗ — incorrectly excludes cartilage, which is present in both. ✗
Key Takeaways
- The trachea and bronchi share the same basic wall composition: cartilage, ciliated epithelium, smooth muscle, plus supporting connective tissue.
- Cartilage transitions from C-shaped rings in the trachea to irregular plates in the bronchi, but is present in both.
- Smooth muscle is present in both, allowing bronchoconstriction and bronchodilation in response to nervous and hormonal signals.
- It is only further down the airway (bronchioles and beyond) that tissues begin to disappear: cartilage is lost first, then cilia and goblet cells, with smooth muscle persisting longest.
Common Mistakes
- Choosing B because candidates forget that smooth muscle is present in the trachea (it lies between the open ends of the C-shaped cartilage rings and the mucosa).
- Choosing C because ciliated epithelium is sometimes associated only with the trachea in simplified teaching; it actually lines the bronchi too.
- Choosing D by confusing bronchi with bronchioles — bronchioles lack cartilage, but the larger bronchi in the question still contain it.
Things to Be Careful About
- Distinguish between bronchus (plural bronchi) and bronchiole. Bronchi still contain cartilage; bronchioles do not. The question specifies bronchus, not bronchiole.
- "Smooth muscle" is a tissue type distinct from the skeletal muscle of, e.g., the diaphragm, and from cardiac muscle. Make sure the answer reflects the presence of the smooth (involuntary) muscle layer in the airway wall.
Which factors maintain the diffusion gradient for carbon dioxide at the surface of the alveoli?
1 blood flow around the alveoli
2 breathing movement exchanging air in the lungs
3 thin epithelial lining of the alveoli
Options
A 1 and 2
B 1 and 3
C 1 only
D 2 and 3
Working
A diffusion gradient is maintained by keeping the concentration of CO₂ low on the air side (by ventilation — breathing movements) and by removing CO₂ from the blood side (by blood flow/perfusion around the alveoli).
- Statement 1: blood flow carries CO₂ away from the alveolar surface, keeping blood CO₂ low → maintains the gradient. ✓
- Statement 2: breathing in fresh air replaces CO₂-rich alveolar air with air of lower CO₂ concentration → maintains the gradient. ✓
- Statement 3: a thin epithelial lining shortens the diffusion distance (Fick's law), so it increases the rate of diffusion, but it does not maintain the concentration gradient. ✗
Answer
A
A
Background Concept
Gas exchange between the alveoli and the blood occurs by diffusion, which depends on a concentration gradient of the gas across the alveolar wall. For CO₂, the gradient runs from the blood (higher CO₂, because it is being delivered from respiring tissues) into the alveolar air (lower CO₂). If this gradient were not maintained, net diffusion of CO₂ would stop regardless of how suitable the alveolar wall is as a barrier.
A useful framework here is Fick's law of diffusion:
Notice that Fick's law separates the gradient (a concentration difference) from the rate (how fast molecules cross). The question specifically asks what maintains the gradient, not what speeds diffusion up.
Understanding the Question
The question lists three features of the gas exchange system and asks which ones actively keep the CO₂ concentration difference across the alveolar wall in place. The command word is implicit ("which factors maintain…"), so the candidate must decide, for each statement, whether it preserves the gradient or merely facilitates diffusion in some other way.
Approach
For each statement, ask: does this keep CO₂ low on one side of the alveolar wall and high on the other? If yes, it maintains the gradient. If it only changes the speed of diffusion (e.g. distance, surface area) without altering the concentrations on either side, it does not.
Step-by-Step Reasoning
- Statement 1 — blood flow around the alveoli. Blood continuously arrives with a high CO₂ concentration (from respiring tissues) and leaves with a lower CO₂ concentration (having given up CO₂ to the alveolus). This continuous removal of CO₂ from the blood side keeps the blood CO₂ low relative to alveolar CO₂, sustaining the gradient. ✓ Maintains the gradient.
- Statement 2 — breathing movements exchanging air in the lungs. Inhalation replaces CO₂-rich alveolar air with fresh atmospheric air (≈ 0.04% CO₂), keeping the alveolar CO₂ concentration low relative to the blood. Exhalation removes CO₂-rich air. Ventilation therefore keeps the air side of the gradient low. ✓ Maintains the gradient.
- Statement 3 — thin epithelial lining of the alveoli. A short diffusion distance increases the rate at which CO₂ crosses the membrane (Fick's law), but it does nothing to the concentrations on either side. ✗ Does not maintain the gradient.
Therefore the correct combination is 1 and 2 → A.
Key Takeaways
- To maintain a diffusion gradient, you need continuous supply on one side and continuous removal on the other. In the lungs this is achieved by ventilation (air movement) and perfusion (blood flow).
- To increase the rate of diffusion, you need a large surface area, a short distance, and a steep gradient — but only ventilation and perfusion actually keep the gradient steep.
- Fick's law is a common trap in MCQs: candidates confuse the terms in the equation (gradient, surface area, thickness) with the idea of "maintaining the gradient."
Common Mistakes
- Picking D (2 and 3) because a "thin lining" sounds like it helps gas exchange — it does, but it helps the rate, not the gradient.
- Picking B (1 and 3) for the same reason.
- Picking C (1 only) — blood flow alone cannot keep the air side of the gradient low without ventilation to refresh alveolar air.
Things to Be Careful About
- Read the command word precisely: maintain the gradient (about concentrations on each side) is different from increase the rate of diffusion (about the membrane and the concentration difference together).
- Thin alveoli walls, large surface area, and moist surfaces all aid gas exchange but do not, by themselves, maintain the concentration gradient.
A student made notes about two diseases: hand, foot and mouth disease (HFMD) and Lyme disease.
HFMD is caused by a viral pathogen and is transmitted in a variety of ways including:
● ingestion of water contaminated with faeces
● inhalation of droplets containing the pathogen.
Lyme disease is caused by a bacterial pathogen and is transmitted by the bite of an infected insect.
Which statement makes a correct comparison between the diseases the student wrote about and cholera, malaria or tuberculosis (TB)?
Options
A Antibiotics can be used to kill the vector of the pathogen that causes malaria and the vector of the pathogen that causes Lyme disease.
B HFMD can be transmitted in a similiar way to either cholera or TB.
C The cells of the pathogen that causes HFMD and the cells of the pathogen that causes TB are prokaryotic.
D Transmission of TB and HFMD could be reduced by chlorinating drinking water.
Working
HFMD is transmitted by ingestion of water contaminated with faeces — the same faecal–oral route as cholera — and by inhalation of droplets, the same airborne route as TB. So HFMD can be transmitted in a way similar to either cholera or TB.
Answer
B
B
Background Concept
Transmission of an infectious disease is determined by where the pathogen lives in the host, how it leaves the host, and how it enters a new host. The syllabus diseases have characteristic routes:
- Cholera (Vibrio cholerae) — a bacterium that colonises the small intestine. It is shed in faeces and spread by the faecal–oral route, typically through drinking water contaminated with sewage.
- Malaria (Plasmodium spp.) — a protoctistan parasite. The vector is the Anopheles mosquito, which injects sporozoites into the bloodstream when it feeds.
- Tuberculosis (TB) (Mycobacterium tuberculosis) — a bacterium that infects the lungs. It is spread by inhalation of respiratory droplets (droplet infection) released when an infected person coughs.
HFMD (hand, foot and mouth disease) is caused by an enterovirus and Lyme disease by the bacterium Borrelia burgdorferi, transmitted by tick bites. Antibiotics kill bacteria (or inhibit their growth) — they do not kill insect or arachnid vectors, and they have no effect on viruses.
Understanding the Question
The stem gives us two pieces of information: HFMD is viral and can be transmitted by faecal contamination of water and by droplet inhalation; Lyme disease is bacterial and tick-borne. The task is to pick the statement that correctly compares these with cholera, malaria or TB.
Approach
Test each option against the transmission biology and pathogen biology of the diseases named in it. Reject any option that contains a biologically incorrect claim about a route, a vector or a cell type.
Step-by-Step Reasoning
- Option A — antibiotics killing the malaria and Lyme disease vectors. Both vectors (mosquito, tick) are eukaryotic animals, not bacteria. Antibiotics target prokaryotic processes (e.g. cell-wall synthesis, ribosomal subunits) and have no effect on metazoan vectors. Reject.
- Option B — HFMD transmitted like cholera or TB. HFMD's listed routes are (i) ingestion of faecally contaminated water, which is the route for cholera, and (ii) inhalation of droplets, which is the route for TB. Either of these is a valid similarity. Correct.
- Option C — HFMD and TB pathogens are prokaryotic. TB is caused by a bacterium (prokaryotic), but HFMD is caused by a virus — viruses are non-cellular and have no cells at all, prokaryotic or otherwise. Reject.
- Option D — chlorinating drinking water reduces TB transmission. TB is spread by droplet inhalation, not through the water supply. Chlorination of drinking water targets water-borne pathogens such as Vibrio cholerae. It would have no useful effect on TB transmission (and HFMD, although it can be water-borne, shares the droplet route with TB which chlorination does not address). Reject.
Key Takeaways
- Faecal–oral (water-borne) transmission characterises cholera; droplet inhalation characterises TB; vector-borne transmission (by bite) characterises malaria.
- The vector of a disease is the organism that carries the pathogen between hosts — it is not the same as the pathogen itself, and antibiotics act on the pathogen, not the vector.
- Viruses are non-cellular; do not classify them as prokaryotic or eukaryotic.
- A public-health intervention (chlorination, vaccination, bed nets, etc.) only reduces transmission if it targets the actual route of that disease.
Common Mistakes
- Choosing A because the candidate remembers that antibiotics are useful against bacterial infections and forgets that they act on the pathogen, not the vector.
- Choosing C because TB is bacterial and the candidate does not stop to check what HFMD is — viruses are not cells of any kind.
- Choosing D because chlorination "kills pathogens" without checking whether water is even a relevant transmission route for TB.
Things to Be Careful About
- When an MCQ option uses "either … or …", only one of the two comparisons has to be correct for the option to be correct.
- Always read the vector vs pathogen distinction carefully — drugs that kill the pathogen do not necessarily affect its vector.
- The phrase "cells of the pathogen" is a deliberate trap for viral diseases; viruses have no cells.
Which statements explain why antibiotics may not treat cholera successfully?
1 The infectious organism has developed resistance to the antibiotic.
2 Antibiotics cannot harm viruses.
3 Antibiotics do not affect pathogens that are eukaryotic.
Options
A 1, 2 and 3
B 1 only
C 2 only
D 3 only
Working
Cholera is caused by Vibrio cholerae, a prokaryotic bacterium. Antibiotics are designed to target prokaryotic cells, so statements 2 (viruses) and 3 (eukaryotic pathogens) are not relevant reasons for antibiotic failure in cholera. Only statement 1 is correct: the bacterium can acquire resistance via mutation or gene transfer, making the antibiotic ineffective.
Answer
B
B
Background Concept
Cholera is an infectious disease of the small intestine caused by the bacterium Vibrio cholerae, transmitted through contaminated drinking water. Because it is a bacterium (prokaryote), it is a potential target for antibiotics, which work by disrupting processes specific to prokaryotic cells — for example, inhibiting cell wall synthesis (e.g. penicillin binding to peptidoglycan), blocking protein synthesis on 70S ribosomes, or interfering with DNA replication.
Antibiotics are not universal cures, however. There are two fundamental reasons they might fail:
- The pathogen is not a target type for antibiotics (e.g. viruses, which lack the structures antibiotics attack, or eukaryotic pathogens, against which most common antibiotics are ineffective).
- The bacterium has acquired resistance, often through mutation or horizontal gene transfer (e.g. via plasmids carrying resistance genes), so the antibiotic can no longer inhibit or kill it.
Understanding the Question
The question asks which statements genuinely explain why antibiotics may not successfully treat cholera. Each statement must be evaluated for whether it applies to Vibrio cholerae specifically. A statement can be biologically true in general but still be the wrong answer if it is not a reason for treatment failure in cholera.
Approach
For each numbered statement:
- Determine whether it describes a real, relevant limitation of antibiotic use against the cholera bacterium.
- Distinguish between "true in general" and "true and relevant here."
Step-by-Step Reasoning
Statement 1: "The infectious organism has developed resistance to the antibiotic."
- V. cholerae is a bacterium and is therefore a target for antibiotics.
- Bacterial resistance arises through spontaneous mutation or via plasmids (R-plasmids) carrying resistance genes; this is well documented in V. cholerae.
- A resistant strain survives antibiotic treatment, so the infection persists.
- ✅ Valid reason for antibiotic failure in cholera.
Statement 2: "Antibiotics cannot harm viruses."
- True in general: viruses lack cell walls, ribosomes and metabolism of their own, so antibiotics have no target.
- However, cholera is not caused by a virus — it is caused by a bacterium. Therefore, this statement does not explain why antibiotics fail against cholera.
- ❌ Not a relevant reason for cholera treatment failure.
Statement 3: "Antibiotics do not affect pathogens that are eukaryotic."
- Also generally true: most common antibiotics target prokaryotic features (e.g. peptidoglycan cell walls, 70S ribosomes) that eukaryotes lack or that differ in eukaryotic cells.
- But V. cholerae is prokaryotic, not eukaryotic. So this statement does not apply to cholera.
- ❌ Not a relevant reason for cholera treatment failure.
Only statement 1 explains antibiotic failure in cholera, so the correct option is B (1 only).
Key Takeaways
- Always identify the type of pathogen before applying rules about antibiotic action.
- Cholera = bacterial (prokaryotic) → antibiotics can work in principle → resistance is the realistic cause of failure.
- Statements 2 and 3 are true statements about antibiotics in general, but they are red herrings here because they describe limits that do not apply to V. cholerae.
Common Mistakes
- Choosing A because statements 2 and 3 are "true facts about antibiotics" — but the question asks why antibiotics may fail against cholera specifically, so irrelevant truths do not count.
- Confusing cholera with a viral or eukaryotic disease (it is a Gram-negative prokaryote).
Things to Be Careful About
- Read the question carefully: it asks why antibiotics may not treat cholera successfully, not "what are the limitations of antibiotics in general."
- Recognise that "true" ≠ "relevant to the scenario." Mark schemes reward statements that genuinely explain the given situation.
The statements describe the phagocytosis of a bacterium by a macrophage.
1 Digestive enzymes break down the bacterium.
2 Lysosome fuses with the vacuole.
3 Macrophage displays the bacterial antigens on its cell surface membrane.
4 Macrophage engulfs the bacterium and encloses it in a vacuole.
5 Receptors on the cell surface membrane of macrophage bind to the bacterium.
Which order is correct for phagocytosis?
Options
A
B
C
D
Working
The correct sequence of phagocytosis by a macrophage is:
- Receptors on the cell surface membrane of the macrophage bind to the bacterium (5).
- The macrophage engulfs the bacterium and encloses it in a vacuole (4).
- The lysosome fuses with the vacuole (2).
- Digestive enzymes break down the bacterium (1).
- The macrophage displays the bacterial antigens on its cell surface membrane (3).
This gives the order 5 → 4 → 2 → 1 → 3, which matches option C.
Answer
C
C
Background Concept
Phagocytosis is the non-specific engulfment of a solid particle, such as a bacterium, by a phagocytic cell. In mammals, macrophages and neutrophils are the main phagocytes. The process is an active, energy-requiring form of endocytosis and forms the first line of the non-specific (innate) immune response, but it is also the crucial first step that allows antigens from the destroyed pathogen to be presented to T-lymphocytes, linking the innate and adaptive immune systems.
A lysosome is a membrane-bound organelle containing hydrolytic (digestive) enzymes. It fuses with the phagosome (the vacuole containing the engulfed material) to form a phagolysosome, in which the pathogen is destroyed.
Understanding the Question
The question lists five statements describing stages of phagocytosis and asks for the correct biological order. Because the options are given as numbered sequences, the task is to match each labelled step to its correct position in the process.
Approach
Think of phagocytosis as: recognition → engulfment → internal digestion → antigen presentation. Match each of the five statements to the most appropriate stage:
- Step 5 (receptors bind to the bacterium) must come first — the macrophage must recognise the pathogen before it can engulf it.
- Step 4 (engulfment and enclosure in a vacuole) follows recognition.
- Step 2 (lysosome fuses with the vacuole) is next — the lysosome delivers digestive enzymes to the phagosome.
- Step 1 (digestive enzymes break down the bacterium) follows fusion of the lysosome.
- Step 3 (display of antigens on the cell surface membrane) occurs after digestion — the macrophage presents the bacterial antigens so T-lymphocytes can be activated.
Step-by-Step Reasoning
- 5 must be first. The cell cannot engulf what it has not detected. Receptor binding triggers the membrane to begin invaginating around the bacterium.
- 4 follows 5. Engulfment (engulfing) is the formation of the phagosome/vacuole around the bacterium.
- 2 follows 4. Once the bacterium is sealed inside a vacuole, the lysosome fuses with it to deliver hydrolytic enzymes into the phagolysosome.
- 1 follows 2. It is the digestive enzymes that break down the bacterium — this only happens once the lysosome has fused with the vacuole.
- 3 comes last. After digestion, fragments of bacterial protein (antigens) are moved to the macrophage's cell surface membrane for presentation to helper T-lymphocytes, which then activates the specific immune response.
The sequence 5 → 4 → 2 → 1 → 3 corresponds to option C.
Key Takeaways
- Phagocytosis sequence: receptor recognition → engulfment (phagosome formation) → lysosome fusion (phagolysosome) → digestion → antigen presentation (MHC II on surface).
- Digestion must occur after lysosome fusion — enzymes cannot act until they reach the bacterium.
- Antigen presentation comes after digestion, because the bacterium must first be broken down to expose the antigenic fragments.
Common Mistakes
- Confusing 4 and 5 — some candidates place engulfment (4) before recognition (5). Receptor binding must occur first because it is what triggers engulfment.
- Placing antigen presentation (3) early in the sequence — antigens can only be displayed after the bacterium has been broken down.
- Confusing lysosome fusion (2) with digestion (1) — the fusion must precede digestion because it is what delivers the digestive enzymes.
Things to Be Careful About
- Remember that phagocytes are part of the non-specific immune response, but the antigen-presenting step (3) is the bridge that engages the specific (adaptive) response via T-lymphocytes.
- The bacterium is enclosed in a vacuole (phagosome) before the lysosome joins it; the resulting phagolysosome is where digestion actually occurs.
Two people, G and H, were each given an injection to protect them against a particular pathogen.
One person was injected with antibodies. The other person was injected with a vaccine.
The graph shows the concentrations of the antibody against this pathogen in the blood of the two people, G and H, during a period of 20 days after their injections.
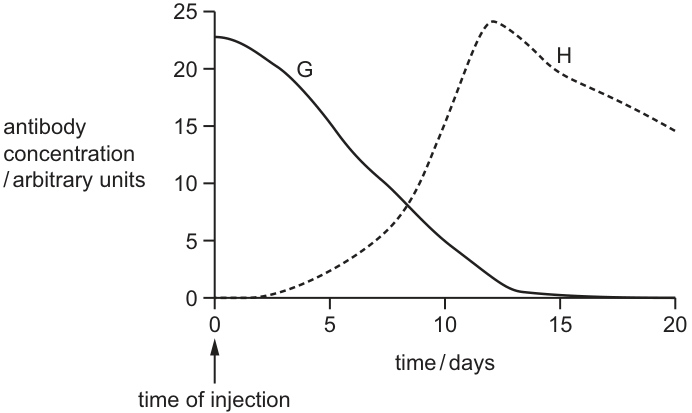
Which row correctly describes the type of immunity shown by G and H?
Options
| G | H | |
|---|---|---|
| A | artificial active immunity | artificial passive immunity |
| B | artificial passive immunity | artificial active immunity |
| C | natural active immunity | natural passive immunity |
| D | natural passive immunity | natural active immunity |
Working
Curve G starts high at day 0 and declines steadily — the antibodies were already present at the time of injection, so they were introduced directly. This is passive immunity (antibodies supplied, not made by the recipient). Because the antibodies were given by injection, it is artificial.
Curve H starts at zero, shows a lag, then rises to a peak around day 12. The body has responded to an antigen by producing its own antibodies — this is active immunity. Because a vaccine was injected, it is artificial.
Therefore: G = artificial passive immunity; H = artificial active immunity.
Answer
B
B
Background Concept
Immunity is the body's ability to defend itself against pathogens. The four key classifications of immunity depend on two independent questions:
-
Did the body produce the antibodies itself, or were they supplied from outside?
- Active immunity — the recipient's own immune system produces antibodies in response to an antigen (e.g. after infection or vaccination). There is a lag phase as B-lymphocytes are selected, clone, and differentiate into plasma cells. Antibody levels rise, peak, then are maintained — often with memory cells enabling a fast secondary response.
- Passive immunity — the recipient is given ready-made antibodies (e.g. from a donor, mother via placenta/breast milk, or an antiserum injection). Protection is immediate (no lag) but short-lived, because the foreign antibodies are gradually broken down and the recipient's own immune system was not stimulated to produce more or to make memory cells.
-
Did the antigen or antibody arise naturally, or was it administered medically?
- Natural — through normal biological exposure (infection, maternal transfer).
- Artificial — through deliberate medical intervention (vaccination, antibody injection).
Both axes are independent: you can have natural active (caught the disease), natural passive (mother's antibodies across placenta), artificial active (vaccine) and artificial passive (injection of antiserum/antibodies).
Understanding the Question
The stem tells us two people received an injection to protect them against a pathogen. One was injected with antibodies and the other with a vaccine. The graph (Fig. 40.1) shows the concentration of antibody in the blood of G and H over 20 days.
The graph shows two very different kinetic profiles:
- G: high antibody concentration at day 0, falling steadily to near zero by day 15–20.
- H: zero antibody at day 0, a slow rise for ~5 days, a steep rise to a peak around day 12, then a slow decline.
The command word is implicit: identify the correct description. We must match each curve to a type of immunity and then check which row of the table fits.
Approach
For each person, decide two things:
- Active or passive? — read from the shape of the curve at and after day 0 (immediate presence of antibody = passive; delayed rise = active).
- Natural or artificial? — read from the stem (both were given injections by a clinician, so both are artificial).
Then pick the row that places these two labels on the correct people.
Step-by-Step Reasoning
Person G
- Antibody concentration is already at its maximum (~23 arbitrary units) at day 0 — the moment the injection was given.
- This means the antibodies were not made by G; they were supplied ready-made in the injection.
- ⇒ Passive immunity (antibodies introduced directly).
- Because the antibodies were delivered by a medical injection rather than arriving via the placenta, breast milk, or infection, this is artificial passive immunity.
- The decline over 15–20 days is consistent with the gradual catabolism of the foreign immunoglobulin by the recipient — passive immunity is always short-lived because no memory cells are generated.
Person H
- Antibody concentration is 0 at day 0, stays low for several days, then rises sharply between roughly days 5 and 12 to a peak of ~23 units before slowly falling.
- The lag phase and subsequent rise are diagnostic: H's own immune system is mounting a primary response to an antigen (the vaccine).
- ⇒ Active immunity (the recipient's plasma cells are making the antibody).
- Because the antigen was introduced by a medical injection (a vaccine) rather than by catching the disease naturally, this is artificial active immunity.
- The peak at day 12 and subsequent slow decline is the expected profile of a primary humoral response: clonal selection, B-cell proliferation, plasma cell antibody production, and contraction once the antigen is cleared.
Matching to the table
- G = artificial passive immunity
- H = artificial active immunity
Only one row of the table places these two labels on the correct people: row B.
Key Takeaways
- Passive immunity = immediate antibody, no lag, short duration, no memory cells.
- Active immunity = lag, then rising antibody, longer duration, memory cells produced.
- Natural vs artificial refers to how the antigen/antibody was acquired, not to the curve shape — vaccination and antiserum injection are both artificial.
- Always use the stem to decide natural/artificial, and the graph (curve shape) to decide active/passive.
Common Mistakes
- Swapping G and H: students who think "vaccine → fast response" choose A. A vaccine always causes a primary response with a lag — vaccination gives long-lasting protection because of memory cells, not because the antibody appears faster.
- Choosing C or D (natural): because the stem clearly states both received an injection, the immunity is artificial in both cases. Natural immunity would mean catching the disease (active) or receiving antibodies via the placenta/breast milk (passive).
- Confusing the peak of curve H with the start of curve G: the peaks are similar in height (~23 units), but the timing is the giveaway — G is already at peak on day 0, H does not peak until day 12.
- Forgetting the memory-cell distinction: passive immunity never produces memory cells, which is why curve G simply decays. If curve G were to spike again on a later re-exposure, that would be a secondary response, not passive immunity.
Things to Be Careful About
- Read the y-axis label carefully: antibody concentration, not total immune response — cell-mediated immunity (T-cells) is not shown on this graph.
- "Antibody injected" is not the same as "antigen injected that produces antibody later" — the timing of antibody appearance is the deciding feature.
- Both curves end below their peaks; the drop after H's peak is the normal contraction phase, not a sign of failure of the vaccine.
- The injection arrow is at day 0 — both people start from the same baseline time-wise, so any difference in antibody at day 0 reflects the source of the antibody, not the time of sampling.
Your score so far
Answer a question to start scoring
Your marks add up here as you work through the paper.