Biology 9700/35 — October/November 2024
Cambridge AS Level · Advanced Practical Skills · worked solutions for every part, with the mark scheme
Topics Presentation of Data and Observations · Analysis, Conclusions and Evaluation · Manipulation, Measurement and Observation · Use of the Light Microscope
The enzyme amylase catalyses the hydrolysis (breakdown) of starch to reducing sugars, as shown in Fig. 1.1.
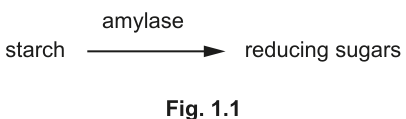
Fig. 1.1
A student investigated the effect of temperature on the hydrolysis of starch by the enzyme amylase.
The student:
- put of amylase into a test-tube
- put of starch solution into a different test-tube
- put the test-tubes into a water-bath at
- left the test-tubes for 3 minutes
- put the starch solution into the test-tube containing the amylase
- left the test-tube for 2 minutes
- immediately determined the relative amount of reducing sugars in the test-tube
- repeated this procedure at and at .
You are provided with three beakers, S1, S2 and S3. These three beakers contain the same products of the reaction between starch and amylase as the test-tubes prepared by the student.
You will determine:
- the relative amount of reducing sugar present in each beaker
- the presence or absence of starch in each beaker.
You are provided with the materials shown in Table 1.1.
Table 1.1
| labelled | contents | hazard | volume / |
|---|---|---|---|
| S1 | products of the reaction between starch and amylase at | none | 20 |
| S2 | products of the reaction between starch and amylase at | none | 20 |
| S3 | products of the reaction between starch and amylase at | none | 20 |
| U | products of the reaction between starch and amylase at an unknown temperature | none | 20 |
| B | Benedict’s solution | irritant | 30 |
| iodine | iodine solution | irritant | 15 |
If any solution comes into contact with your skin, wash off immediately with cold water.
It is recommended that you wear suitable eye protection.
To investigate the effect of temperature on the hydrolysis of starch by the enzyme amylase you will need to:
- carry out the test for reducing sugars on S1, S2 and S3
- determine the relative amount of reducing sugar in each solution
- carry out the test for starch on S1, S2, and S3
- determine the presence or absence of starch in each solution.
Explain why the student left the test-tubes in the water-bath for 3 minutes before adding the starch solution.
Answer
To allow the contents of both test-tubes (the starch solution and the amylase) to reach the temperature of the water-bath, so that the reaction starts at the intended temperature when the two are mixed.
To allow the contents of both test-tubes to reach the temperature of the water-bath before mixing.
Background Concept
When investigating how temperature affects the rate of an enzyme-catalysed reaction, the temperature of the reaction mixture is the independent variable. If the enzyme and substrate are mixed together before they have both equilibrated to the bath temperature, the reaction will begin at some other temperature (room temperature, or whatever the tubes were at before the bath) and only gradually warm up. Any measured rate will then reflect a mixture of temperatures rather than the intended one, and the data will be invalid.
Understanding the Question
The procedure in the question places the amylase tube and the starch tube separately in the water-bath, leaves them for 3 minutes, then mixes them. The candidate is asked to explain the purpose of that 3-minute wait before the mixing step. The command word "explain" requires a reason, not a description.
Approach
The mark scheme looks for a clear reference to the contents of the test-tubes reaching the temperature of the water-bath. Equivalently, the amylase and the starch solution must equilibrate to the bath temperature before the reaction is started. The key idea is thermal equilibration.
Step-by-Step Reasoning
- The water-bath sets the intended reaction temperature (0 °C, 40 °C or 100 °C in this experiment).
- Solutions stored at room temperature are warmer than 0 °C and cooler than 100 °C, so they must be given time to reach the bath temperature.
- Without this equilibration step the reaction would begin at an unknown intermediate temperature, ruining the control of the independent variable.
- Three minutes is a typical equilibration time for a few cm³ of liquid in a water-bath; it is not related to the reaction itself.
Key Takeaways
Pre-incubate both the enzyme and the substrate separately at the target temperature before mixing, so the reaction genuinely starts at the temperature being tested. This is a control-of-variables point that recurs in almost every enzyme-rate investigation.
Common Mistakes
- Saying "to start the reaction" — wrong, because the reaction is not started until the two solutions are mixed.
- Saying "to let the enzyme warm up" — imprecise; both tubes must equilibrate, and the temperature may be higher or lower than the starting temperature.
- Describing what happens in the 2-minute interval after mixing rather than the 3-minute interval before mixing.
Things to Be Careful About
The mark is awarded for the idea that the contents of the tubes reach the bath temperature. Any wording that conveys this idea scores; vague answers such as "to get the right temperature" do not, because they do not specify what reaches what temperature.
To determine the relative amount of reducing sugar in each solution, the time to the first colour change will be measured using of each solution.
Decide how you will test each solution to show the relative amount of reducing sugar present.
State the reagent you will use.
reagent ______
Describe how you will use the reagent to carry out the test for reducing sugars.
State how you will determine which solution has the highest amount of reducing sugar present.
Answer
Reagent: Benedict's solution.
Method:
- Add the same volume (e.g. 2 cm³) of Benedict's solution to 5 cm³ of each sample in a labelled test-tube.
- Place each tube in a water-bath at ≥ 80 °C and start a stop-clock immediately.
- Stop the clock at the first appearance of an orange/red colour and record the time taken.
Highest reducing-sugar content: the solution that produces the first colour change in the shortest time contains the highest amount of reducing sugar.
Benedict's reagent; add same volume to each tube, heat to ≥ 80 °C; shortest time to first colour change = highest reducing-sugar content.
Background Concept
Benedict's reagent contains copper(II) sulfate in alkaline conditions. When heated with a reducing sugar, Cu²⁺ is reduced to Cu⁺, which precipitates as red copper(I) oxide. The higher the concentration of reducing sugar, the more Cu²⁺ is reduced and the sooner the colour change from blue to green/yellow/orange/red brick is visible.
The semi-quantitative version of the test used here exploits the rate at which that colour change appears, rather than only the final colour. With controlled heating and a fixed volume of reagent, the time to the first colour change is inversely related to the amount of reducing sugar present.
Understanding the Question
The student is supplied with 5 cm³ of each of S1, S2 and S3, and 30 cm³ of Benedict's solution. The question asks the candidate to (i) name a suitable reagent, (ii) describe how the reagent will be used, and (iii) state how the result identifies the solution with the highest reducing-sugar content. The test must be carried out under controlled conditions so that the time measured is a fair comparison between samples.
Approach
Choose Benedict's reagent (not Fehling's, not Clinistix, because the question is the standard semi-quantitative Benedict's test). The volume of reagent and the heating temperature must be identical for every tube so that the only variable affecting the time is the concentration of reducing sugar. Then state the inverse relationship between time and reducing-sugar concentration.
Step-by-Step Reasoning
- Reagent — Benedict's solution. It is the standard CIE reagent for the reducing-sugar test and is on the list of materials in Table 1.1.
- Controlled volume — the same volume (an excess, e.g. 2 cm³, or any fixed volume) must be added to each tube so that the amount of Cu²⁺ available is not a limiting factor.
- Heated to ≥ 80 °C — Benedict's reaction is too slow at room temperature; the standard procedure uses a boiling water-bath (≈ 100 °C) or at least 80 °C to drive the reduction reaction at a measurable rate.
- Time the first appearance of colour — start a stop-clock when the tube enters the bath and stop it the moment a non-blue colour (green, yellow, orange or red) is seen. This is the dependent variable.
- Interpretation — because the rate of Cu₂O formation increases with the concentration of reducing sugar, the tube that changes colour first has the highest reducing-sugar content, and the tube that takes longest has the lowest.
Key Takeaways
The Benedict's test can be used semi-quantitatively by timing the first colour change, provided the volume of reagent and the heating temperature are kept constant. The shorter the time, the higher the concentration of reducing sugar. The complete reduction of Cu²⁺ (orange/red precipitate) is not needed for this comparison.
Common Mistakes
- Naming "Benedict's reagent" without any further detail — this only scores the first of the two marks.
- Stating a temperature below 80 °C — the reaction is too slow to time reliably.
- Stating that the darkest final colour shows the highest concentration — true in the qualitative version of the test, but here the time to first colour change is the quantity actually measured.
- Forgetting to specify that the same volume of Benedict's is used in every tube.
Things to Be Careful About
- "Excess Benedict's" and "same volume of Benedict's" are both acceptable; the mark scheme accepts either formulation.
- The time recorded is to the first colour change (not to a uniform end-point colour), because once the colour begins to change the rate information is lost.
- The hazard in Table 1.1 lists Benedict's as an irritant; gloves and eye protection are sensible.
Carry out step 1 to step 5.
step 1 Label one test-tube, S1.
step 2 Put of S1 into the test-tube.
step 3 Repeat step 1 and step 2 for S2 and S3.
step 4 Carry out the test for reducing sugars as you described in (a)(ii).
If the time taken to the first colour change is longer than 120 seconds then record as ‘more than 120’.
step 5 Record in (a)(iv) the time taken to the first colour change for each solution.
Carry out step 6 to step 11 to test for the presence of starch.
step 6 Label a clean test-tube, S1.
step 7 Put of S1 into the test-tube.
step 8 Repeat step 6 and step 7 for S2 and S3.
step 9 Put 2 drops of iodine solution into each test-tube. Shake gently to mix.
If any starch is present the solution will change to a blue colour.
step 10 Observe the colour in each test-tube.
step 11 Record in (a)(iv) the colour for each solution.
State the independent variable in this investigation.
Answer
Temperature.
temperature
Background Concept
In a controlled experiment the independent variable is the one that the experimenter deliberately changes, the dependent variable is the one that is measured, and control variables are kept constant. Here the experimenter places reaction mixtures in water-baths set to 0 °C, 40 °C and 100 °C and records the outcome of two tests, so the temperature of the bath is the variable being changed.
Understanding the Question
The investigation varies the water-bath temperature between three set values. The student is asked to name the independent variable. The command word "state" requires only the one-word answer.
Approach
Identify what is different between the three samples. S1, S2 and S3 are aliquots of the same enzyme–substrate mixture treated at three different temperatures. The temperature is the only thing changed by the experimenter.
Step-by-Step Reasoning
- The water-bath is set to 0 °C, 40 °C or 100 °C for each trial — these are the three values of the variable being changed.
- The volume of amylase, volume of starch, equilibration time and reaction time are kept the same throughout — they are control variables.
- The dependent variables are the time to first colour change in the Benedict's test and the colour obtained in the iodine test.
- Therefore the independent variable is temperature.
Key Takeaways
Being able to label IV, DV and control variables is a recurring practical skill; the IV is whatever the experimenter has set to a different value in each run.
Common Mistakes
- "Time" — wrong; time is part of the procedure, not the variable under test.
- "Concentration of starch / amylase" — wrong; these are kept constant.
- "Reducing sugar" or "presence of starch" — these are the dependent variables being measured.
Things to Be Careful About
The marking scheme accepts "temperature" alone; do not pad with units or qualifying clauses ("temperature of the water-bath" is still correct, but the single word is sufficient).
Answer
| sample | time to first colour change with Benedict's solution / s | colour with iodine solution |
|---|---|---|
| S1 | more than 120 | blue |
| S2 | (representative value, e.g. 25) | brown |
| S3 | more than 120 | blue |
(All values are example readings; the candidate should record their own observations to the precision of the stop-clock.)
See table — S1: > 120 s / blue; S2: short time (e.g. 25 s) / brown; S3: > 120 s / blue.
Background Concept
A results table for a practical investigation must record every reading under a clear heading. The convention is:
- the independent-variable heading comes first, with its unit;
- the dependent-variable heading follows, also with its unit;
- the unit is written once in the heading, never repeated in the body of the table;
- every cell of the table is filled (with a reading or with a dash to show the measurement was attempted but yielded no result).
Understanding the Question
The candidate has just performed the Benedict's test and the iodine test on S1, S2 and S3. They must tabulate both results. The mark scheme rewards:
- the IV heading (temperature / °C) appearing before the DV headings, with no unit in the body of the table;
- the DV headings — "time / s for the first colour change" and "colour (of iodine test)" — with no unit in the body;
- a time recorded for each sample;
- a colour recorded for each sample.
Approach
Set up a table with the sample identifier in the left column, then two further columns: one for the Benedict's-test time and one for the iodine-test colour. Write the units in the headings only, and fill in the cells with the actual observations.
Step-by-Step Reasoning
- Headings —
sample,time to first colour change with Benedict's solution / s,colour with iodine solution. The slash followed by the unit is the CIE convention; the unit must not appear again inside the table. - Body of the table — write the times as numbers, e.g. 25 (with the unit already in the heading), and the colours as words, e.g. blue, brown.
- Readings to record —
- S1: 0 °C water-bath, very little hydrolysis; the Benedict's colour change is slow (record "more than 120" s) and starch is still abundant (iodine → blue).
- S2: 40 °C water-bath, near the optimum for amylase; hydrolysis is fast (Benedict's changes colour quickly, e.g. 20–40 s) and starch is largely broken down (iodine → brown/yellow).
- S3: 100 °C water-bath, amylase denatured; no hydrolysis (Benedict's remains blue, record "more than 120" s) and starch remains (iodine → blue).
- Significant figures — times are recorded to the precision of the stop-clock (1 s), which is appropriate for a 0–120 s measurement.
Key Takeaways
A well-constructed results table has: an unambiguous heading for every column; units only in the heading; no blank cells (use "more than 120" or similar rather than leaving a dash); the IV column placed first.
Common Mistakes
- Putting units in the body of the table (e.g. writing "25 s" instead of "25").
- Reversing the order of the IV and DV columns.
- Leaving blank cells instead of writing "more than 120" when no colour change is observed.
- Putting a hyphen or dash for the colour observation instead of writing the actual colour seen.
Things to Be Careful About
The mark scheme explicitly checks that no unit appears in the body of the table. A candidate who writes "blue" as a heading rather than a colour in the body will lose marks here. Where a Benedict's tube fails to change colour within 120 s, the convention is to record "more than 120" rather than a dash.
Complete Table 1.2 using your results in (a)(iv).
For reducing sugar content use only the words: none, low, medium or high.
For presence of starch use only the words: present or absent.
You may use each word once, more than once or not at all.
Table 1.2
| reducing sugar content | presence of starch | |
|---|---|---|
| S1 | ||
| S2 | ||
| S3 |
Answer
| sample | reducing sugar content | presence of starch |
|---|---|---|
| S1 | low | present |
| S2 | high | absent |
| S3 | none | present |
(Exact wording may vary — S1 may be "low" or "medium" depending on the candidate's observation, but S3 should be "none" because the Benedict's test gives no colour change.)
S1: low / present; S2: high / absent; S3: none / present.
Background Concept
The candidate's quantitative observations (a time in seconds, a named colour) are converted here into a four-level qualitative scale for reducing-sugar content and a binary present/absent scale for starch. This step requires the candidate to interpret their own readings consistently: the shorter the Benedict's time, the higher the reducing-sugar level; the blue colour with iodine indicates starch is still present, while a brown or yellow colour indicates it has been hydrolysed.
Understanding the Question
The mark scheme requires two correct sequences:
- the reducing-sugar sequence based on the candidate's own times from (a)(iv) (shortest time → highest sugar, longest or no change → lowest sugar);
- the starch sequence based on the candidate's own colours from (a)(iv) (blue = present, brown/yellow = absent).
The candidate may use each word once, more than once, or not at all.
Approach
For each sample, look up the time recorded in (a)(iv) and assign the matching word from {none, low, medium, high}. Then look up the colour and assign "present" or "absent". The two columns are independent — they tell us about the substrate and the product of the same reaction.
Step-by-Step Reasoning
- S1 (0 °C): the Benedict's test shows very little colour change within 120 s, so the reducing-sugar content is low (or possibly "medium" if some colour is detected at the very end); iodine gives blue, so starch is present.
- S2 (40 °C): the Benedict's test changes colour quickly (well under 120 s), so reducing-sugar content is high; iodine gives brown, so starch is absent.
- S3 (100 °C): the Benedict's test gives no colour change within 120 s, so reducing-sugar content is none; iodine gives blue, so starch is present.
Key Takeaways
Always interpret a "no colour change" Benedict's result as "none" rather than "low", because the reagent has not been visibly reduced at all. The iodine test's blue colour is unambiguous evidence that unhydrolysed starch remains.
Common Mistakes
- Writing "low" for S3 because "a small amount of reducing sugar must still be present" — but the Benedict's test is not detecting any, so the correct word is "none".
- Confusing the two columns: writing "absent" for S1's starch and "low" for its reducing sugar (the second is correct, but the first should be "present").
- Using "medium" for S1 when the time is in fact more than 120 s and no reducing sugar is detectable — use "low" or "none".
Things to Be Careful About
The marking scheme marks the two columns independently: a correct reducing-sugar sequence and a correct starch sequence each score one mark, even if the qualitative levels do not match a hypothetical "ideal" answer, so long as they are consistent with the candidate's own (a)(iv) results.
Answer
- S1 (0 °C): at this low temperature the amylase and starch molecules have low kinetic energy, so few enzyme–substrate complexes form and only a small amount of starch is hydrolysed; reducing-sugar content is low and starch is still present.
- S2 (40 °C): this is close to the optimum temperature for amylase; molecules have high kinetic energy, many enzyme–substrate complexes form, and most of the starch is hydrolysed; reducing-sugar content is high and starch is absent.
- S3 (100 °C): the high temperature denatures the amylase (the active site loses its specific shape and can no longer bind starch), so no enzyme–substrate complexes form and no starch is hydrolysed; reducing-sugar content is none and starch is still present.
S1 – little hydrolysis (low KE, few ES complexes); S2 – much hydrolysis (near optimum KE, many ES complexes); S3 – no hydrolysis (enzyme denatured, active site no longer complementary to starch).
Background Concept
Enzyme activity is governed by two effects of temperature:
- Kinetic effect — as temperature rises, molecules have more kinetic energy, move faster and collide more often, so the rate of successful enzyme–substrate complex formation increases (up to the optimum).
- Denaturation effect — above a critical temperature the hydrogen and ionic bonds that hold the enzyme's tertiary structure together begin to break. The active site loses its specific shape, the substrate can no longer bind, and enzyme activity falls irreversibly to zero.
The shape of the rate–temperature curve therefore rises to an optimum (≈ 35–40 °C for most mammalian enzymes) and then falls steeply as denaturation takes over.
Understanding the Question
The candidate has to explain the reducing-sugar and starch results for all three samples in terms of these enzyme-kinetics ideas. The mark scheme offers any three of:
- S1 – enzyme hydrolyses some starch (because 0 °C is not cold enough to stop the reaction completely, just slow it down);
- S2 – enzyme hydrolyses some starch (in fact most of it, because 40 °C is near the optimum);
- S3 – enzyme does not hydrolyse starch (because it is denatured);
- comparison of the number of enzyme–substrate complexes;
- comparison of the amount of hydrolysis between samples.
Approach
For each tube, identify the dominant effect of temperature on amylase, link it to the rate of enzyme–substrate complex formation, and conclude how much starch is hydrolysed.
Step-by-Step Reasoning
- S1 (0 °C): molecules have very low kinetic energy, so collisions between amylase and starch are infrequent; only a small number of enzyme–substrate complexes form per second, so only a small amount of starch is hydrolysed. The Benedict's test gives a slow / small colour change (low reducing sugar) and the iodine test still detects starch (blue).
- S2 (40 °C): this is close to the optimum temperature for amylase; molecules have high kinetic energy but the enzyme is not yet denatured, so the maximum number of enzyme–substrate complexes forms per second. Most of the starch is hydrolysed, giving a fast colour change with Benedict's (high reducing sugar) and no starch detectable with iodine (brown).
- S3 (100 °C): the very high temperature disrupts the bonds maintaining the tertiary structure of amylase; the active site changes shape and can no longer bind the substrate. No enzyme–substrate complexes form, no starch is hydrolysed, the Benedict's test gives no colour change and iodine still gives blue.
- Comparative points — the rate of hydrolysis is slowest at 0 °C, fastest at 40 °C and zero at 100 °C, because the number of productive enzyme–substrate complexes follows the same order.
Key Takeaways
- Below the optimum, temperature limits the rate by limiting kinetic energy; above it, temperature destroys the enzyme's structure.
- An enzyme is a biological catalyst and the active site is shape-specific; once the shape is lost, the catalysis is lost too (and is not recovered by cooling).
- The amount of product (reducing sugar) and the amount of remaining substrate (starch) tell complementary stories about the same reaction.
Common Mistakes
- Saying "the enzyme is killed at 100 °C" or "the enzyme dies" — amylase is not alive, so use "denatured".
- Saying "the enzyme doesn't work at 0 °C because it is denatured by cold" — wrong; cold does not denature enzymes, it merely slows them down (the effect is reversible on warming).
- Confusing the kinetic and denaturation effects, for example attributing the slow reaction at 0 °C to denaturation rather than to low kinetic energy.
- Saying only that "the enzyme is denatured at 100 °C" without explaining what that means in terms of the active site.
Things to Be Careful About
The mark scheme accepts comparisons of the form "more ES complexes form in S2 than in S1" or "more starch is hydrolysed in S2 than in S1". Either phrasing scores, but the candidate should be specific about which two tubes are being compared.
U contains the products of the reaction between starch and amylase solution in a water-bath at an unknown temperature.
You need to:
- carry out the test for reducing sugars and the test for starch on U
- compare the results for U with the results for S1, S2 and S3
- estimate the temperature of the water-bath used for U.
Carry out step 12 and step 13.
step 12 Repeat the test for reducing sugars and the test for starch on U.
step 13 Record your results in (a)(vii).
Record the result of the test for reducing sugars for U.
time taken to first colour change = ______
Record the result of the test for starch for U.
colour = ______
Answer
- time taken to first colour change = __ s (representative value, e.g. 60)
- colour with iodine = __ (representative value, e.g. light blue / brown)
(Actual values depend on the candidate's own observation; the marking point is that a time and a colour are both recorded.)
record a time in s and a colour for U.
Background Concept
This is a single-step recording task: the candidate repeats the two tests on sample U and writes down what they see. The mark is awarded for the presence of a sensible time and a sensible colour in the answer lines, not for any particular numerical value (which depends on the unknown temperature at which U was prepared).
Understanding the Question
Sample U was prepared at some temperature the candidate does not know, and they have just carried out the Benedict's test (timed to first colour change) and the iodine test on it. They must record both observations.
Approach
Treat U exactly as S1, S2 and S3 were treated: time the Benedict's test (or record "more than 120" if no change is observed) and note the colour obtained with iodine. Write the answers in the spaces provided.
Step-by-Step Reasoning
- Benedict's test — start the stop-clock when U is placed in the bath with Benedict's, stop at the first appearance of a non-blue colour, write the time in seconds in the answer line. If no change within 120 s, write "more than 120".
- Iodine test — add 2 drops of iodine to a fresh 5 cm³ of U, shake gently and note the colour: blue means starch is still present, brown/yellow means little or no starch remains.
- The two results together constrain the unknown temperature. A short time and a brown iodine result suggest a temperature near 40 °C; a long time and a blue result suggest a temperature near 0 °C or near/above 100 °C.
Key Takeaways
Recording observations accurately and in the correct units is a basic practical skill; always write both the time and the colour, even if the colour is "no change" (record "blue" or "no change" — do not leave the line blank).
Common Mistakes
- Writing a dash or leaving the line blank when no colour change occurs.
- Recording the colour in the time line, or vice versa.
- Forgetting to include the unit s in the Benedict's answer.
Things to Be Careful About
The mark scheme credits a time and a colour for U. Either alone scores zero. The candidate's actual numerical value is not judged here — only the act of recording.
Use your results in (a)(iv) and (a)(vii) to estimate the temperature of the water-bath used for U.
temperature of water-bath = ______
Answer
- If U's Benedict's time is short (e.g. ≈ 25 s) and the iodine colour is brown, the temperature is around 40 °C (near the optimum for amylase).
- If U's Benedict's time is long (> 120 s) and the iodine colour is blue, the temperature is around 0 °C (low kinetic energy) or around/above 100 °C (enzyme denatured). A blue Benedict's solution throughout (no colour change) is the distinguishing feature of a denatured enzyme — choose 100 °C.
(Exact temperature depends on the candidate's own (a)(iv) and (a)(vii) observations. With the representative values above, the answer is 40 °C.)
40 °C (based on a Benedict's time comparable to S2 and a brown iodine colour indicating starch has been hydrolysed).
Background Concept
The three reference samples define a three-point calibration for the unknown:
- S1 (0 °C) — slow Benedict's (> 120 s), blue iodine;
- S2 (40 °C) — fast Benedict's (20–40 s), brown iodine;
- S3 (100 °C) — no Benedict's colour change, blue iodine.
The unknown U can be assigned to one of these three categories by matching its Benedict's time and iodine colour to the closest reference.
Understanding the Question
The candidate has to combine their results from (a)(iv) (the three known samples) with their result from (a)(vii) (U) to estimate the temperature of the water-bath in which U was prepared. The mark scheme expects an estimate consistent with the candidate's own data.
Approach
Compare U's two observations with the patterns in S1, S2 and S3. If U behaves like one of them, choose that temperature; if it is intermediate, give the nearer reference temperature.
Step-by-Step Reasoning
- U behaves like S2 (short Benedict's time, brown iodine) → temperature ≈ 40 °C.
- U behaves like S1 (long Benedict's time, blue iodine) → temperature ≈ 0 °C.
- U behaves like S3 (no Benedict's colour change, blue iodine) → temperature ≈ 100 °C (the denatured-enzyme case is distinguished from S1 only by the absence of any colour change in Benedict's — both give blue iodine, but S1 eventually changes colour while S3 never does).
- An intermediate (medium Benedict's time, light blue iodine) suggests a temperature between the reference points (e.g. 20 °C) and the candidate should estimate accordingly.
Key Takeaways
Interpreting an unknown condition from a calibration set of observations is a common Paper 3 / Paper 5 skill. The candidate should be explicit about which comparison supports which temperature, and should use their own data rather than a textbook ideal.
Common Mistakes
- Choosing 0 °C when U gives a short Benedict's time (this would be self-contradictory — short times indicate high enzyme activity, which is not seen at 0 °C).
- Choosing 100 °C when U gives any Benedict's colour change (denatured amylase cannot reduce Benedict's reagent at all).
- Giving a temperature outside the range 0–100 °C without justification.
Things to Be Careful About
The mark scheme credits an estimate that is consistent with the candidate's own results. There is no single "correct" answer; an estimate is judged against the data the candidate has recorded.
Describe how the student could obtain a quantitative estimate of the concentration of reducing sugar in a solution.
Answer
- Prepare at least five standard solutions of reducing sugar (e.g. glucose) of known concentration (e.g. by serial dilution of a stock solution).
- Carry out the Benedict's test on each standard under the same controlled conditions as in (a)(ii) — same volume of Benedict's, same heating temperature — and record the time taken to the first colour change for each.
- Carry out the same Benedict's test on the unknown sample under the same conditions, and record its time to the first colour change.
- Plot a calibration graph of known reducing-sugar concentration (x-axis) against time to first colour change (y-axis).
- Read the unknown's time off the calibration graph to obtain the concentration of reducing sugar in the unknown sample.
Prepare ≥ 5 reducing-sugar standards of known concentration, time each with Benedict's under the same conditions, plot a graph of concentration against time, and read off the unknown.
Background Concept
The Benedict's test in (a)(ii) is only semi-quantitative — it gives a rank (low / medium / high) based on time. To obtain an actual concentration, the time must be compared with a calibration curve built from solutions of known concentration. Because the time is inversely related to the concentration of reducing sugar, the standard curve is monotonic and can be read in either direction.
Understanding the Question
The candidate is asked to describe how the qualitative procedure of (a)(ii) could be converted into a procedure that returns an actual concentration of reducing sugar (in, e.g., mol dm⁻³ or g dm⁻³). The mark scheme accepts any four of six ideas:
- at least five known concentrations of reducing sugar;
- Benedict's test and time for first colour change for each known concentration;
- test the unknown sample with Benedict's;
- compare the unknown's time with the times for the knowns;
- draw a calibration graph of known concentration against time;
- read off the unknown's concentration from the graph.
Approach
Think of it as a calibration: prepare a set of standards covering the expected range, run the same test on every one, plot a graph, and read the unknown off the line.
Step-by-Step Reasoning
- Standards — at least five solutions of reducing sugar (typically glucose or maltose) of accurately known concentration, prepared by serial dilution from a stock. Five is the conventional minimum so that the calibration line is well supported; ideally the standards should bracket the unknown's concentration.
- Same controlled procedure — every standard and the unknown must be tested under identical conditions: the same volume of Benedict's reagent, the same volume of sample, the same temperature of the water-bath, the same observer judging the end-point. Any change in these variables invalidates the comparison.
- Record the time to the first colour change for each standard. The shorter the time, the higher the concentration; a graph of concentration (x) against time (y) is therefore drawn.
- Draw a smooth curve of best fit through the standard points. Do not join them dot-to-dot; the data are subject to small random errors in the end-point judgement.
- Run the unknown under the same conditions and read its time on the calibration curve to find the corresponding concentration. Interpolate between the standard points if the unknown's time falls between two of them.
Key Takeaways
A semi-quantitative test can be turned into a quantitative one by calibration against standards. The standards, the unknown and the procedure must all be matched. The standard graph of concentration against time is the link between the two.
Common Mistakes
- Using only one or two standards — too few to define a curve.
- Using different volumes of Benedict's for the standards and the unknown — the rate is affected by the Cu²⁺ concentration.
- Plotting time on the x-axis and concentration on the y-axis — the calibration works either way mathematically, but the CIE convention is to plot the independent variable (concentration) on the x-axis.
- Forgetting to read the unknown from the graph — calculating a concentration from a formula rather than from the graph itself.
Things to Be Careful About
The time to first colour change is inversely related to the reducing-sugar concentration, so the calibration curve falls from upper-left to lower-right. The candidate should describe "read off the unknown from the graph" rather than "calculate the concentration from a formula", because the relationship is not strictly linear.
A student investigated the effect of temperature on the action of an enzyme that digests protein.
The results are shown in Table 1.3.
Table 1.3
| temperature / | rate of reaction / arbitrary units |
|---|---|
| 20 | 8 |
| 25 | 46 |
| 30 | 74 |
| 40 | 59 |
| 45 | 42 |
Plot a graph of the data in Table 1.3 on the grid in Fig. 1.2.
Use a sharp pencil.

Fig. 1.2
Answer
Axes and labels
- x-axis: temperature / °C, with 20 at the origin; scale of 5 °C per 2 cm; labels every 2 cm (e.g. 20, 25, 30, 35, 40, 45).
- y-axis: rate of reaction / au, starting at 0; scale of 20 au per 2 cm; labels every 2 cm (e.g. 0, 20, 40, 60, 80).
Points to plot
- (20, 8), (25, 46), (30, 74), (40, 59), (45, 42), each marked with a small cross or a dot inside a circle.
Line
- A thin smooth curve passing through (or very close to) all five points; the curve rises from (20, 8) to a maximum at (30, 74) and then falls through (40, 59) and (45, 42).
See graph — five points plotted on correctly-scaled axes and joined with a thin smooth curve through all points.
Background Concept
A correctly drawn scientific graph obeys a number of conventions:
- the independent variable is on the x-axis, the dependent variable on the y-axis;
- each axis is labelled with the quantity and its unit (separated by a slash, e.g.
temperature / °C); - the scale is chosen so the data occupy at least half the grid in both directions;
- the scale is "non-awkward" — i.e. each major division is a multiple of 1, 2 or 5 of the unit;
- every major division (every 2 cm) is labelled with its numerical value;
- each data point is plotted precisely (a small cross or a dot in a circle) using a sharp pencil;
- the points are joined with a thin line — straight line segments for a continuous relationship, or a smooth curve where the data clearly curve.
Understanding the Question
The candidate is given five (temperature, rate) pairs and a blank grid. The grid in Fig. 1.2 is roughly 30 small squares wide and 20 small squares tall (so each 2 cm corresponds to 10 small squares). They must produce a graph that obeys the conventions above and that correctly represents the data. The data show a clear maximum at 30 °C — the points rise from 8 at 20 °C to 74 at 30 °C, then fall to 42 at 45 °C — so the points must be joined with a smooth curve, not a straight line.
Approach
- Choose the scale first. The x-axis range needed is 20–45 °C (5 intervals of 5 °C); with 5 °C per 2 cm, that needs 10 cm and fits comfortably in the 30-square-wide grid. The y-axis range needed is 0–80 au (4 intervals of 20 au); with 20 au per 2 cm, that needs 8 cm and fits in the 20-square-tall grid.
- Label every 2 cm (every 5 °C on the x-axis; every 20 au on the y-axis).
- Plot the five points carefully.
- Join with a thin smooth curve through (or very close to) all five points.
Step-by-Step Reasoning
- Independent variable on x-axis — temperature (the variable deliberately changed by the experimenter).
- Dependent variable on y-axis — rate of reaction (the variable measured).
- Scale on x-axis — 5 °C to 2 cm, with 20 °C at the origin. The first label is therefore 20, the next 25, then 30, 35, 40, 45. Every 2 cm (every 5 °C) is labelled.
- Scale on y-axis — 20 au to 2 cm, starting at 0. Labels are 0, 20, 40, 60, 80. Every 2 cm (every 20 au) is labelled.
- Points — (20, 8), (25, 46), (30, 74), (40, 59), (45, 42). Each point is shown as a small cross or a dot in a circle, drawn with a sharp pencil.
- Line — the rate rises with temperature up to about 30 °C and then falls as the enzyme begins to denature, so the points must be joined with a smooth curve, not with straight line segments. The line should be thin (drawn with a sharp pencil) and should pass through (or very close to) every plotted point.
Key Takeaways
- Choose a non-awkward scale (1, 2 or 5 of the unit per major division) so the values are easy to read off.
- Place the lowest data value at, or just above, the origin on the y-axis; do not "stretch" the y-axis by starting at a value close to the lowest data point.
- Use a smooth curve where the underlying relationship is curved; this question's data are clearly curved (a rise and a fall), so a curve is required.
- Plot every data point — there are no missing values here.
Common Mistakes
- Putting rate on the x-axis and temperature on the y-axis (reversing the IV and DV).
- Forgetting the unit in the axis label (e.g. writing just
temperatureinstead oftemperature / °C). - Choosing an awkward scale such as 7 °C per 2 cm, which makes plotting hard.
- Joining the points with straight line segments when the data are clearly curved.
- Drawing a bar chart instead of a line graph for continuous data.
- Not labelling the axes at all.
Things to Be Careful About
The mark scheme explicitly requires:
- x-axis:
temperature / °Cand y-axis:rate of reaction / au; - x-scale: 5 °C to 2 cm with 20 at the origin, labelled every 2 cm;
- y-scale: 20 au to 2 cm, labelled every 2 cm;
- all five points correctly plotted;
- a thin line passing through all points.
All four marks are lost if any one of these is missed.
M1 is a slide of a stained transverse section through a leaf.
Draw a large plan diagram of the whole section on M1.
Use a sharp pencil.
Use one ruled label line and label to identify the palisade tissue.
Answer
Draw a large plan diagram of the whole transverse section on M1, filling at least half of the answer space.
The diagram must show:
- the outline of the entire leaf section, with a large bulge on the upper epidermis in the centre (the midrib)
- a continuous band of palisade tissue drawn immediately beneath the upper epidermis, on either side of the midrib
- the vascular bundle as a single oval/elongated outline inside the midrib bulge
- the lower epidermis as a single line following the lower contour of the leaf
- NO individual cells drawn anywhere
- NO shading, hatching or stippling
- ONE ruled label line that ends precisely on the palisade tissue, with the text palisade tissue at the outer end
Plan diagram of the whole leaf section with correct proportions, no cells, no shading, and the palisade tissue labelled.
Background Concept
A plan diagram is a low-power, low-detail outline drawing that records the overall organisation and proportions of tissues in a microscope specimen. It deliberately omits cellular detail so the structural pattern can be read at a glance. The conventions are strict and ARE the marks awarded by examiners:
- Use a sharp HB pencil.
- Continuous, clean lines (no sketchy or broken outlines).
- NO shading, hatching or stippling of any kind.
- NO individual cells drawn — only the boundaries between tissues.
- Correct relative proportions (e.g. the palisade strip should be visibly thicker than the epidermis, the vascular bundle should not be drawn as a perfect circle if it is oval).
- Large size — at least half of the answer space provided.
- A ruled label line that ends exactly on the labelled structure, with the label text written at the outer end, no arrowhead, never crossing any other line.
A typical dicotyledonous leaf transverse section shows, from top to bottom:
- upper epidermis (single layer of cells, often with a cuticle on its outer face)
- palisade mesophyll (one or more layers of tall, column-shaped cells packed with chloroplasts)
- spongy mesophyll (loosely packed cells with large air spaces)
- lower epidermis (often containing stomata with guard cells)
- vascular bundle(s) embedded in the mesophyll — a central midrib bundle is the largest
Understanding the Question
Slide M1 is a stained transverse section through a leaf. You are asked to draw a plan diagram of the WHOLE section (every layer from upper to lower epidermis, including the midrib region) and to add ONE label line that points to the palisade tissue. The drawing must be large, drawn with a sharp pencil, and follow plan-diagram conventions.
The mark scheme awards five marks for:
- minimum size AND no shading
- whole leaf section drawn AND no cells drawn
- correct shape of palisade tissue
- correct shape of vascular bundle
- label line AND label to palisade tissue
Approach
- Place M1 on the microscope stage and use the LOWEST power objective so the entire transverse section fits in the field of view.
- Identify the upper epidermis, palisade mesophyll, spongy mesophyll, vascular bundle and lower epidermis.
- Sketch the outer outline first, paying attention to the large bulge on the upper epidermis that marks the midrib.
- Mark the inner boundary of the upper epidermis, then the inner edge of the palisade layer (so the palisade appears as a clearly bounded strip), then the outline of the vascular bundle inside the midrib bulge, then the lower epidermis.
- Check proportions: palisade ≈ twice the thickness of epidermis; vascular bundle oval/elongated, central in the leaf thickness.
- Rule ONE label line from outside the drawing to the palisade strip and write palisade tissue at the outer end.
- Final check: no shading, no individual cells, no extra labels.
Step-by-Step Reasoning
Each mark scheme point maps directly to a feature of the drawing:
- Minimum size + no shading → fill at least half the answer box; do not hatch or scribble inside any tissue.
- Whole leaf + no cells → the outer outline must enclose every tissue layer present, and the lines you draw must show tissue boundaries only — never individual brick-shaped cells inside the palisade band.
- Correct shape of palisade → an unbroken strip immediately below the upper epidermis, with a flat lower edge, interrupted only by the midrib bulge.
- Correct shape of vascular bundle → an oval or elongated outline embedded inside the midrib bulge, near the centre of the leaf thickness; NOT a perfect circle.
- Label line → a single straight (ruled) line ending exactly on the palisade strip, with the words 'palisade tissue' written neatly at the outer end. The line must not cross any other structure or any other label line, and must have no arrowhead.
Key Takeaways
- A plan diagram records tissue outlines and their proportions, never cellular detail.
- Drawing conventions (no cells, no shading, sharp continuous lines, correct proportions, large size) ARE the marks.
- A label line must be ruled, must end exactly on the labelled structure, must not cross other lines, and must not have an arrowhead.
Common Mistakes
- Drawing individual cells inside the palisade band (this breaks the 'no cells' rule).
- Adding shading, hatching or stippling of any kind.
- Drawing the vascular bundle as a perfect circle when it is actually oval or elongated.
- Letting the label line cross other parts of the diagram or have several lines crossing each other.
- Drawing too small — if your diagram fits in less than half of the answer space, you lose the size mark.
Things to Be Careful About
- Always observe at the lowest-power objective first when drawing a plan diagram.
- The label line must end EXACTLY on the structure, with no gap and no arrowhead.
- Check the shape of the vascular bundle carefully — it is usually oval or lens-shaped, not circular.
- Use a sharp HB pencil so lines are crisp; smudged or fuzzy lines will be penalised.
Observe the upper epidermis of the leaf on M1 and the layer of cells beneath it. The large bulge on the mid-rib is located on the upper epidermis.
Select a group of four adjacent cells. This group must include two cells from the epidermis and two cells from below the epidermis.
Each cell must touch at least two of the other cells.
- Make a large drawing of this group of four cells.
- Use one ruled label line and label to identify a chloroplast in one cell.
Use a sharp pencil.
Answer
Draw a large group of four adjacent cells, filling at least half of the answer space.
The drawing must show:
- TWO cells from the upper epidermis (top of the drawing): roughly rectangular / brick-shaped, with NO chloroplasts visible inside
- TWO cells from the palisade layer directly below (bottom of the drawing): taller, column-shaped, with chloroplasts visible inside
- the cells arranged so that EACH cell touches at least TWO of the other cells (a 2×2 grid works)
- double-line cell walls (2 lines around each cell, 3 lines where cells touch)
- chloroplasts drawn as small ovals only inside the two palisade cells
- ONE ruled label line ending precisely on a chloroplast in a palisade cell, with the text chloroplast at the outer end
Large drawing of four cells (two upper epidermis, two palisade) in a 2×2 arrangement, with double-line walls, three lines where cells meet, chloroplasts in the palisade cells, and one chloroplast labelled.
Background Concept
A high-power cell drawing is a detailed drawing of a small number of cells viewed through the microscope at high magnification. Unlike a plan diagram, it shows individual cells and any visible internal structures. The conventions are again strict and ARE the marks:
- Sharp HB pencil.
- Continuous, clean lines — no sketchy or broken outlines.
- Each cell drawn with a DOUBLE LINE for its wall (representing cell wall + cell membrane as a clear boundary).
- Where two cells touch each other, THREE lines are drawn: the wall of cell A, then the wall of cell B, with the shared middle line between them.
- Only structures actually visible through the microscope should be drawn — never invent.
- Correct relative shapes and proportions of the cells.
- Large size — at least half of the answer space.
- A ruled label line ending on the labelled structure with the text at the outer end, never with an arrowhead.
In a typical dicotyledonous leaf:
- Upper epidermal cells are roughly rectangular / brick-shaped in transverse section and lack chloroplasts (they are transparent so light can pass through to the photosynthetic mesophyll below).
- Palisade mesophyll cells directly below the epidermis are taller than wide (column-shaped) and packed with chloroplasts — this is the main site of photosynthesis.
Understanding the Question
You must select a group of FOUR adjacent cells on M1 that includes TWO cells from the upper epidermis and TWO cells from the layer immediately beneath it (the palisade). Every cell in the group must touch at least TWO of the others. You must draw the group at high power, show chloroplasts where they are visible, and add one ruled label to a chloroplast.
The mark scheme awards six marks for:
- minimum size AND all lines sharp and continuous
- two cells from the upper epidermis + two from below the epidermis + each cell touches at least two others
- two lines around each cell AND three lines where cells touch
- correct shape AND size of cells
- chloroplasts drawn in the palisade cells
- label line AND label to a chloroplast
Approach
- Use the HIGH power objective. Locate the upper epidermis and identify the palisade layer directly beneath it.
- Pick two adjacent upper epidermis cells and two adjacent palisade cells directly below them so that every cell touches at least two others (a 2×2 grid is the simplest arrangement).
- Sketch lightly first to check the layout, then draw the final version with sharp continuous lines.
- Draw each cell as a closed shape with a DOUBLE-LINE wall.
- Where two cells meet, draw THREE lines (the wall of one cell, then the wall of the next, with the shared boundary between them).
- Inside the two palisade cells, add small oval chloroplasts. Do NOT add chloroplasts to the upper epidermis cells.
- Rule ONE label line from outside the drawing to a chloroplast in a palisade cell and write chloroplast at the outer end.
Step-by-Step Reasoning
Each mark scheme point maps to a feature of your drawing:
- Size + clean lines → fill at least half the answer box; lines must be continuous (no dashes or sketchy lines).
- Correct cells + touching → top row: two epidermis cells; bottom row: two palisade cells. In a 2×2 grid each cell touches its horizontal and vertical neighbours, so the 'at least two touching' rule is satisfied.
- Wall conventions → every cell has a double-line wall; where two cells touch, the walls are drawn slightly apart so you see THREE visible lines (cell A wall, boundary, cell B wall).
- Correct shape AND size → upper epidermis cells should look roughly square/rectangular (brick-like); the palisade cells below should look distinctly TALLER than wide (column-shaped). The relative sizes must match what you see down the microscope.
- Chloroplasts in palisade → small ovals inside the bottom two cells only. NEVER put chloroplasts in the upper epidermis cells.
- Label → a single ruled line ending exactly on a chloroplast, with the word 'chloroplast' written at the outer end.
Key Takeaways
- High-power drawings require DOUBLE-LINE cell walls and the special THREE-LINE convention where cells meet.
- Upper epidermis cells are transparent (no chloroplasts); palisade cells below are packed with chloroplasts.
- Only structures actually visible through the microscope should be drawn — never invent.
- Plan your 2×2 layout before drawing so the 'each touches at least two' rule is satisfied.
Common Mistakes
- Drawing single-line cell walls instead of double lines.
- Drawing only TWO lines where cells touch instead of THREE.
- Putting chloroplasts in the upper epidermis cells (they have none).
- Making the palisade cells the same shape as the epidermis cells — palisade cells should be distinctly taller (column-shaped).
- Drawing the four cells in a single row rather than in a 2×2 arrangement, so some cells touch only one other.
- Adding an arrowhead to the label line.
Things to Be Careful About
- Check that each cell actually touches at least TWO of the others before you start drawing.
- Use a sharp HB pencil and a ruler for the label line.
- The label line must end exactly on a chloroplast, with no gap.
- Do not shade the cells — leave them clear so the chloroplasts inside are visible.
Fig. 2.1 is a photomicrograph of a stained transverse section of a different leaf from M1.
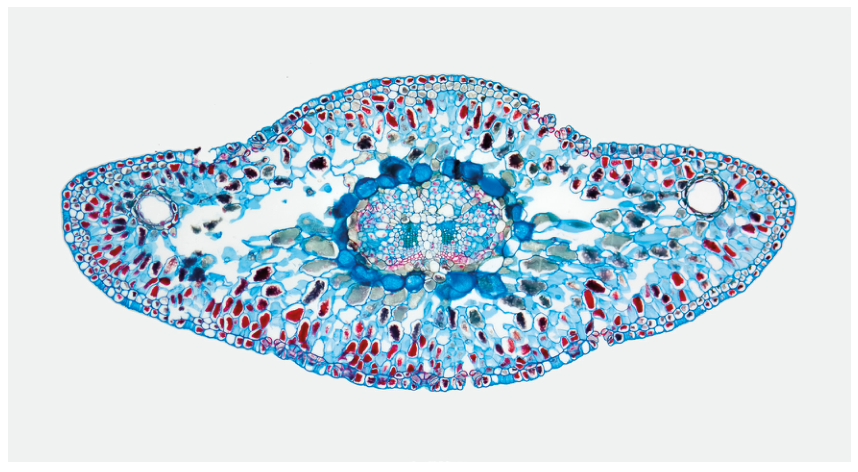
Fig. 2.1
Identify three observable differences, other than colour, between the leaf section on M1 and the leaf section in Fig. 2.1.
Record these three observable differences in Table 2.1.
Table 2.1
| feature | M1 | Fig. 2.1 |
|---|---|---|
Answer
| feature | M1 | Fig. 2.1 |
|---|---|---|
| position of palisade tissue | beneath upper epidermis only | beneath both upper and lower epidermis |
| large bulge on upper epidermis | present | absent |
| shape of vascular bundle | flat / elongated | oval / rounded |
Three observable differences recorded in Table 2.1: position of palisade tissue, presence of a midrib bulge on the upper epidermis, and shape of the vascular bundle.
Background Concept
When comparing two microscope specimens, the comparison must be based only on what is actually VISIBLE through the microscope. Statements about cause, function, or classification ('it is a monocot', 'it is adapted to drought') cannot earn a mark unless the visible feature that supports the inference is also stated.
Each row of a comparison table should:
- name a single OBSERVABLE feature (shape, position, presence/absence, count, relative size)
- describe the appearance of that feature in each specimen
- avoid colour (which is excluded by the question)
- use comparative language so the contrast is unambiguous
In a leaf transverse section, observable features that often vary between species include:
- presence/absence of a midrib bulge on the epidermis
- thickness of the lamina (overall leaf thickness)
- shape of the vascular bundle(s) — round, oval, flat/elongated
- position of the palisade tissue — upper only, lower only, or both surfaces
- number of palisade layers
- presence/absence of an obvious cuticle
Understanding the Question
You have slide M1 (a leaf transverse section you observe down the microscope) and Fig. 2.1 (a printed photomicrograph of a different leaf). You must record THREE observable differences, excluding colour, between them in Table 2.1. Each mark is for one correct, observable, contrasting pair.
Approach
- Observe M1 at low power first, then at higher power if needed.
- Look at the upper epidermis — is there a clear bulge (midrib) or is the upper surface smooth?
- Identify the palisade tissue. Is it only on the upper side, only on the lower side, or on both?
- Look at the vascular bundle(s). Are they round, oval, or flat/elongated?
- Compare each feature with what you see in Fig. 2.1 and write a short, observable contrast in each row of the table.
Step-by-Step Reasoning
Three observable differences that work well here:
- Palisade tissue position — on M1 the palisade mesophyll is only present beneath the upper epidermis; in Fig. 2.1 palisade-like tissue is clearly visible beneath BOTH the upper and lower epidermis.
- Midrib bulge — M1 has a clear large bulge on the upper epidermis where the midrib sits; Fig. 2.1 has a smooth upper epidermis with no such bulge.
- Vascular bundle shape — on M1 the vascular bundle is drawn as flat / elongated; in Fig. 2.1 it is clearly oval / rounded.
- Lamina thickness — M1 lamina is thinner; Fig. 2.1 lamina is thicker.
The mark scheme accepts any three observable, contrasting features. Avoid vague statements like 'shape is different' — always name the feature and describe BOTH sides in the row.
Key Takeaways
- Comparisons must be OBSERVABLE, not functional or causal.
- Each row of the table should contrast a single named feature.
- Never include colour when the question excludes it.
- Choose differences that are clear and unambiguous, not borderline.
Common Mistakes
- Writing 'M1 is bigger' — this is too vague without saying which dimension (lamina thickness, overall area, etc.).
- Writing inferences instead of observations: 'M1 is a dicot' is not observable unless you also state the visible feature that supports it (e.g. 'vascular bundles arranged in a ring' or 'reticulate venation').
- Including colour, which is explicitly excluded.
- Repeating the same feature in different words across the three rows.
Things to Be Careful About
- Stick to what you can SEE in each specimen.
- Use precise, named features rather than vague 'shape' or 'size'.
- Make sure each row of the table has a contrasting statement for BOTH M1 AND Fig. 2.1.
Fig. 2.2 is the same photomicrograph as that shown in Fig. 2.1.
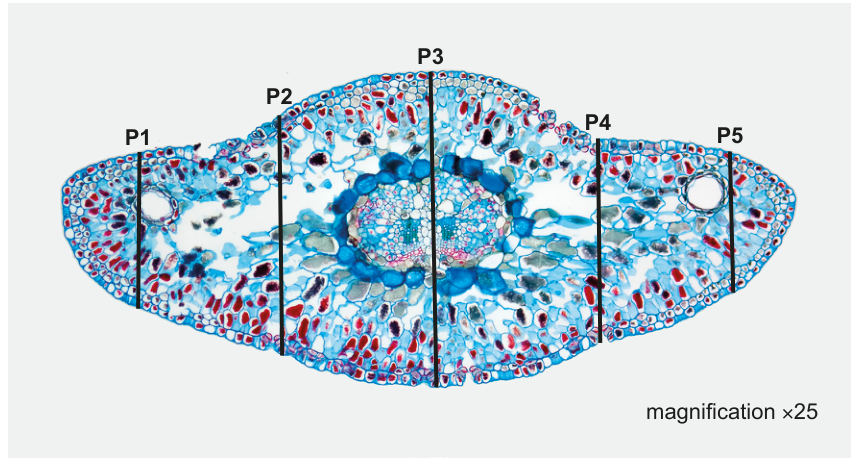
Fig. 2.2
Measure the thickness of the leaf using the lines P1, P2, P3, P4 and P5 in Fig. 2.2 and calculate the mean length of the lines.
Show your working, including units.
mean length of lines = ______
Using the magnification and the mean length of lines, calculate the actual mean thickness of the leaf.
actual mean thickness = ______
Working
Measure each line in millimetres with a ruler. (Representative values shown — your measurements will depend on the printed copy of Fig. 2.2 you are given.)
Add the five values and divide by five to obtain the mean image length:
The magnification of the photomicrograph is ×25. Divide the mean image length by the magnification to obtain the actual mean thickness of the leaf:
Answer
; ; ; ;
mean length of lines
actual mean thickness
P1 = 24 mm, P2 = 35 mm, P3 = 45 mm, P4 = 35 mm, P5 = 24 mm; mean length = 32.6 mm; actual mean thickness = 1.3 mm.
Background Concept
A photomicrograph is a photograph taken through a microscope. It carries a magnification label (here ×25) that tells you how many times larger the printed image is than the actual specimen. The fundamental relationship is:
So to recover the actual size of the specimen from a measurement taken on the printed image, you divide the image size by the magnification:
Units must be carried consistently. If you measure the image in millimetres (mm) and the magnification is a pure number (×25), the actual size is also in mm. You can convert to micrometres (1 mm = 1000 µm) if a smaller unit is more appropriate.
Taking the mean of several measurements reduces the effect of random error and gives a more reliable estimate than a single reading. The leaf thickness varies across the section (it is greatest through the midrib and thinnest at the edges), so the mean gives a representative thickness.
Understanding the Question
You are given a photomicrograph (Fig. 2.2) of a leaf transverse section with FIVE vertical lines P1–P5 drawn across the leaf at different positions. Each line measures the thickness of the leaf at that point. The magnification of the photomicrograph is ×25 (shown in the corner of Fig. 2.2).
You must:
- Measure each of P1–P5 in mm and record the five values.
- Calculate the mean of the five measurements.
- Use the mean and the magnification to calculate the actual mean thickness of the leaf.
The three marks are for:
- correct measurements of all five lines, with units
- showing addition AND division by five
- showing division by the magnification
Approach
- Place a clear ruler along each line P1–P5 and read the length in mm, to the nearest mm.
- Record all five measurements on the answer lines.
- Add the five values and divide by five to get the mean.
- Divide the mean image length by the magnification (×25) to get the actual mean thickness.
- Quote the actual thickness with the correct unit (mm or µm).
Step-by-Step Reasoning
Using representative measurements from the photomicrograph (P3, through the midrib, is the longest; P1 and P5, at the edges, are the shortest):
Mean:
Actual mean thickness (using magnification = ×25):
You could also express this as ≈ 1300 µm. The mark scheme accepts any equivalent correct value.
Note: the marks are for the PROCESS (correct measurements with units, sum ÷ 5, ÷ magnification), so the exact numerical values depend on the candidate's printed copy of Fig. 2.2.
Key Takeaways
- magnification = image size ÷ actual size, so actual size = image size ÷ magnification.
- Always quote units with measurements and with the final answer.
- Show ALL working: addition, division by 5, division by magnification.
- The mean of several measurements is more reliable than a single measurement.
Common Mistakes
- Forgetting the units (mm) on the measured values.
- Dividing the wrong way (multiplying by 25 instead of dividing by 25).
- Not showing working — just writing the final answer.
- Recording only one or two of the lines, missing marks for incomplete data.
- Adding a unit conversion error (e.g. converting mm to µm and then forgetting which units are being divided).
Things to Be Careful About
- Use the SAME units throughout. If you measure in mm, keep mm until the very end.
- Read each line carefully — P3 (through the midrib) is the longest, P1 and P5 (at the edges) are the shortest.
- Quote the actual thickness to a sensible number of significant figures (e.g. 1.3 mm, not 1.304 mm).
- Check that you have divided by the magnification (25), not by 250 or 2.5.