Biology 9700/33 — October/November 2024
Cambridge AS Level · Advanced Practical Skills · worked solutions for every part, with the mark scheme
Topics Analysis, Conclusions and Evaluation · Manipulation, Measurement and Observation · Presentation of Data and Observations · Use of the Light Microscope
Plant cells produce the enzyme catalase that catalyses the hydrolysis (breakdown) of hydrogen peroxide into water and oxygen, as shown in Fig. 1.1.

A cylinder of potato tissue will have catalase molecules on its surface.
When potato tissue is put into hydrogen peroxide solution, oxygen bubbles are released and a foam forms at the surface of the hydrogen peroxide solution.
You will investigate the effect of ethanol concentration on the activity of catalase by measuring the height of the foam.
You are provided with the materials shown in Table 1.1.
Table 1.1
| labelled | contents | hazard | volume / |
|---|---|---|---|
| H | hydrogen peroxide solution | harmful irritant | 40 |
| W | water | none | 200 |
| E | 100% ethanol | flammable | 80 |
| P | 5 potato cylinders | none | — |
If any of H comes into contact with your skin, wash off immediately with cold water.
It is recommended that you wear suitable eye protection.
Carry out step 1 to step 7.
step 1 Put the five potato cylinders onto a white tile or cutting surface and cut each cylinder to a length of .
step 2 Label a beaker 0 and put of W into this beaker.
step 3 Put one potato cylinder into the beaker labelled 0. Start timing and leave for 5 minutes.
step 4 Label one test-tube 0.
step 5 After 5 minutes (step 3), remove the potato cylinder from the beaker labelled 0 and put it into the test-tube labelled 0.
step 6 Put of hydrogen peroxide solution into this test-tube. Immediately start timing.
step 7 Measure and record the height of the foam at 1 minute and at 2 minutes.
height of foam at 1 minute ______
height of foam at 2 minutes ______
The length of the potato cylinders may not be precisely .
Identify one other source of error in the procedure you have carried out.
Answer
Measuring the height of the foam (subjective, with no sharp boundary between foam and air, and difficult to read against a test-tube).
Measuring the height of the foam
Background Concept
In any practical investigation, "error" means anything that makes a measurement unreliable. It can be random (variation between repeats from small uncontrollable factors) or systematic (a consistent flaw in the apparatus or procedure). A creditable "source of error" answer is a specific, concrete step that visibly affects the data, not a vague phrase like "human error".
In this experiment catalase on the surface of the potato cylinder hydrolyses hydrogen peroxide, releasing oxygen that accumulates as foam. The height of that foam is used as a proxy for enzyme activity.
Understanding the Question
The stem says the length of the potato cylinders may not be precisely 4 cm and asks for ONE other source of error in the procedure. The procedure has been carried out, so the candidate must think about what they actually did and what could realistically be wrong with it.
Approach
Look for a step where the result depends on a subjective judgement or imprecise measurement, and name that step clearly. Avoid vague generalisations. The mark scheme credits only one specific answer for this item, so give that answer cleanly.
Step-by-Step Reasoning
The mark scheme answer is measuring the height of the foam. Why this is a real source of error:
- The foam/air boundary is not a sharp line; the foam is uneven and slopes at the edges.
- A ruler held against a curved test-tube is hard to read; parallax is easy.
- Different students would record slightly different values for the same foam.
- It introduces random error to every repeat.
Other flaws that exist in the procedure (e.g. volume of H not being exactly 5 cm³, potato cylinders of different initial enzyme content) are also real, but the mark scheme credits only the named answer above.
Key Takeaways
- A specific error must name the measurement AND say why it is unreliable.
- Vague "human error" is rejected by CIE.
- One sentence is enough for a 1-mark "identify one" item.
Common Mistakes
- Writing "human error" — too vague, rejected.
- Writing "the cylinders are different sizes" — too generic and overlaps with the length issue already given.
- Listing several errors when only one is asked for — wastes time and may dilute the specific credit.
Things to Be Careful About
- The question says "one other", so a single, specific answer is required.
- The mark is for the named flaw, not for a long paragraph.
You will investigate the effect of different concentrations of ethanol on catalase activity.
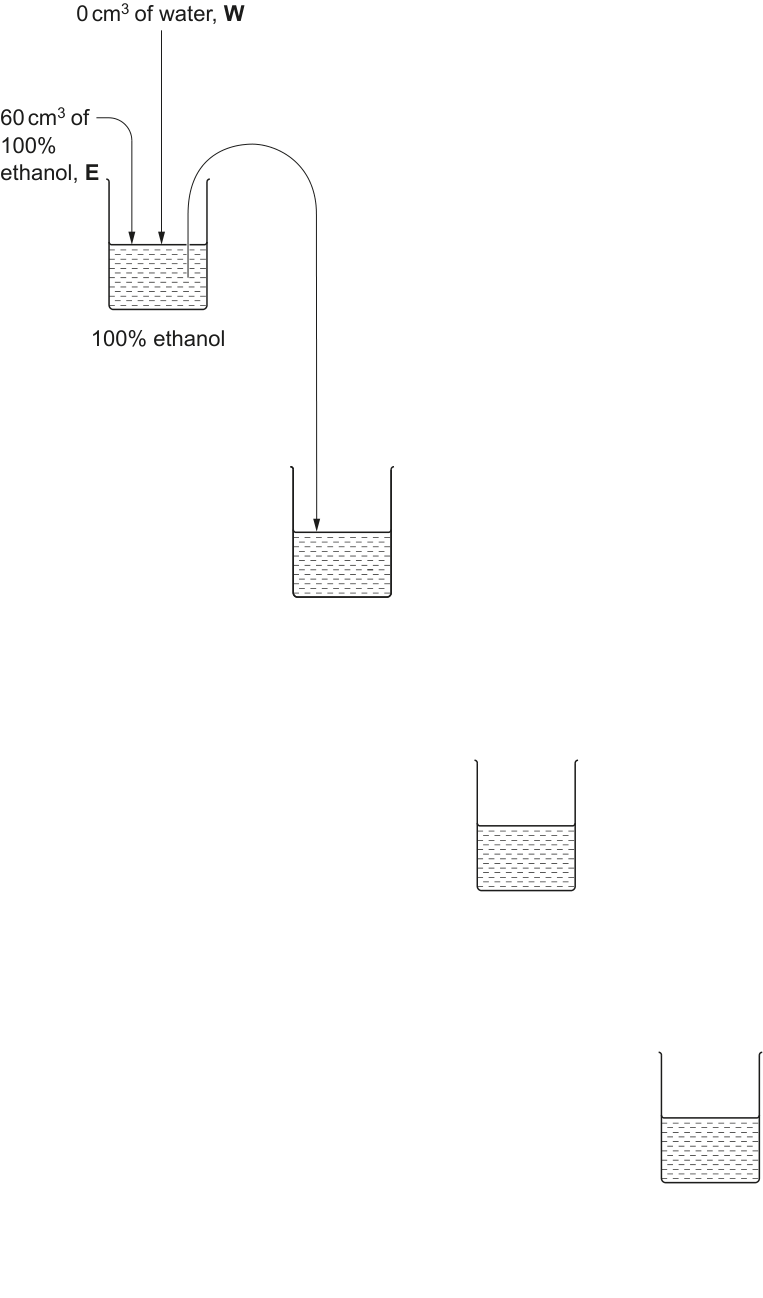
You will need to carry out a serial dilution of the 100% ethanol, E, to reduce the concentration by half between each successive dilution.
You will need to prepare three concentrations of ethanol in addition to the 100% ethanol, E.
After the serial dilution is completed, you will need to have of each concentration available to use.
Complete Fig. 1.2 to show how you will prepare your serial dilution.
Each beaker should have:
- a labelled arrow to show the volume of ethanol transferred
- a labelled arrow to show the volume of distilled water, W, added
- a label under the beaker to show the concentration of ethanol.
Answer
Complete Fig. 1.2 with three further beakers (50%, 25%, 12.5%):
| Beaker | Ethanol transferred from previous beaker | Water (W) added | Concentration |
|---|---|---|---|
| 1 (given) | — (60 cm³ of 100% E added directly) | 0 cm³ | 100% |
| 2 | 30 cm³ | 30 cm³ | 50% |
| 3 | 30 cm³ | 30 cm³ | 25% |
| 4 | 30 cm³ | 30 cm³ | 12.5% |
Beakers labelled 50%, 25% and 12.5%, each with a 30 cm³ transfer arrow from the previous beaker and a 30 cm³ of W arrow.
Background Concept
A serial dilution progressively halves the concentration at each step by transferring a fixed volume from one container to the next and making the volume back up with solvent. Because each transfer carries only half of the previous concentration, the resulting concentrations form a geometric series (e.g. 100%, 50%, 25%, 12.5%…).
The dilution factor at each step is:
For the dilution factor to be 1/2, transfer volume must be half the total. Here, total = 60 cm³ and transfer = 30 cm³, giving 30/60 = 1/2.
Understanding the Question
The candidate is given a partially completed Fig 1.2 (beaker 1 with 60 cm³ of 100% ethanol E and 0 cm³ of water W; a curved transfer arrow already pointing into beaker 2). They must complete beakers 2, 3 and 4 with:
- A labelled arrow for the volume of ethanol transferred (30 cm³ from the previous beaker)
- A labelled arrow for the volume of water W added (30 cm³)
- A concentration label under each beaker
The aim is to end with 30 cm³ available in each beaker (the question states "30 cm³ of each concentration available to use").
Approach
Decide the total volume in each beaker. To leave 30 cm³ behind AND transfer 30 cm³ away, each beaker needs a total of 60 cm³. Apply the same rule at every step: take 30 cm³ from the previous beaker, add 30 cm³ of water, label with the halved concentration. Walk through the concentrations to confirm: 100% → 50% → 25% → 12.5%.
Step-by-Step Reasoning
| Step | From previous beaker | Water W added | Total | Concentration |
|---|---|---|---|---|
| 1 (already drawn) | — (60 cm³ of 100% E added) | 0 cm³ | 60 cm³ | 100% |
| 2 | 30 cm³ | 30 cm³ | 60 cm³ | 50% |
| 3 | 30 cm³ | 30 cm³ | 60 cm³ | 25% |
| 4 | 30 cm³ | 30 cm³ | 60 cm³ | 12.5% |
Why each concentration halves:
- Beaker 2 receives 30 cm³ of pure ethanol + 30 cm³ of water → ethanol is now 30/60 = 50% of the mix.
- Beaker 3 receives 30 cm³ of 50% ethanol + 30 cm³ of water → ethanol is now 15 cm³ out of 60 cm³ = 25%.
- Beaker 4 receives 30 cm³ of 25% ethanol + 30 cm³ of water → ethanol is now 7.5 cm³ out of 60 cm³ = 12.5%.
Labels to add to Fig 1.2 on beakers 2, 3 and 4:
- Curved transfer arrow from the previous beaker: 30 cm³
- Vertical arrow into the beaker: 30 cm³ of water, W
- Label below the beaker: 50% ethanol, 25% ethanol, 12.5% ethanol respectively.
Key Takeaways
- Serial dilution by halves: transfer half the volume, top up with the same volume of diluent (water here).
- For each beaker to retain 30 cm³, the total must be 60 cm³.
- The concentration halves at every step: 100% → 50% → 25% → 12.5%.
Common Mistakes
- Using unequal volumes (e.g. 20 cm³ transfer + 40 cm³ water) — would still halve the concentration but leaves only 20 cm³ behind, not the 30 cm³ required.
- Forgetting to label the concentration under the new beakers.
- Drawing the curved transfer arrow pointing the wrong way (back into the previous beaker).
- Putting "100%" under every beaker, or labelling the wrong concentration.
Things to Be Careful About
- Each transfer must be 30 cm³ so the dilution factor is exactly 1/2.
- Only complete beakers 2, 3 and 4; beaker 1 is already labelled.
- The question asks for three additional concentrations to the original 100% — so the final four concentrations must be 100%, 50%, 25%, 12.5%.
Carry out step 8 to step 14.
step 8 Prepare the concentrations of ethanol as shown in Fig. 1.2.
step 9 Put one potato cylinder into each beaker. Start timing and leave for 5 minutes.
step 10 Label test-tubes with the ethanol concentrations prepared in step 8.
step 11 After 5 minutes (step 9), remove the potato cylinders from the beakers and put them into the appropriately labelled test-tubes.
step 12 Put of hydrogen peroxide solution into the test-tube labelled 100. Immediately start timing.
step 13 Measure the height of the foam after 1 minute and after 2 minutes. Record the results in (a)(iii).
step 14 Repeat step 12 and step 13 with the potato cylinders in each of the other test-tubes.
Record your results in an appropriate table. Include the results recorded in step 7.
Answer
| % concentration of ethanol | height of foam at 1 minute / mm | height of foam at 2 minutes / mm |
|---|---|---|
| 0 | 25 | 35 |
| 12.5 | 22 | 31 |
| 25 | 18 | 25 |
| 50 | 12 | 17 |
| 100 | 5 | 8 |
(The actual numbers are the candidate's own measurements; the table above is an example that follows every marking convention. Foam height decreases as ethanol concentration increases.)
Representative table (see working): % concentration of ethanol vs. height of foam at 1 min / mm and at 2 min / mm, with foam height decreasing as concentration rises.
Background Concept
Recording results in a properly formatted table is a core Paper 3 skill. Conventions:
- Independent variable (IV) in the left column with its unit.
- Dependent variable(s) (DV) in subsequent columns, each with its unit in the heading only — not in every cell.
- All conditions and replicates included.
- Data recorded to a precision that matches the measuring tool (here, the nearest mm).
- The trend should be visible from the table alone.
Understanding the Question
The student has just run the experiment and must put all five sets of results into one table:
- The 0% control from step 7 (cylinder soaked in water, then put into H₂O₂).
- The four ethanol concentrations from step 13/14 (12.5%, 25%, 50%, 100%).
Each set has two readings: foam height at 1 minute and at 2 minutes.
Approach
Build a 3-column table: IV in column 1; height at 1 min in column 2; height at 2 min in column 3. Use the IV heading "% concentration of ethanol" and the DV headings "height of foam at 1 minute / mm" and "height of foam at 2 minutes / mm". Put the 0% control at the top, then the four ethanol concentrations in ascending order. Enter each value to a whole millimetre.
Step-by-Step Reasoning
Mark scheme checks (each earns one mark):
- ✓ Heading for IV: "% concentration of ethanol"
- ✓ Heading for DV: "height of foam / mm" (with /mm in the heading, not in each cell)
- ✓ Records results for 0% and for all four ethanol concentrations, at both 1 min and 2 min
- ✓ Correct trend: foam height at the highest concentration (100%) is lower than at the lowest (0%)
- ✓ All values recorded to the nearest whole millimetre
Why the trend goes downward: ethanol is an inhibitor of catalase. As its concentration rises, more enzyme molecules have their active sites disrupted, fewer enzyme–substrate complexes form per second, less O₂ is released per second, and so less foam accumulates. At very high ethanol concentrations the enzyme begins to denature (irreversible loss of shape), so the foam height is lowest at 100%.
Key Takeaways
- IV in column 1, units in the column heading — never in the cells.
- Include the control (0%) alongside the treatments.
- Whole numbers here because the ruler is read to the nearest mm.
- The trend should be obvious from the table without any extra commentary.
Common Mistakes
- Putting units in every cell instead of only the heading (e.g. "25 mm", "35 mm").
- Using decimals (e.g. "25.3 mm") — the question requires the nearest mm.
- Missing the 0% control row.
- Recording only one time point (e.g. only the 2-minute reading).
- Sorting concentrations in the wrong order so the trend is hidden.
Things to Be Careful About
- "Height of foam" must include the word "height" — it is the DV that is measured.
- Use a ruler divided in mm, not a measuring cylinder, to read the foam.
- The trend at the top of the table should clearly go downward as you read across the concentration column.
Calculate the rate at which the foam was produced at 1 minute and at 2 minutes for 100% ethanol, E.
Show your working.
Include the unit in your answer.
rate at 1 minute = ______
rate at 2 minutes = ______
Working
Using the candidate's own recorded values for 100% ethanol:
(Or, alternatively, rate at 2 minutes = . Both earn the mark.)
Example with and :
Answer
rate at 1 minute = [candidate's value] mm min⁻¹ ; rate at 2 minutes = [candidate's value] mm min⁻¹ (with the unit on each).
rate at 1 minute = value/1 min, with unit mm min⁻¹; rate at 2 minutes = (value at 2 min − value at 1 min)/1 min, with unit mm min⁻¹.
Background Concept
Rate is the change in a quantity divided by the time taken for that change. For a continuously accumulating product such as foam, two natural definitions exist:
- Cumulative rate = total accumulated height ÷ total time elapsed.
- Interval rate = change in height over a specific time interval ÷ length of that interval.
Both are valid; the mark scheme rewards either as long as the working is shown and the unit is included. The unit of rate here is mm min⁻¹ (millimetres per minute).
Understanding the Question
The candidate must calculate the rate of foam production at 1 minute AND at 2 minutes for the 100% ethanol cylinder, using their own recorded values. They must show working and quote a unit on each answer.
Approach
Take the student's two recorded heights (h₁ at 1 min, h₂ at 2 min) and apply:
For "rate at 1 min", Δtime = 1 min. For "rate at 2 min", either use Δtime = 2 min on h₂ (cumulative) or use Δtime = 1 min on (h₂ − h₁) (interval over the second minute). Either earns the mark as long as the working is visible.
Step-by-Step Reasoning
Using example values h₁ = 5 mm and h₂ = 8 mm:
Or, using the cumulative method:
The mark scheme wants:
- ✓ working shown for both rates
- ✓ a unit (mm min⁻¹ or mm/min) on each rate
The actual numerical values depend on the student's own measurements from (a)(iii).
Key Takeaways
- Rate = change in quantity ÷ change in time. Always include units.
- Two acceptable definitions for "rate at 2 min"; pick one and show it clearly.
- The mark is for the method AND the unit, not just for any single number.
Common Mistakes
- Forgetting the unit (just writing "5" or "3" instead of "5 mm min⁻¹").
- Calculating only one rate.
- Dividing by 2 minutes when the question says "rate at 1 minute" (incorrect; Δtime = 1 min).
- Mixing height and time (numerator and denominator the wrong way round).
Things to Be Careful About
- Use the student's own h₁ and h₂ from (a)(iii); do not invent values.
- The unit is mm per minute; mm/s would also be acceptable if the timer was in seconds.
- Show the working — the mark is for the calculation method, not just the final number.
Answer
The rate at 2 minutes is lower than the rate at 1 minute — the rate decreases with time.
The rate decreases with time.
Background Concept
Once two rates have been calculated for the same condition (here 100% ethanol), they can be compared to see how the rate changes over the course of the reaction. As the reaction proceeds, the substrate (H₂O₂) is consumed; with less substrate available, the enzyme works more slowly per unit time, and the rate falls.
Understanding the Question
The question asks for a description of how the rate changes with time, using the candidate's own calculated rates from (a)(iv). The expected answer is a one-sentence statement of direction.
Approach
Compare the rate at 2 min with the rate at 1 min, and state which is larger (or whether they are the same). Support with the candidate's own numbers.
Step-by-Step Reasoning
Using example values from (a)(iv):
- Rate at 1 min = 5 mm min⁻¹
- Rate at 2 min = 3 mm min⁻¹ (interval method)
The rate at 2 min is lower than the rate at 1 min, so the rate decreases with time. This is the expected biological pattern: the substrate is being used up, so the enzyme has less to work on.
Key Takeaways
- Always state the direction (increase / decrease / no change).
- Quote the calculated values from (a)(iv) to support the statement.
- One sentence is enough.
Common Mistakes
- Describing the change in height instead of rate (height keeps increasing; rate can fall).
- Saying "the rate is slower" without saying it decreases with time.
- Adding biological explanation that the question did not ask for.
Things to Be Careful About
- The answer must be about rate, not height or volume.
- Use the candidate's own numbers, not generic numbers.
With reference to the activity of catalase, explain why the results of 0 (step 7) were important in this investigation.
Answer
The 0% (water-only) result shows the activity of catalase without ethanol, providing the reference value against which the ethanol-treated cylinders are compared.
It shows the activity of catalase without ethanol.
Background Concept
A control is a condition in which the variable being tested is absent. It tells us what happens without the treatment. Comparing treatments to the control reveals the effect of the treatment itself.
In this experiment, the 0% (water only) cylinder is the control. The variable being tested is ethanol concentration. The control therefore tells us how active catalase is when no ethanol is present.
Understanding the Question
The question asks why the step-7 result (the 0% cylinder) was important to the investigation. The candidate must explain the role of this result.
Approach
State clearly what the 0% cylinder shows (catalase activity with no ethanol) and why that matters (it is the reference against which the ethanol treatments are compared).
Step-by-Step Reasoning
The mark scheme answer is "shows the activity of catalase without ethanol". A fuller explanation:
- Without the 0% reading we would not know whether any change in foam height was caused by ethanol or by natural variation in catalase activity between cylinders.
- The 0% result is the baseline / reference against which every ethanol concentration is judged.
- Because catalase is uninhibited in 0%, foam height is maximal here; the difference between 0% and any higher concentration quantifies how much ethanol has inhibited the enzyme.
Key Takeaways
- A control must be present in any experiment that tests the effect of something.
- The control value is the reference for comparison.
- The specific phrase "without ethanol" is the credit-bearing phrase.
Common Mistakes
- Saying only "it was a control" without saying what the control shows.
- Saying "it shows the maximum activity" without linking this to the absence of ethanol.
- Writing more than one sentence when one suffices.
Things to Be Careful About
- The mark scheme wants "without ethanol" or equivalent — the candidate must explicitly name what is missing.
- One sentence is enough for a 1-mark item.
Answer
Height of the foam.
Height of the foam
Background Concept
The dependent variable (DV) is what is measured in an experiment; the independent variable (IV) is what the experimenter changes. In a well-designed investigation, control variables are held constant so any change in the DV can be attributed to the IV.
Understanding the Question
A 1-mark recall item asking for the dependent variable in this investigation.
Approach
Identify what was actually measured. Do not confuse the DV with the IV or with something inferred from the DV.
Step-by-Step Reasoning
The procedure puts a potato cylinder into hydrogen peroxide solution and measures the height of the foam at 1 min and at 2 min. The thing measured is the dependent variable.
Mark scheme answer: height of the foam.
What is not the dependent variable:
- Concentration of ethanol (this is the IV — it is changed between beakers).
- Catalase activity (this is inferred from foam height, not measured directly).
- Volume of oxygen (this would be the DV if a gas syringe were used, but in this experiment we measure foam height).
Key Takeaways
- DV = what is measured.
- IV = what is changed.
- "Catalase activity" is a conclusion drawn from the DV, not the DV itself.
Common Mistakes
- Writing "catalase activity" — this is the biological interpretation, not what the ruler measures.
- Writing "the foam" (vague) or "amount of foam" (the question says "height", which is the precise term).
- Writing "concentration of ethanol" — that is the IV.
Things to Be Careful About
- Use the exact phrasing from the procedure: "height of the foam".
- One word / one short phrase is enough.
Suggest two improvements to the investigation you have carried out to increase the confidence in your results.
Answer
Any two from:
- Use more concentrations of ethanol between 0% and 100% — gives more data points so the relationship between ethanol concentration and catalase activity is more reliably defined.
- Carry out repeats at each concentration and calculate a mean — reduces random variation between cylinders and gives a more reliable value at each concentration.
- Use a gas syringe to measure the volume of O₂ released instead of measuring foam height — foam height is subjective; a gas syringe gives an objective, quantitative volume measurement.
Two from: (1) more concentrations of ethanol; (2) repeats and calculate a mean; (3) use a gas syringe to measure volume of gas.
Background Concept
"Confidence in results" means reliability — would the experiment give the same answer if repeated? Improvements should therefore target either random error (by taking more readings or more repeats) or measurement error (by using better apparatus). The mark scheme lists three specific improvements; any two earn full marks.
Understanding the Question
A 2-mark item asking for TWO specific improvements that would increase confidence in the results of the catalase investigation.
Approach
Pick any two of the mark-scheme-listed improvements. State each as a concrete change to the procedure, not as a vague aspiration ("be more careful" is rejected).
Step-by-Step Reasoning
The three credited improvements, with the reasoning behind each:
-
More concentrations of ethanol (e.g. 6.25%, 75% as well as the existing 12.5%, 25%, 50%, 100%).
- Why: more data points on the concentration axis give a smoother, more reliable trend between ethanol concentration and catalase activity. The student can also identify non-linear features (a plateau, a threshold).
-
Carry out repeats at each concentration and calculate a mean.
- Why: a single cylinder may have more or less catalase than average, may have an uneven shape, or may be exposed to a slightly different surface area. Repeats average out this random variation and make the trend more reliable.
-
Use a gas syringe to measure the volume of O₂ released instead of measuring foam height.
- Why: foam height is subjective (the boundary is uneven, the test-tube is curved, parallax is easy). A gas syringe gives a single sharp meniscus reading in cm³, which is objective and more precise.
Key Takeaways
- Improvements should be specific (name the change) and targeted (say what error they fix).
- More concentrations → better shape of trend.
- Repeats + mean → less random error.
- Better apparatus → less measurement error.
Common Mistakes
- "Be more accurate" / "be more careful" — too vague, rejected.
- "Use a larger sample" without specifying what "sample" means (more cylinders? more concentrations?).
- Suggesting changes that would alter the variable being tested (e.g. "use a different potato").
- Adding controls that are already present (e.g. "include a water control").
Things to Be Careful About
- The question says "increase the confidence" — usually meaning reliability, not validity.
- Vague answers are rejected; each improvement must be a specific, named change.
- Two improvements are required for 2 marks.
Some fruits turn brown when they are cut into slices for eating. This browning can make the fruit less appealing to eat and difficult to sell.
The enzyme polyphenol oxidase (PPO) catalyses an oxidation reaction when fruit is cut, causing the fruit tissue to turn brown.
Scientists carried out an investigation to see how exposing wampee fruits to different concentrations of ethanol affected the activity of PPO in the fruit tissue.
A large sample of wampee fruits was divided into five equal groups. Each group of fruit was sealed in a plastic container and treated with a different concentration of ethanol.
After a short time in storage, the activity of the enzyme PPO in the wampee fruit tissue was recorded.
The results are shown in Table 1.2.
Table 1.2
| concentration of ethanol / | PPO activity / arbitrary units |
|---|---|
| 0 | 2.20 |
| 100 | 1.40 |
| 200 | 0.95 |
| 400 | 0.70 |
| 500 | 0.60 |

Answer
Plotted graph with x-axis 'concentration of ethanol / μL dm⁻³' (scale 100 to 2 cm), y-axis 'PPO activity / arbitrary units (au)' (scale 0.5 to 2 cm), five accurate crosses joined by a smooth thin curve.
Background Concept
Plotting a graph on grid paper follows strict CIE conventions:
- Axes: IV on x, DV on y; each labelled with quantity and unit.
- Scales: chosen so the data uses at least half the grid in both directions and avoids awkward numbers (3s and 7s); every major gridline labelled.
- Points: plotted accurately with a sharp pencil, using small crosses (×) or a dot-in-circle (⊙).
- Line: a smooth thin line (curve or straight) joining the points; for non-linear data, a smooth curve, not a series of straight segments.
Understanding the Question
The candidate is given Table 1.2 (concentration of ethanol vs. PPO activity for five concentrations) and must plot the data on the grid in Fig 1.3 with the conventions above.
| Concentration / μL dm⁻³ | PPO activity / au |
|---|---|
| 0 | 2.20 |
| 100 | 1.40 |
| 200 | 0.95 |
| 400 | 0.70 |
| 500 | 0.60 |
Note: the unit printed in the question is written unusually; it is intended to read μL dm⁻³ (microlitres per cubic decimetre).
Approach
Decide axes: IV (concentration of ethanol) → x-axis; DV (PPO activity) → y-axis. Choose the simplest scale that uses ≥ half the grid:
- x-axis: 100 to 2 cm (so 0–500 fits in 10 cm of the 18 cm-wide grid).
- y-axis: 0.5 to 2 cm (so 0–2.5 au fits in 10 cm of the 17 cm-tall grid).
Plot the five points with crosses. Connect with a smooth curve because the data is non-linear (steep drop at low concentrations, plateau at high concentrations).
Step-by-Step Reasoning
Mark scheme checks:
- ✓ x-axis labelled "concentration of ethanol / μL dm⁻³" and y-axis labelled "PPO activity / arbitrary units (au)".
- ✓ x-axis scale: 100 per 2 cm; y-axis scale: 0.5 per 2 cm, labelled at least every 2 cm.
- ✓ All five points plotted accurately with × or ⊙.
- ✓ Smooth thin line (curve) through all five points, joined point to point.
The shape of the curve:
- Starts at (0, 2.20) — the maximum.
- Drops steeply to (100, 1.40) and (200, 0.95).
- Levels off between (400, 0.70) and (500, 0.60).
This is the characteristic shape for an inhibitor approaching saturation / denaturation of the enzyme at high inhibitor concentrations.
Key Takeaways
- IV on x-axis, DV on y-axis.
- Scale must use at least half the grid and be free of awkward numbers.
- Plot with sharp pencil; use a clear × or ⊙.
- For non-linear data, draw a smooth curve (not a straight line).
Common Mistakes
- Swapping axes (concentration on y, activity on x).
- Choosing a scale that does not use enough of the grid (e.g. 100 per 1 cm gives a tiny graph; 100 per 5 cm wastes space).
- Plotting points with fuzzy circles or pencil dots rather than clear ×.
- Joining the points with straight line segments (the data is curved).
- Forgetting to label either axis with its unit.
Things to Be Careful About
- The unit "μL dm⁻³" must be written correctly (μ is the Greek letter mu, L is capital, dm⁻³ is per cubic decimetre).
- "au" or "arbitrary units" must appear on the y-axis — enzyme activity here has no SI unit.
- All five points must be visible and clearly plotted; the line must pass through each.
Answer
Any two from:
- As the concentration of ethanol increases, PPO activity decreases.
- Ethanol acts as an inhibitor of PPO.
- As ethanol concentration increases, fewer enzyme-substrate complexes form per second, so less product is made.
- At higher concentrations of ethanol, the PPO enzyme starts to denature.
As concentration of ethanol increases, PPO activity decreases because ethanol acts as an inhibitor (and at higher concentrations the enzyme begins to denature).
Background Concept
Enzymes are proteins that catalyse specific reactions. Their activity depends on the precise 3D shape of the active site. Anything that disrupts this shape, or that blocks the active site, reduces activity. Two key mechanisms:
- Inhibition: a molecule binds to the active site (competitive) or elsewhere on the enzyme (non-competitive), preventing substrate from binding. Fewer enzyme-substrate complexes form per second → less product per second → lower activity.
- Denaturation: a molecule disrupts the H-bonds and hydrophobic interactions that hold the enzyme's tertiary structure, irreversibly changing the shape of the active site. The enzyme can no longer bind substrate at all, even after the inhibitor is removed.
Understanding the Question
The data shows PPO activity decreasing as ethanol concentration increases. The candidate must explain why this pattern occurs, in terms of how ethanol affects PPO.
Approach
Pick any two of the four mark-scheme points. Use precise enzyme vocabulary (active site, enzyme-substrate complex, denaturation).
Step-by-Step Reasoning
The data trend:
- 0 μL dm⁻³ ethanol → 2.20 au (highest activity)
- 100 → 1.40 (sharp drop)
- 200 → 0.95
- 400 → 0.70
- 500 → 0.60 (lowest activity, plateau)
Two biological explanations, any two of which earn the marks:
-
As ethanol concentration increases, PPO activity decreases — the visible pattern in the data.
-
Ethanol acts as an inhibitor — it binds to PPO and prevents the substrate from binding or being converted efficiently.
-
As ethanol concentration increases, fewer enzyme-substrate complexes form per unit time — directly linking the loss of activity to the central catalytic event of enzyme function.
-
At higher concentrations, PPO begins to denature — the irreversible change of tertiary structure. This explains the plateau at high concentrations: once most of the enzyme molecules are denatured, raising the ethanol concentration further has little additional effect (the activity is already near its floor).
The curve shape (steep drop then plateau) is consistent with inhibition dominating at low concentrations and denaturation dominating at high concentrations.
Key Takeaways
- An inhibitor reduces the rate of enzyme-substrate complex formation.
- A denatured enzyme has lost its tertiary structure and cannot bind substrate.
- A curve that plateaus near the bottom suggests denaturation has set in.
- "Killed" is the wrong word for enzymes — they are not alive.
Common Mistakes
- Saying the enzyme is "killed" — enzymes are not living; the correct word is "denatured".
- Saying "the enzyme is denatured" without specifying higher concentrations (at low concentrations ethanol is an inhibitor, not a denaturant).
- Saying the substrate is broken down faster — the data shows activity decreases.
- Confusing inhibition and denaturation — they are different mechanisms.
- Adding extra biology (e.g. about ethanol vapour, about PPO function) that the question did not ask for.
Things to Be Careful About
- The pattern is a decrease, not an increase.
- The trend is non-linear — describe it as a steep drop that plateaus.
- Use precise enzyme vocabulary: active site, enzyme-substrate complex, denaturation.
- Two creditable points are required for 2 marks.
K1 is a slide of a stained transverse section through a plant stem.
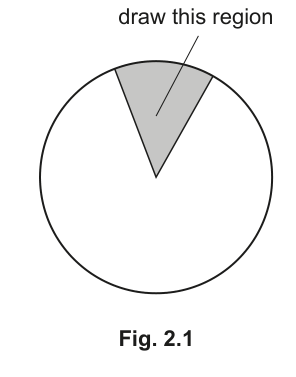
Draw a large plan diagram of the region of the stem on K1 indicated by the shaded area in Fig. 2.1.
Use a sharp pencil.
Use one ruled label line and label to identify the epidermis.
Working
A plan diagram is a low-magnification, outline drawing that shows the distribution of tissues — not the cells themselves. Follow these conventions:
- Use most of the available space.
- Draw clean, continuous lines (no sketchy/fuzzy lines).
- Do not shade any area and do not draw individual cells.
- Draw only the wedge-shaped sector from Fig. 2.1, showing from the outer epidermis inwards to the centre of the stem.
- Include: the epidermis (outer single layer), the layer of tissue immediately beneath it (cortex), and at least one vascular bundle deeper in the wedge.
- Add one ruled label line ending precisely on the epidermis layer, with the word epidermis written at the end of the line.
Answer
A plan diagram of the wedge shown in Fig. 2.1, with the epidermis labelled.
Plan diagram of the wedge-shaped region showing epidermis, cortex and at least one vascular bundle, with 'epidermis' labelled by a ruled line.
Background Concept
A plan diagram (sometimes called a low-power outline drawing) is used to show the overall organisation of tissues in a specimen without the detail of individual cells. It is drawn at low magnification, using only clean, continuous outlines to mark the boundaries between different tissue layers. It is the standard way to record the gross anatomy of a plant or animal section on a Cambridge practical paper.
In a transverse section of a young dicot stem, the major tissue layers visible at low power, in order from the outside in, are:
- Epidermis — a single outer layer of cells, often with a cuticle.
- Cortex — a region of parenchyma cells just beneath the epidermis.
- Vascular bundles — discrete units of xylem and phloem, often arranged in a ring in dicots.
- Pith — central ground tissue (parenchyma), often with large cells.
The wedge indicated in Fig. 2.1 cuts from the outer surface inwards through the cortex and into a vascular bundle and the pith at its tip.
Understanding the Question
The shaded sector in Fig. 2.1 covers roughly one-eighth of the circular section. You are being asked to draw only that sector, large, at low magnification, with no cells shown, and to label the epidermis with one ruled line and label.
The command words are draw and label — so the answer is a piece of artwork on the paper, not a written description. Marks are awarded for the conventions of the plan diagram, not for biological content beyond showing the correct region.
Approach
- Decide on the size — your drawing should fill most of the space provided in the answer booklet.
- Sketch the outline of the wedge lightly first, then redraw with sharp pencil and continuous lines.
- Mark the boundary between epidermis and cortex as a smooth line.
- Mark the boundary of the vascular bundle(s) within the wedge.
- Mark the pith boundary.
- Draw one ruled label line from the word epidermis to the outermost layer.
Step-by-Step Reasoning
- Mark 1 — 'uses most of the available space and no shading': A plan diagram must fill most of the space; it must not be a tiny sketch. No shading anywhere — plan diagrams are line drawings only.
- Mark 2 — 'draws the correct region and no cells included': Only the wedge-shaped sector must be drawn, with the same proportions as in Fig. 2.1 (the wedge widens from the centre outwards to the surface). No individual cells drawn.
- Mark 3 — 'draws the layer of tissue beneath the epidermis': This is the cortex; show it as a continuous band of tissue between the epidermis and the next layer inwards.
- Mark 4 — 'draws at least one vascular bundle': Show the outline of at least one vascular bundle within the wedge. The wedge in the figure clearly passes through one.
- Mark 5 — 'label line and label to epidermis': One straight ruled line (drawn with a ruler) ending on the epidermis, with the label epidermis clearly written at the other end. Label lines must not have arrows or end in the middle of a layer.
Key Takeaways
- A plan diagram is a tissue-level outline drawing — no cells, no shading.
- Conventions: large, clean lines, correct proportions, ruler-straight label lines.
- Always show every relevant tissue layer visible in the region you are asked to draw.
Common Mistakes
- Drawing individual cells (this is a plan diagram, not a cell drawing).
- Using shading or stippling to differentiate tissues — lines only.
- Drawing the whole stem instead of the wedge.
- Label line ending in empty space or crossing other lines — the line must touch the structure labelled.
Things to Be Careful About
- The epidermis is a single cell layer; do not draw it as a thick band.
- The proportions of tissues must reflect those in the actual specimen — the cortex is wider than the epidermis and the vascular bundle is a discrete region.
- One label only — the mark scheme explicitly asks for one ruled label line.
Observe the cells in the centre of the stem on K1.
Select a group of four adjacent cells.
Each cell must touch at least two of the other cells.
- Make a large drawing of this group of four cells.
- Use one ruled label line and label to identify the cell wall of one cell.
Working
A cell drawing (high-power drawing) shows individual cells and must follow these conventions:
- Use most of the available space; lines must be continuous, thin and sharp.
- Draw exactly four cells. Each cell must touch at least two of the others (no isolated cells).
- Each cell wall must be drawn as two parallel lines (a thin double line representing the cell wall thickness).
- Where two cells share a wall, only three lines appear (two outer lines and the single shared middle wall line).
- The cells should be polygonal — most plant cells in the pith are pentagonal or hexagonal (5 or 6 sides).
- Add one ruled label line ending on the cell wall of one cell, labelled cell wall.
Answer
A drawing of four adjacent polygonal plant cells in the centre of the stem, with 'cell wall' labelled by a ruled line on one cell.
Drawing of four adjacent polygonal cells (5–6 sides), with double lines for walls, three lines at shared walls, and 'cell wall' labelled by a ruled line.
Background Concept
Plant cells are bounded by a cell wall made primarily of cellulose. Under the light microscope, the wall appears as a thin line. Where two adjacent cells meet, the structure you see is the wall of cell A + middle lamella + wall of cell B, which is conventionally drawn as a single line shared between two cells.
In the centre (pith) of a young dicot stem, the cells are large, thin-walled parenchyma cells that fit together with no large intercellular spaces, giving them a polygonal (5- or 6-sided) shape in transverse section.
Understanding the Question
The question asks you to select a group of four adjacent cells from the central region of the stem on slide K1, where each cell touches at least two of the others, and to draw this group large.
The command word is make a large drawing — this is a high-power cell drawing, not a plan diagram and not a sketch of just outlines. The marks are for the conventions of biological drawing applied at cellular level.
Approach
- Place the slide on the microscope and select the centre of the stem.
- Identify four adjacent polygonal cells where each touches at least two of the others.
- Decide on a size — large enough to fill most of the space.
- Draw each cell wall as two thin parallel lines that meet at corners.
- Where cells touch, only three lines appear (two for the outer walls of the pair, one for the shared middle wall).
- Add the label cell wall by a single ruled line ending precisely on a wall.
Step-by-Step Reasoning
- Mark 1 — 'uses most of the available space and lines are continuous, thin and sharp': The drawing must be large, and the lines must be the kind of single, sharp pencil strokes you get with a hard pencil (HB or 2H) and a steady hand.
- Mark 2 — 'draws only four cells and each cell touches at least two other cells': Exactly four cells — not three, not five. The connectivity requirement rules out drawing a 'chain' of cells where the middle two only touch one neighbour each; the four must form a cluster with each cell in contact with at least two others.
- Mark 3 — 'two lines around each cell and three lines where cells touch': The cell wall is drawn as a double line. At a corner where three cells meet, the boundary is the two outer cell walls plus one wall between each pair of cells — drawn as the appropriate number of lines.
- Mark 4 — 'draws cells with 5 or 6 sides': Real parenchyma cells in transverse section are pentagons or hexagons (close-packed polygonal tiling). Drawing squares, circles or triangles loses this mark.
- Mark 5 — 'label line and label to cell wall of one cell': One ruled line ending on a cell wall, with the label cell wall written at the other end.
Key Takeaways
- A high-power cell drawing must show individual cells, not just outlines.
- Convention: cell walls = double lines; shared walls = one line between two cells (so three lines for the pair).
- Plant cells in section are polygonal (5–6 sides), never circular.
Common Mistakes
- Drawing single-line cell walls (this is for plan diagrams, not cell drawings).
- Drawing three lines at every cell–cell boundary (this is wrong; three lines only where two cells share a wall).
- Drawing the cells as round or oval — parenchyma cells in close contact are polygonal.
- Drawing more than four cells, or drawing four cells where one only touches one other (chain layout).
Things to Be Careful About
- The cell wall label must end on a wall line — not on the cytoplasm or in empty space.
- Only one label is required for this mark; additional labels are not penalised but waste time.
- No shading, no organelles (other than what is asked to be labelled) — this is a structural drawing.
Fig. 2.2 is a photomicrograph of a stained transverse section of a stem from a different plant.
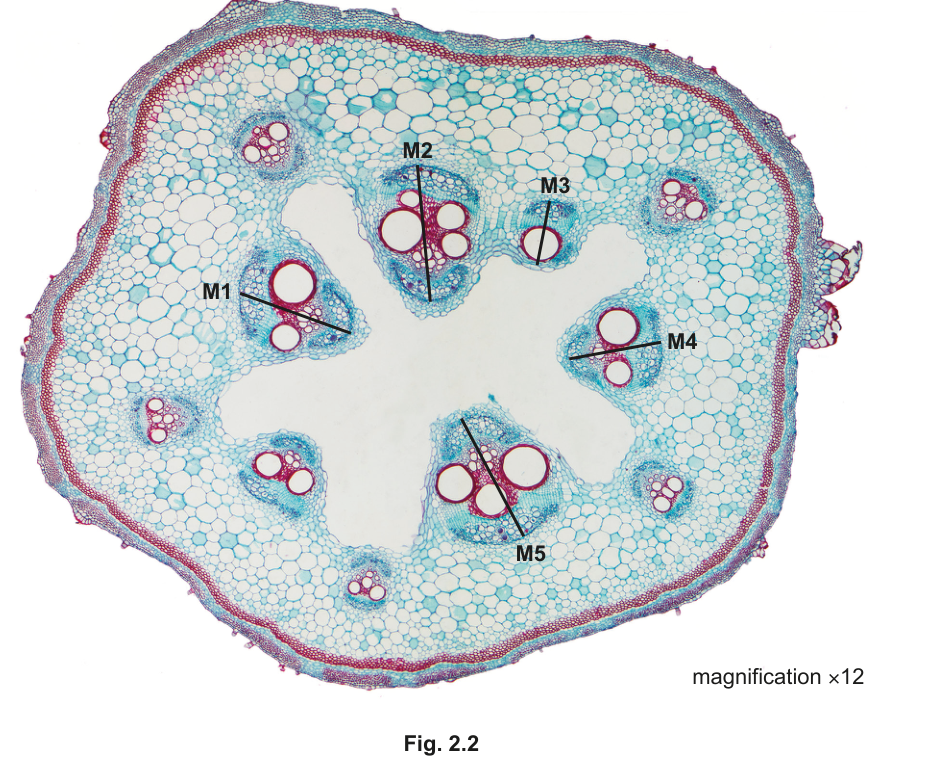
Measure the length of the vascular bundles using the lines M1, M2, M3, M4 and M5 in Fig. 2.2 and calculate the mean actual length of the vascular bundles.
Show your working.
M1 = ______ M2 = ______ M3 = ______ M4 = ______ M5 = ______
mean actual length ______
Working
The magnification of Fig. 2.2 is ×12, so:
Representative measurements (image lengths, in mm) of the five vascular bundles on Fig. 2.2:
- M1 = 18 mm
- M2 = 24 mm
- M3 = 18 mm
- M4 = 12 mm
- M5 = 18 mm
Step 1 — mean of the image measurements:
Step 2 — convert the mean to actual length using the magnification:
Answer
- M1 = 18 mm; M2 = 24 mm; M3 = 18 mm; M4 = 12 mm; M5 = 18 mm
- mean actual length = 1.5 mm
1.5 mm (image measurements: M1 = 18 mm, M2 = 24 mm, M3 = 18 mm, M4 = 12 mm, M5 = 18 mm)
Background Concept
Magnification is the ratio of image size to actual size:
Rearranging gives:
In Cambridge practical questions, the magnification of a printed image is given in the figure caption (here, ×12). To convert a length measured on the printed image into the true length of the specimen, divide by the magnification.
Understanding the Question
Five straight black lines labelled M1 to M5 cross the vascular bundles in Fig. 2.2. Each line is roughly the diameter of one vascular bundle. You must measure each line on the figure (in mm), calculate the mean, then convert that mean image length into the actual length of the vascular bundles using the stated ×12 magnification.
The question asks you to record five measurements and units, show the mean calculation, show the division by 12, and round the final answer to the nearest 0.5 mm.
Approach
- Use a ruler to measure each of the five labelled lines M1–M5 on the photomicrograph in mm. Record each with its unit.
- Sum the five measurements and divide by 5 to get the mean image length.
- Divide the mean image length by the magnification (12) to obtain the mean actual length.
- Round the answer to the nearest 0.5 mm (so possible answers: 0.0, 0.5, 1.0, 1.5, 2.0, 2.5 mm…).
Step-by-Step Reasoning
- Mark 1 — 'states five measurements for length of vascular bundles and units': Each of M1–M5 is given in mm (the unit is essential; numbers without units do not earn the mark). The image measurements depend on the ruler used; representative values are M1 = 18 mm, M2 = 24 mm, M3 = 18 mm, M4 = 12 mm, M5 = 18 mm.
- Mark 2 — 'shows five measurements added together and divided by 5': The mean is computed correctly: (18 + 24 + 18 + 12 + 18) ÷ 5 = 90 ÷ 5 = 18 mm.
- Mark 3 — 'shows value divided by 12': The actual length = image length ÷ magnification = 18 ÷ 12 = 1.5 mm.
- Mark 4 — 'answer given to nearest 0.5 mm': 1.5 mm already lies on a 0.5 mm gridline, so no further rounding is needed; the answer is 1.5 mm.
Key Takeaways
- actual size = image size ÷ magnification is the formula to remember.
- Always include units with measurements (mm here, not just numbers).
- The required precision is set by the mark scheme (here, nearest 0.5 mm) — give the answer to that precision, not to a tighter one.
Common Mistakes
- Forgetting units on the image measurements (loses the unit mark).
- Dividing by 12 first then averaging (works mathematically but does not match the mark scheme sequence — ecf is usually allowed but is less clear).
- Multiplying by 12 instead of dividing (treating image as actual).
- Giving the answer to a precision other than 0.5 mm, e.g. 1.4 mm or 1.50 mm — does not earn the final mark.
Things to Be Careful About
- The lines M1–M5 are not all the same length; some bundles are larger than others. Do not assume they are equal.
- The answer must be the mean actual length, not the mean image length. Many candidates stop at 'mean = 18 mm' and forget to divide by 12.
- The magnification (×12) is stated in the figure caption. Use that, not 10× or 40×.
A student suggested that the mean actual length of the vascular bundles calculated in (b)(i) was not accurate for the whole plant.
Describe two modifications to the method used in (b)(i) that would allow a more accurate mean length of the vascular bundles for the whole plant to be calculated.
Answer
Any two of:
- Measure all the vascular bundles in the section (not just five).
- Use a larger magnification so the vascular bundles are easier to measure accurately.
- Take more sections from the plant at different positions/levels and measure the vascular bundles in each.
Measure all the vascular bundles in the section; use a larger magnification; and/or take more sections from the plant.
Background Concept
A mean calculated from a small or non-representative sample may not be a reliable estimate of the whole population. To improve accuracy of a mean for an entire plant, you need either:
- a larger, more representative sample of measurements within the section you have, or
- samples from more locations/individuals to reduce the effect of local variation.
Understanding the Question
The student has calculated a mean vascular-bundle length from only five bundles in one section of one stem. They want a more accurate mean for the whole plant. You must describe two modifications to the method.
The mark scheme awards 1 mark for any two of three specific improvements.
Approach
Think about the three sources of error in the existing method:
- Sample size within the section is small (only five bundles measured).
- The magnification may be too low for accurate measurement of short bundles.
- Only one section has been examined — there is biological variation along the length of the stem and between stems.
Then pick any two to write down.
Step-by-Step Reasoning
- Improvement 1 — measure all vascular bundles: instead of only five, measure every vascular bundle in the section. The mean is then based on the whole population within that section.
- Improvement 2 — use a larger magnification: a higher magnification enlarges each vascular bundle, making it easier to place the ruler accurately and reducing proportional error.
- Improvement 3 — take more sections: cut and examine additional sections from different parts of the same plant (or different plants of the same species) to capture biological variation.
Key Takeaways
- Reliability of a mean depends on sample size and representativeness.
- Improvements in practical biology usually fall into 'measure more', 'use better apparatus', or 'control variables better'.
Common Mistakes
- Saying 'repeat the experiment' without saying what specifically would be changed.
- Suggesting improvements unrelated to the measurement (e.g. staining, mounting) — these do not affect the accuracy of the length measurement.
- Repeating the same idea twice (e.g. 'measure more bundles' and 'measure all bundles' — only one mark available from that bullet).
Things to Be Careful About
- The question asks for two modifications to make the mean more accurate for the whole plant, not just more precise. Suggestions that improve precision but not representativeness (e.g. 'use a sharper pencil') do not earn marks.
Fig. 2.3 is the same photomicrograph as that shown in Fig. 2.2.
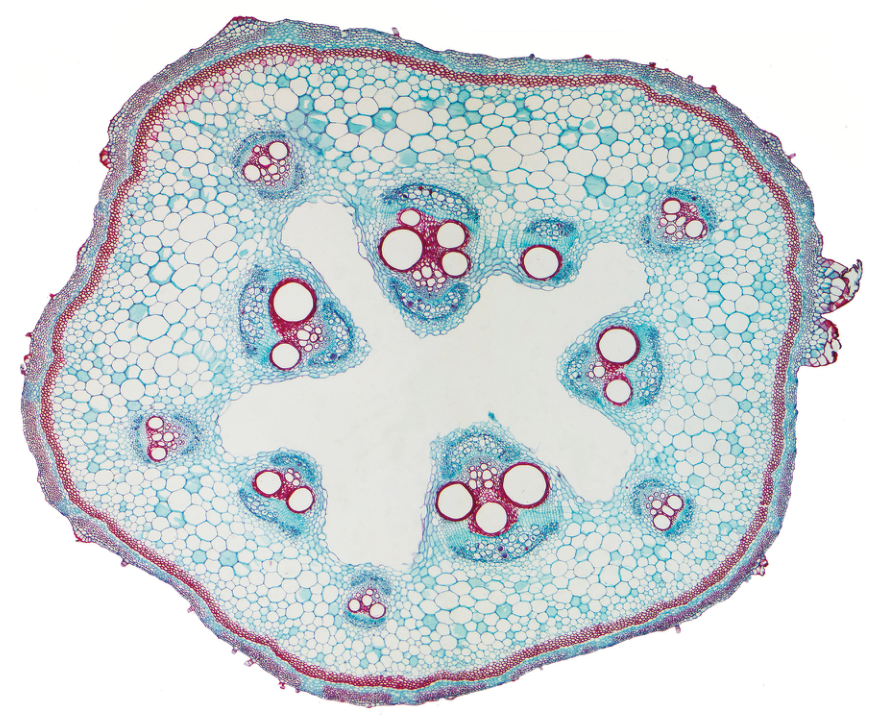
Identify three observable differences, other than colour, between the stem section on K1 and the stem section in Fig. 2.3.
Record these three observable differences in an appropriate table.
Answer
| Feature | K1 | Fig. 2.3 |
|---|---|---|
| Thickness of epidermis | Thin | Thick |
| Shape of stem (outline) | Circular | Wavy |
| Number of vascular bundles | More | Fewer |
| Position of vascular bundles | Scattered | Arranged in a ring (near the outer edge) |
Any three of these four rows earn the three content marks, plus one mark for the table layout itself.
Three observable differences in a table — e.g. K1 has a thin epidermis / circular outline / more, scattered vascular bundles; Fig. 2.3 has a thick epidermis / wavy outline / fewer vascular bundles arranged in a ring.
Background Concept
Two plant stems can differ in many observable features: the shape of their cross-section, the number and arrangement of vascular bundles, the thickness of the epidermis, the size of cells in different tissues, and the presence/absence of features such as a pith cavity, trichomes or stomata. The mark scheme insists on observable differences, so only features you can actually see on the specimens count — not inferences about the plant species or function.
Fig. 2.3 shows a stem with:
- a wavy (lobed) outline rather than a smooth circle;
- a noticeably thick epidermis (an obvious outer red-stained band);
- a small number of large vascular bundles arranged in a ring near the outer edge;
- large air spaces (a pith cavity) in the centre.
Slide K1 (the plan-diagram specimen) shows a stem with:
- a circular outline;
- a thin epidermis;
- many vascular bundles scattered through the section.
Understanding the Question
You must identify three observable differences (excluding colour — the mark scheme says 'other than colour') between K1 and Fig. 2.3, and present them in a table.
The command word is identify — and the presentation requirement is table (not a list, not prose).
Approach
- Scan both specimens systematically — outline shape, epidermis thickness, vascular-bundle number, vascular-bundle position, presence/absence of central cavity, relative cell sizes.
- Pick three features where the difference is unambiguous from the images.
- Format the comparison as a table with columns for K1 and Fig. 2.3 and rows for each feature.
Step-by-Step Reasoning
- Table layout (1 mark): The answer must be in a table. The mark scheme explicitly says 'record these three observable differences in an appropriate table'. A list does not earn this mark.
- Difference 1 — thickness of epidermis: K1 has a thin epidermis (single layer of small cells); Fig. 2.3 has a much thicker epidermis (a wide band of red-stained tissue beneath the cuticle).
- Difference 2 — shape of stem: K1 has a circular outline; Fig. 2.3 has a wavy/lobed outline.
- Difference 3 — number of vascular bundles: K1 has many vascular bundles; Fig. 2.3 has only a small number (about five large bundles visible).
- Difference 4 (alternative) — position of vascular bundles: K1 has vascular bundles scattered throughout the section; in Fig. 2.3 they are arranged in a ring near the outer edge.
Any three of these four differences earn the three content marks.
Key Takeaways
- 'Observable differences' means features you can see directly, not biological inferences.
- Tabular presentation makes parallel comparison clear; rows = features, columns = specimens.
- Always read the mark-scheme exclusions — here, colour is excluded, so do not waste a row on it.
Common Mistakes
- Stating a difference in functional terms ('K1 is a dicot, Fig. 2.3 is a monocot') — this is an inference, not an observable feature.
- Including colour (explicitly excluded by the mark scheme).
- Writing only one or two rows — three rows are needed for full marks.
- Presenting as a paragraph instead of a table — the layout mark is lost.
Things to Be Careful About
- 'Other than colour' means do not mention staining or pigmentation; structural differences only.
- The mark scheme uses 'Fig. 2.1' as the column heading in the original, but it is the same image as Fig. 2.3 — the difference is just that the measurement lines are absent. Use Fig. 2.3 as the heading for clarity.
- Ensure the table has clear column headings and that each row gives one feature with both states described.