Biology 9700/11 — October/November 2024
Cambridge AS Level · Multiple Choice (AS Level) · answer key with instant marking and worked solutions
Topics Cell Structure · Nucleic Acids and Protein Synthesis · Biological Molecules · Enzymes · Cell Membranes and Transport · The Mitotic Cell Cycle · +5 more
Tap an option under each question to check it — your score builds as you go.
The diagram shows a transverse section through a blood capillary.
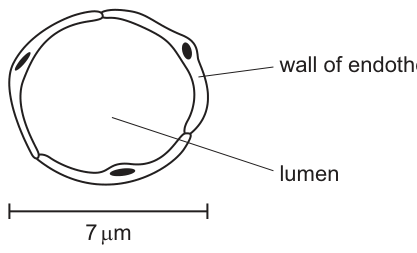
What is the magnification of the drawing?
Options
A
B
C
D
Working
Measure the scale bar on the printed image with a ruler. The scale bar represents in real life.
The scale bar in the image measures (representative measurement of the printed scale bar).
Convert the image size to the same units as the actual size:
Apply the magnification formula:
Answer
D
D
Background Concept
Magnification describes how many times larger a drawing (or image) is than the actual specimen. The key formula is:
Because the image size is usually measured in millimetres on the page and the actual size in micrometres, you must convert the units so they match before dividing. A common conversion is .
A scale bar drawn beside a figure is a quick way to work out magnification: it tells you the actual distance that a known length on the image represents. Measure the scale bar on the page with a ruler, convert its length to the same units as the value it labels, and then divide.
Understanding the Question
We are shown a transverse section of a blood capillary (a tiny vessel only one endothelial cell thick). Below the drawing is a scale bar labelled . This means the length of the bar on the page represents in reality. The question asks us to use this scale bar to determine how magnified the drawing is. A high magnification is expected because capillaries are very small — their lumens are typically only about across — and the drawing clearly shows individual endothelial cells with their nuclei.
The command word is "What is…", but the underlying skill is a calculation: the answer must be derived from a measurement of the scale bar, not guessed.
Approach
- Measure the length of the scale bar in millimetres using a ruler placed against the printed image.
- Convert that measurement to micrometres so it matches the actual size label ().
- Divide image size by actual size to obtain the magnification.
- Match the result to the closest answer choice.
Step-by-Step Reasoning
The scale bar measures approximately on the printed page (a typical value for this question; the exact value depends on the size of the printed paper, but the ratio gives ).
Convert image size to micrometres:
Apply the magnification formula:
So the drawing is larger than the real capillary. This matches answer D.
A quick sanity check: a capillary lumen of drawn would appear as on the page — about the width of a small coin — which is consistent with the size of the diagram shown.
Key Takeaways
- The magnification formula is one of the most heavily tested skills in AS Biology.
- A scale bar is the most reliable way to find the magnification of a printed drawing when no other length is given.
- Always convert units (mm ↔ µm) before dividing, or the answer will be off by a factor of 1000.
- Blood capillaries are extremely small (lumen ~), so any drawing showing cellular detail must be at very high magnification (light microscopy up to ~ normally, but drawings can be made at any magnification by enlarging the image on paper).
Common Mistakes
- Forgetting to convert units. Dividing directly by would give , not — a factor-of-1000 error that would lead to answer B () or another distractor.
- Measuring the wrong distance. Some students measure the diameter of the lumen instead of the scale bar. Although the scale bar is stated as (the same as the typical lumen diameter), the question specifies the scale bar is the reference.
- Guessing the answer. A very small structure drawn at large size is high magnification; answer D () reflects this, not the much lower or .
- Confusing magnification with resolution. A drawing of does not mean the original image had resolution; it is the magnification of the drawing on paper.
Things to Be Careful About
- State the units of the answer in the form (no unit symbol needed for a dimensionless magnification), and quote the value to an appropriate number of significant figures (here 1–2 sig figs is sufficient).
- If you cannot measure the scale bar exactly, use the answer choices as a guide: pick the one that gives a whole-number ratio when multiplied by and compared to a sensible page measurement.
- In AS Paper 1, the value of the scale bar is provided so you can check your work — always use it rather than estimating the size of the drawing itself.
Which statement explains why lymphocytes with no nucleoli die?
Options
A The cells do not have centrioles and cannot divide.
B The cells do not have mitochondria and cannot release energy.
C The cells do not have mRNA and cannot transcribe DNA.
D The cells do not have ribosomes and cannot synthesise protein.
Working
The nucleolus is the site of ribosomal RNA (rRNA) synthesis and the assembly of ribosomal subunits. Without a nucleolus, no new ribosomes are made, so the cell cannot synthesise proteins. Lymphocytes must continuously produce proteins (e.g. antibodies and membrane proteins) to survive, so they die.
- A — centrioles are not made in the nucleolus and are not relevant here.
- B — mitochondria are not produced by the nucleolus; they have their own DNA.
- C — mRNA is transcribed from DNA in the nucleoplasm, not in the nucleolus.
- D — the nucleolus assembles ribosomes, so without it protein synthesis is impossible.
Answer
D
D
Background Concept
The nucleolus is a dense, non-membrane-bound region inside the nucleus. Its job is to act as a ribosome factory: rRNA genes are transcribed there, the rRNA is processed, and the rRNA is combined with ribosomal proteins (imported from the cytoplasm) to assemble the two ribosomal subunits (a large and a small subunit). These subunits are then exported through nuclear pores to the cytoplasm, where they join during translation to form functional ribosomes.
Because the nucleolus is the only site of new ribosome production in a eukaryotic cell, losing it means the cell quickly runs out of working ribosomes. Without ribosomes, mRNA cannot be translated, so no proteins can be synthesised. Lymphocytes are highly secretory cells — they make antibodies, cytokines and a constant turnover of membrane receptors — so they depend on continuous protein synthesis. If translation stops, essential proteins are not replaced as they degrade, and the cell dies.
Understanding the Question
This is an MCQ asking you to identify which statement correctly links the absence of a nucleolus to the death of a lymphocyte. The distractors are designed to test whether you know what the nucleolus actually does and whether you confuse it with the functions of other organelles (centrioles, mitochondria) or other steps in the central dogma (transcription of mRNA).
Approach
The strategy is straightforward: identify the function of the nucleolus, then check each option to see which one correctly describes a downstream consequence of losing that function. Any option that connects the nucleolus to a structure or process it does not produce can be eliminated.
Step-by-Step Reasoning
- Function of the nucleolus: rRNA transcription and ribosomal subunit assembly. Therefore loss of the nucleolus → loss of new ribosomes.
- Consequence of losing ribosomes: no translation → no protein synthesis.
- Why this kills a lymphocyte: lymphocytes need ongoing protein synthesis (e.g. for antibody production and receptor turnover); without it, the cell cannot maintain itself.
- Eliminate A: centrioles duplicate from pre-existing centrioles and are involved in spindle formation during cell division, not nucleolus function. The question is not about cell division.
- Eliminate B: mitochondria are produced from pre-existing mitochondria, contain their own DNA and ribosomes, and are not made by the nucleolus.
- Eliminate C: mRNA is transcribed from protein-coding genes by RNA polymerase II in the nucleoplasm, not in the nucleolus. The nucleolus makes rRNA, not mRNA.
- Confirm D: without ribosomes, protein synthesis is impossible, so the cell dies.
Key Takeaways
- The nucleolus = ribosome assembly.
- Ribosomes are required for translation (protein synthesis).
- Cells that actively secrete proteins (e.g. lymphocytes, plasma cells, pancreatic acinar cells) are especially vulnerable to loss of ribosome production.
- Do not confuse the nucleolus (rRNA/ribosome production) with the rest of the nucleus (DNA → mRNA transcription).
Common Mistakes
- Choosing C because it mentions DNA and mRNA — a tempting trap if you forget that mRNA transcription happens in the nucleoplasm, not the nucleolus.
- Choosing B if you wrongly believe mitochondria are made in the nucleus. Mitochondria are semi-autonomous organelles with their own genome and ribosomes.
- Choosing A by guessing that "no nucleolus = no division", but the question does not require the cells to divide; the cause of death here is loss of protein synthesis, not inability to divide.
Things to Be Careful About
- The nucleolus produces rRNA and assembles ribosomes — it does not transcribe mRNA, tRNA, or protein-coding genes.
- mRNA and tRNA are transcribed by RNA polymerases II and III respectively in the nucleoplasm.
- Lymphocytes are not the only cells affected: any cell that needs protein synthesis would eventually die without ribosomes, but lymphocytes are a classic exam example because of their high antibody output.
Density gradient centrifugation is used to separate cell structures by their relative density. Larger cell structures have greater density and sink further down the centrifuge tube.
What is the correct order of the cell structures, starting from the top of the centrifuge tube?
Options
A chloroplasts nuclei mitochondria ribosomes
B nuclei chloroplasts mitochondria ribosomes
C ribosomes chloroplasts nuclei mitochondria
D ribosomes mitochondria chloroplasts nuclei
Working
In density gradient centrifugation, structures with greater density sediment further down the tube. The question states that larger cell structures have greater density, so the order from the top (least dense, smallest) to the bottom (most dense, largest) is determined by organelle size.
- Ribosomes are the smallest (~20–30 nm).
- Mitochondria are larger (~0.5–1 µm).
- Chloroplasts are larger still (~5–10 µm).
- Nuclei are the largest/densest (~5–10 µm, with dense chromatin).
So from top to bottom: ribosomes → mitochondria → chloroplasts → nuclei.
Answer
D
D
Background Concept
Density gradient centrifugation is a technique used to separate cell components (organelles) on the basis of their size and density. A tube is filled with a sucrose or similar gradient, a homogenised cell sample is layered on top, and the tube is spun at high speed in an ultracentrifuge. Components migrate down the tube until they reach a point where their density matches that of the surrounding gradient; denser (and typically larger) structures travel furthest.
The relative sizes of the major eukaryotic organelles are:
- Ribosome: ~20–30 nm — by far the smallest, a particle of RNA and protein with no surrounding membrane.
- Mitochondrion: ~0.5–1 µm wide, 1–10 µm long — a double-membrane-bound organelle.
- Chloroplast: ~5–10 µm — a double-membrane-bound plastid found in plant cells, often larger and denser than a mitochondrion because of its internal thylakoid membrane stacks and starch granules.
- Nucleus: ~5–10 µm — the largest organelle in most eukaryotic cells, bounded by a nuclear envelope and packed with dense chromatin (DNA + histones).
The question explicitly states that "larger cell structures have greater density", so the order from the top of the tube (smallest, least dense) to the bottom (largest, most dense) mirrors the order of increasing organelle size.
Understanding the Question
The question describes a density gradient centrifugation separation. The stem tells us to assume density increases with size, and asks for the correct top-to-bottom order of four organelles: ribosomes, mitochondria, chloroplasts and nuclei.
This is a multiple-choice question. The command word is implicit — identify the correct sequence. The distractor options are designed to catch candidates who mix up the relative sizes of organelles (especially mitochondria vs chloroplasts vs nuclei) or who misread the principle (e.g. assume smaller = denser).
Approach
Rank the four organelles by size (which the question equates with density), and then read that order from smallest (top) to largest (bottom). The organelle sizes are well-established core knowledge for AS Cell Structure.
Step-by-Step Reasoning
- Ribosomes (~20–30 nm) — these are the smallest structures in the list. They will remain at, or close to, the top of the tube. This immediately eliminates options A and B (which start with chloroplasts or nuclei).
- Mitochondria (~0.5–1 µm) — roughly 20–50× the size of a ribosome, but smaller than a chloroplast or nucleus. They will sediment below ribosomes.
- Chloroplasts (~5–10 µm) — substantially larger than mitochondria, with extensive internal thylakoid membranes and (frequently) starch grains, making them denser still.
- Nuclei (~5–10 µm) — comparable in linear size to chloroplasts but typically the densest organelle because of the highly condensed chromatin and the double nuclear envelope.
Reading this from top to bottom: ribosomes → mitochondria → chloroplasts → nuclei, which is option D.
Key Takeaways
- Density gradient centrifugation separates organelles by size/density; larger, denser structures sediment further.
- Memorise the relative size order of major organelles: ribosome < mitochondrion < chloroplast ≈ lysosome < nucleus.
- The nucleus is the densest organelle in a typical eukaryotic cell because of its chromatin content.
Common Mistakes
- Putting nuclei at the top because the question mentions "density" — confusing the meaning of density here (the question equates density with size, not with intrinsic mass per unit volume).
- Swapping mitochondria and chloroplasts — chloroplasts are noticeably larger and contain starch, so they sediment below mitochondria.
- Forgetting that ribosomes are organelles and assuming they are too small to be separated by this method; in fact they can be pelleted by very high-speed centrifugation and form a distinct upper band.
Things to Be Careful About
- The question stem defines the rule (larger = denser) — you do not need to bring in any external knowledge about organelle composition, only relative size.
- All four of these structures are present in a typical plant cell, so the order is meaningful for a single-cell homogenate — you are not asked to choose organelles that "do not belong" in a plant cell.
- The answer is a letter, not a written list — but on the mark-scheme reasoning, the order ribosomes → mitochondria → chloroplasts → nuclei must be reproduced.
Which cell structures contain nucleic acids?
1 chloroplasts
2 Golgi bodies
3 lysosomes
4 ribosomes
Options
A 1, 2 and 3
B 1, 2 and 4
C 1 and 4 only
D 2, 3 and 4
Working
- Chloroplasts contain their own circular DNA and ribosomes (and therefore mRNA, tRNA, rRNA) for synthesising some of their own proteins. ✓
- Ribosomes are assembled from rRNA (a nucleic acid) bound with ribosomal proteins. ✓
- Golgi bodies modify, sort and package proteins/lipids; they do not contain nucleic acids. ✗
- Lysosomes contain hydrolytic enzymes; they do not contain nucleic acids. ✗
Answer
C
C
Background Concept
Nucleic acids (DNA and RNA) are not confined to the nucleus. Several cytoplasmic organelles either contain DNA of their own (and so transcribe RNA from it) or are themselves built largely from RNA:
- Chloroplasts (and mitochondria) are the remnants of an ancient endosymbiotic bacterium. They carry a small circular chromosome of DNA and their own 70S ribosomes, allowing them to transcribe and translate a limited set of their own proteins. Therefore a chloroplast contains DNA, mRNA, tRNA and rRNA.
- Ribosomes are ribonucleoprotein particles: they are roughly 60% rRNA and 40% protein. The rRNA is a nucleic acid, and during translation the ribosome also threads mRNA and tRNA through itself. So a ribosome is an organelle that physically contains nucleic acids.
- The Golgi apparatus is a stack of flattened cisternae that receives proteins from the rough ER, modifies them (e.g. glycosylation), sorts them and packages them into vesicles. It has no role in storing or transcribing genetic information and contains no DNA or RNA of its own.
- Lysosomes are membrane-bound sacs of hydrolytic enzymes (proteases, lipases, nucleases, glycosidases) that digest material delivered to them. Although one of their enzymes (a nuclease) acts on nucleic acids, the lysosome itself does not contain any DNA or RNA as a structural component.
Understanding the Question
The question lists four organelles and asks which of them contain nucleic acids. The command word is implicit ("Which…"), and the four options are combinations of the four organelles. The candidate has to recall the molecular composition of each organelle and select the combination that lists only those that do contain nucleic acids.
Approach
Go through each organelle in turn and decide "contains nucleic acid? yes/no". The correct option is the one that lists only the "yes" organelles. If any "no" organelle appears in the option, that option is wrong.
Step-by-Step Reasoning
- Chloroplasts — contain DNA (plus the RNA needed to express it). → Yes (1 is correct).
- Golgi bodies — purely a protein-modification/sorting organelle; no DNA, no RNA. → No (2 is wrong wherever it appears).
- Lysosomes — contain digestive enzymes, not nucleic acids. → No (3 is wrong wherever it appears).
- Ribosomes — made of rRNA + protein. → Yes (4 is correct).
The "yes" set is therefore {1, 4} only. That combination corresponds to option C.
Key Takeaways
- Organelles that contain nucleic acids: nucleus, mitochondria, chloroplasts, and ribosomes (because of rRNA).
- Organelles that do not contain nucleic acids: Golgi, lysosomes, smooth and rough ER (despite being studded with ribosomes, the ER membrane itself contains no nucleic acid), peroxisomes, centrioles, and the cytosol (cytosol contains free nucleotides and free tRNA/mRNA in transit, but is not usually classed as "containing nucleic acids" in this MCQ sense — it is not an organelle).
- The endosymbiotic theory explains why chloroplasts and mitochondria, uniquely among non-nuclear organelles, carry their own DNA.
Common Mistakes
- Including the Golgi body because students associate it vaguely with "processing genetic information". The Golgi processes proteins, not nucleic acids.
- Excluding chloroplasts because they "aren't in animal cells". The question is not restricted to animal cells.
- Excluding ribosomes because they are very small. Their rRNA content is exactly what makes a ribosome a ribosome.
- Choosing an option that contains the Golgi or lysosomes; any option including 2 or 3 is wrong.
Things to Be Careful About
- The question asks what an organelle contains, not what an organelle acts on. Lysosomal nucleases act on nucleic acids, but lysosomes do not contain them.
- A ribosome always contains rRNA, regardless of whether it is currently threading an mRNA through it — so it always counts.
- Watch the wording: option C says "1 and 4 only" — both chloroplasts and ribosomes are needed; either alone is insufficient.
The statements describe processes that take place in a secretory cell.
1 Modification of the protein occurs in the Golgi body.
2 mRNA leaves the nucleus.
3 Ribosomes bind to mRNA during translation.
4 Transcription of a specific DNA sequence occurs.
5 Vesicles fuse with the cell surface membrane.
6 Vesicles transport the protein to the Golgi body.
Statement 4 is the first process, and statement 5 is the last process.
What is the correct sequence of the middle four processes?
Options
A 2 3 1 6
B 2 3 6 1
C 3 2 1 6
D 3 2 6 1
Working
In a secretory cell, the correct pathway from gene to secreted protein is:
- Transcription of the DNA sequence (in the nucleus) — given as statement 4 (first process).
- mRNA leaves the nucleus through a nuclear pore — statement 2.
- Ribosomes bind to mRNA at the rough endoplasmic reticulum and translate the message into a polypeptide — statement 3.
- Vesicles transport the protein from the rER to the Golgi body — statement 6.
- Modification of the protein (e.g. glycosylation) occurs in the Golgi body — statement 1.
- Vesicles fuse with the cell surface membrane, releasing the protein by exocytosis — given as statement 5 (last process).
The middle four processes in order are therefore 2 → 3 → 6 → 1.
Answer
B
B
Background Concept
Proteins destined for secretion from a eukaryotic cell (e.g. antibodies from a plasma cell, digestive enzymes from a pancreatic acinar cell, collagen from a fibroblast) are made on ribosomes bound to the rough endoplasmic reticulum (rER) and then processed before release. The full pathway involves several compartments, each performing a specific step:
- Nucleus: site of transcription. A gene (DNA) is copied into a pre-mRNA molecule, which is spliced to mature mRNA and then exported to the cytoplasm through nuclear pores.
- Ribosomes (on rER): bind the mRNA and translate its codons into a polypeptide chain. The growing polypeptide enters the lumen of the rER, where initial folding and modifications (e.g. signal peptide cleavage, N-linked glycosylation) take place.
- Transport vesicle: buds off the rER and carries the protein to the cis face of the Golgi body.
- Golgi body: further modifies the protein (trimming sugars, adding phosphate or sulfate groups), sorts it, and packages it into a secretory vesicle at the trans face.
- Secretory vesicle: moves to the plasma membrane and fuses with it (exocytosis), releasing the protein to the exterior.
The order of these events is fixed by the biology — the cell cannot translate a message before the message is made, and cannot modify a protein in the Golgi before the protein has reached the Golgi.
Understanding the Question
The question provides six statements describing events in a secretory cell. Statements 4 (transcription) and 5 (vesicles fusing with the cell surface membrane) are fixed as the first and last steps. The candidate must arrange statements 2, 3, 6 and 1 in the correct order between them. This is essentially a sequencing question disguised as an MCQ, with each option giving a different permutation of the four middle steps.
Approach
Identify the organelle associated with each statement, then place the statements in the order in which a protein would physically encounter those compartments, starting from the nucleus and ending at the plasma membrane:
- Statement 2 — mRNA leaves the nucleus (between transcription in the nucleus and translation in the cytoplasm).
- Statement 3 — ribosomes bind to mRNA (translation begins; happens after mRNA is in the cytoplasm).
- Statement 6 — vesicles transport the protein to the Golgi (must occur after the protein is made and before the protein can be modified in the Golgi).
- Statement 1 — modification in the Golgi (the last intracellular processing step before exocytosis).
Step-by-Step Reasoning
- Statement 4 (transcription) is fixed as the first step. The DNA is in the nucleus, so it is read first to produce mRNA.
- Statement 2 (mRNA leaves the nucleus) must come next. Newly made mRNA is processed (capped, polyadenylated, spliced) and then exported through a nuclear pore; only then can it be translated.
- Statement 3 (ribosomes bind to mRNA — translation) follows. In a secretory cell, the first ribosome to bind the mRNA is one on the rER, and the resulting polypeptide enters the rER lumen.
- Statement 6 (vesicles transport the protein to the Golgi) must come after translation. The protein is packaged into a COPII-coated transport vesicle that buds from the rER and fuses with the cis face of the Golgi.
- Statement 1 (modification in the Golgi) occurs after the protein has reached the Golgi. Here sugars are trimmed, sulfation or phosphorylation may occur, and the finished protein is sorted into secretory vesicles.
- Statement 5 (vesicles fuse with the cell surface membrane) is fixed as the last step. The secretory vesicle travels to the plasma membrane and undergoes exocytosis.
The middle four steps are therefore 2 → 3 → 6 → 1, which is option B.
Key Takeaways
- The pathway for a secreted protein is fixed: transcription → mRNA export → translation (on rER) → vesicle transport to Golgi → Golgi modification → exocytosis.
- "Transcription" and "translation" are not interchangeable terms — transcription makes mRNA in the nucleus; translation makes a polypeptide on a ribosome in the cytoplasm (or on the rER for secretory proteins).
- The order in which a protein visits organelles is also the order in which the modifications occur; you cannot have Golgi modification (statement 1) before the protein has been transported to the Golgi (statement 6).
Common Mistakes
- Picking C or D (3 before 2): the ribosome cannot bind mRNA before the mRNA is in the cytoplasm, and the mRNA cannot reach the cytoplasm before it has been made and exported. So statement 2 must come before statement 3.
- Picking A (6 before 1 is wrong): A lists 1 before 6, i.e. Golgi modification before transport to the Golgi — biologically impossible.
- Confusing "vesicles transport the protein to the Golgi" (statement 6) with "vesicles fuse with the cell surface membrane" (statement 5): these are two different vesicle events at opposite ends of the secretory pathway.
- Treating the Golgi modification (1) as the final event: in this question the modification step is fixed as one of the middle events, and exocytosis (5) is the last.
Things to Be Careful About
- In a secretory (not a cytoplasmic) protein, translation is performed by ribosomes on the rER, not free cytoplasmic ribosomes — this is what makes statement 3 (ribosomes bind to mRNA) and statement 6 (vesicles to the Golgi) a continuous sequence.
- Statement 1 specifies modification in the Golgi, not translation; do not confuse the two processes.
- Read the question carefully: statements 4 and 5 are already placed; only the middle four (2, 3, 6, 1) need ordering. Each option provides exactly one such ordering, so the answer can be obtained by elimination once the correct logical order is known.
How many types of structures with a double membrane that are found in animal cells are also found in plant cells?
Options
A 1
B 2
C 3
D 4
Working
List the double-membrane organelles present in eukaryotic cells:
- Nucleus (nuclear envelope = two membranes)
- Mitochondrion (outer and inner membrane)
- Chloroplast (outer and inner membrane) — plant cells only
Double-membrane structures in animal cells: nucleus and mitochondrion (2).
Both of these are also present in plant cells.
Chloroplasts are not present in animal cells, so they are not counted.
Answer
B
B
Background Concept
Several eukaryotic organelles are bounded by membranes, and a small subset of these are bounded by two membranes (an envelope), rather than the single membrane that surrounds most other organelles such as the endoplasmic reticulum, Golgi apparatus, lysosomes and vesicles.
The three double-membrane organelles in eukaryotic cells are:
- Nucleus — enclosed by the nuclear envelope, which consists of two phospholipid bilayers separated by a perinuclear space, perforated by nuclear pores.
- Mitochondrion — has an outer membrane (smooth) and a highly folded inner membrane forming cristae, where the electron transport chain and ATP synthase are located.
- Chloroplast — has an outer membrane and an inner membrane enclosing the stroma; the thylakoid membranes inside are a third, separate membrane system and are not counted as the envelope.
Chloroplasts occur only in the cells of photosynthetic organisms (mainly plants and green algae); animal cells never contain them.
Understanding the Question
The question is a comparison: of those structures bounded by a double membrane, how many are shared between animal and plant cells? It is asking for the intersection of the two sets, not the union.
The four answer options (1, 2, 3 or 4) show that more than one double-membrane organelle is involved, so the question is genuinely testing whether you know which are common and which are exclusive.
Approach
- Enumerate double-membrane organelles in eukaryotic cells.
- Mark which of these occur in animal cells.
- Mark which of these occur in plant cells.
- Count those that appear in both lists.
Step-by-Step Reasoning
- Double-membrane organelles: nucleus, mitochondrion, chloroplast.
- Animal cells contain: nucleus, mitochondrion (and many single-membrane organelles such as ER, Golgi, lysosomes, vesicles). They do not contain chloroplasts.
- Plant cells contain: nucleus, mitochondrion, chloroplast (in photosynthetic tissues), plus single-membrane organelles such as ER, Golgi, and a large central vacuole bounded by a single membrane (tonoplast).
- The double-membrane structures present in both animal and plant cells are therefore: nucleus and mitochondrion — 2 structures.
- The third double-membrane organelle, the chloroplast, is excluded because it is absent from animal cells.
Hence the count is 2, corresponding to option B.
Key Takeaways
- Only three eukaryotic organelles are bounded by a double membrane: the nucleus, the mitochondrion and (in photosynthetic cells) the chloroplast.
- The mitochondrion and the nucleus are universal among eukaryotic cells — both animal and plant.
- The chloroplast is the feature that distinguishes a typical plant cell from a typical animal cell at the organelle level; it is the most common wrong answer because students forget that the question is asking about overlap, not about plant-specific features.
Common Mistakes
- Choosing C (3) because chloroplasts are included; this overlooks that the question is restricted to structures found in animal cells.
- Choosing D (4) by mistakenly counting other organelles (e.g. ER, Golgi, lysosomes or vacuoles) as double-membrane structures; these are all bounded by a single membrane.
- Choosing A (1) by considering only the mitochondrion and forgetting the nuclear envelope.
Things to Be Careful About
- The question is about overlap, not about how many double-membrane structures exist overall — read the wording carefully.
- The large central vacuole of plant cells is bounded by one membrane (the tonoplast), not two; do not credit it.
- The thylakoid membranes inside chloroplasts are internal and are not part of the chloroplast envelope, so they do not add an extra "double membrane".
A naturally occurring polysaccharide synthesised in a plant is a branched chain of -glucose.
The straight parts of the molecule are linked by -1,6 glycosidic bonds with only a small number of branches which are linked by either an -1,3 glycosidic bond or an -1,4 glycosidic bond.
Which polysaccharide has a structure most similar to that described?
Options
A amylopectin
B amylose
C cellulose
D glycogen
Working
The polysaccharide described is a plant polysaccharide that is branched and built from α-glucose joined by α-glycosidic bonds.
- A – amylopectin: the branched component of starch (a plant storage polysaccharide); chains of α-glucose with α-1,4 bonds in the straight sections and α-1,6 bonds at branch points. ✓
- B – amylose: the unbranched component of starch; only α-1,4 bonds, no branches. ✗
- C – cellulose: plant polysaccharide, but made of β-glucose joined by β-1,4 bonds, and is unbranched. ✗
- D – glycogen: branched like amylopectin, but it is the animal storage polysaccharide, not a plant one. ✗
Answer
A
A
Background Concept
Polysaccharides are large polymers of monosaccharide units joined by glycosidic bonds. The three storage/structural polysaccharides most commonly compared at AS Level are starch, glycogen and cellulose. Their very different properties come from three structural features: which glucose monomer they use (α or β), the type of glycosidic bond linking the monomers, and the degree of branching.
- Amylose is a long, unbranched chain of α-glucose with α-1,4 glycosidic bonds only. Because it is unbranched the chains can lie close together and form helices, but it does not produce a branched molecule.
- Amylopectin is also a polymer of α-glucose, but it is branched. The straight sections are joined by α-1,4 bonds, while the branch points are α-1,6 bonds. Starch is a mixture of amylose and amylopectin.
- Glycogen has the same bonding pattern as amylopectin (α-1,4 in straight chains, α-1,6 at branch points) but is even more highly branched, with branch points every 8–12 glucose units (compared with every 24–30 in amylopectin). Glycogen is the animal storage polysaccharide, found in liver and muscle cells.
- Cellulose is built from β-glucose linked by β-1,4 glycosidic bonds, producing long, straight, unbranched chains that hydrogen-bond together to form microfibrils. It is a structural plant polysaccharide, not a storage one.
So when a polysaccharide is described as plant-based, branched, and made of α-glucose, the answer points to the branched component of starch — amylopectin.
Understanding the Question
The question stem gives a set of structural clues and asks the candidate to identify which of four polysaccharides (A–D) is described. The key clues are:
- "naturally occurring polysaccharide synthesised in a plant" → rules out glycogen (animal).
- "branched chain of α-glucose" → rules out cellulose (β-glucose, unbranched) and amylose (unbranched).
- Branch points involve α-glycosidic bonds → consistent with amylopectin.
The slightly unusual wording in the question (α-1,6 in the straight parts, with branches via α-1,3 or α-1,4) is not the textbook description, but the combination of features — plant origin, α-glucose, branching, α-glycosidic bonds — uniquely matches amylopectin among the four options.
Approach
Work through the four options systematically, eliminating any that fail one of the diagnostic features:
- Plant origin? → eliminates glycogen.
- α-glucose? → eliminates cellulose.
- Branched? → eliminates amylose.
The only option that satisfies all three is amylopectin.
Step-by-Step Reasoning
- Identify the source of the polysaccharide. The stem says it is "synthesised in a plant". Glycogen (D) is found in animals (liver and muscle), so D is eliminated immediately.
- Identify the monomer. The polysaccharide is built from α-glucose. Cellulose (C) is built from β-glucose, so C is eliminated.
- Identify the degree of branching. The molecule is described as "branched". Amylose (B) is a long, unbranched chain of α-glucose joined only by α-1,4 bonds, so B is eliminated.
- Confirm the best match. The remaining option, amylopectin (A), is the branched component of plant starch, made of α-glucose with α-1,4 bonds in straight regions and α-1,6 bonds at branch points. This is the only polysaccharide among the four that is a plant polymer of α-glucose and is branched.
Key Takeaways
- The four major polysaccharides to compare at AS Level are amylose, amylopectin, glycogen and cellulose.
- Amylose = plant, unbranched, α-1,4 only.
- Amylopectin = plant, branched, α-1,4 in straight regions, α-1,6 at branch points.
- Glycogen = animal, very highly branched, same bonding pattern as amylopectin but more branch points.
- Cellulose = plant, unbranched, β-1,4 bonds, β-glucose.
- A quick "three-question filter" (plant or animal? α- or β-glucose? branched or not?) is enough to separate all four.
Common Mistakes
- Confusing amylopectin and glycogen. Both are branched α-glucose polymers; the only difference is the frequency of branching and the organism. If the stem says "plant", glycogen is the wrong answer.
- Confusing α- and β-glucose. Cellulose uses β-glucose, so any question mentioning α-glucose rules cellulose out.
- Choosing amylose because it is also a plant polysaccharide. Amylose is the unbranched component of starch, so it fails the "branched" criterion.
Things to Be Careful About
- Read the stem carefully: the question highlights plant origin, branching, and α-glucose as the diagnostic features. The exact placement of α-1,6 vs α-1,4 bonds in this particular wording is unusual; do not be thrown off — match on the overall combination of features, not on every bond detail.
- "Naturally occurring" is a clue, not a trick: all four options are naturally occurring, so it is the other features that discriminate.
- Be ready to distinguish branching frequency: glycogen is "more branched" than amylopectin, a common follow-up distinction.
The diagram shows a triglyceride.
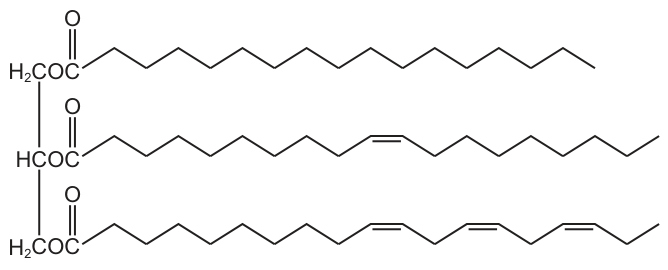
An enzyme was used to digest this triglyceride into glycerol and fatty acids.
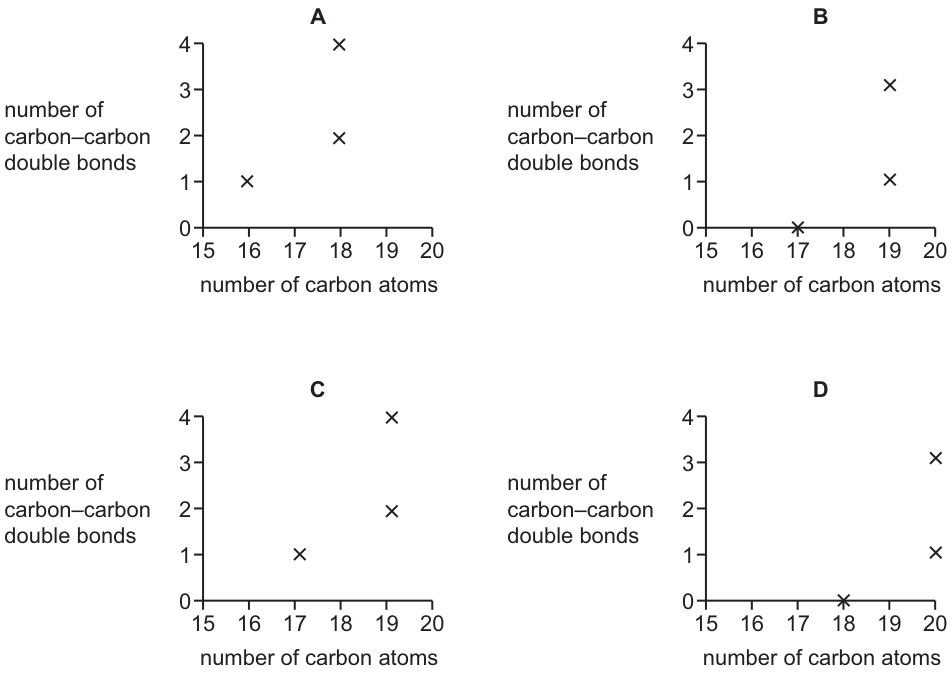
Which scatter plot correctly represents each fatty acid component of the triglyceride?
Options
Working
The triglyceride shown is made of a glycerol backbone bonded to three fatty acid chains. On digestion, it yields three fatty acids differing in chain length and degree of unsaturation:
- Top chain — saturated, 0 C=C double bonds, 17 carbon atoms → point
- Middle chain — 1 C=C double bond, 19 carbon atoms → point
- Bottom chain — 3 C=C double bonds, 19 carbon atoms → point
The scatter plot must show one point at , one at and one at . Only option B has these three coordinates.
Answer
B
B
Background Concept
A triglyceride is an ester formed from one glycerol molecule (a 3-carbon alcohol) and three fatty acid molecules. Each fatty acid is a long hydrocarbon chain with a carboxyl group at one end; in a triglyceride this carboxyl group has reacted with a hydroxyl of glycerol to form an ester bond.
A fatty acid is characterised by two structural features:
- Chain length — the number of carbon atoms in the chain. Typical biological fatty acids have 4–28 carbons; 16–20 is most common.
- Degree of unsaturation — the number of carbon–carbon double bonds (C=C). A chain with no double bonds is saturated; one double bond gives monounsaturated; two or more give polyunsaturated.
The y-axis of the scatter plot here ("number of carbon–carbon double bonds") is therefore a measure of saturation, while the x-axis ("number of carbon atoms") is a measure of chain length.
Understanding the Question
The diagram shows a single triglyceride with three distinct fatty acid components. After digestion (e.g. by a lipase), those three fatty acids are released unchanged in terms of their carbon skeleton. The question asks which scatter plot correctly represents each fatty acid component — i.e. which plot has three points, one for each of the three fatty acids, plotted at (carbon count, double-bond count).
The command is selection, but the underlying skill is to read the structure carefully and extract two numerical properties per chain.
Approach
For each of the three fatty acid chains in the triglyceride, count:
- The number of C=C double bonds — look for parallel lines in the chain.
- The total number of carbon atoms — count every vertex in the skeletal (zigzag) formula, including the carbonyl carbon of the ester group.
Then match each (carbons, double bonds) pair to a point on the scatter plot.
Step-by-Step Reasoning
Identify the three chains
Reading the triglyceride from top to bottom:
- Top chain: no double bonds in the chain → saturated → 0 C=C double bonds. Counting the vertices in the zigzag including the carbonyl carbon gives 17 carbons.
- Middle chain: exactly one C=C double bond (shown as a parallel line near the middle of the chain) → 1 double bond. The chain is longer; counting vertices including the carbonyl carbon gives 19 carbons.
- Bottom chain: three C=C double bonds → polyunsaturated → 3 double bonds. The chain extends to the same length as the middle chain; counting vertices gives 19 carbons.
Convert to coordinates
Each fatty acid becomes one (x, y) point where x = carbons and y = double bonds:
- Top →
- Middle →
- Bottom →
Match to the options
- A — points at , , . Wrong x-values and wrong y-values (none of 0, 1, 3 appear correctly together).
- B — points at , , . Exactly matches the three coordinates derived above. ✔
- C — points at , , . Wrong y-values (no 0; bottom chain has 3, not 4 double bonds).
- D — points at , , . Wrong x-values (over-counts carbons by one for every chain).
Key Takeaways
- A triglyceride yields three fatty acids on digestion, each retaining its own chain length and degree of unsaturation.
- In a skeletal formula, every vertex and every chain end is a carbon atom, and you must count the carbonyl carbon too — this is where options B and D (which differ by exactly one carbon in every chain) most easily trip students up.
- A saturated chain has 0 C=C double bonds; each parallel line in the chain represents one C=C.
- The y-coordinate (saturation) and x-coordinate (chain length) are independent properties — the question tests both reading skills at once.
Common Mistakes
- Ignoring the carbonyl carbon when counting: this systematically under-counts by one, and is the most common reason students pick option B-style answers but get the wrong option (e.g. choosing D instead of B, or vice-versa).
- Counting only the saturated chain correctly and assuming the other two are the same length: in this triglyceride the saturated chain is shorter (17 C) than the two unsaturated chains (19 C each).
- Misreading the double-bond pattern: it is easy to miss the third double bond in the bottom chain because the multiple bends can look like one continuous feature.
- Confusing "double bonds" with "bends in the chain": a cis double bond produces a bend in the zigzag, but not every bend is a double bond — only pairs of parallel lines count.
Things to Be Careful About
- Use a finger or pen to trace each chain from the ester oxygen all the way to the terminal methyl, counting every kink as a carbon.
- When in doubt between two options that differ only in x-values, re-count the carbons one vertex at a time — this is the single largest source of error here.
- Do not assume all fatty acids in a triglyceride have the same chain length; triglycerides typically contain a mixture.
The diagram shows how the alternating nature of -glucose monomers along a chain allows hydrogen bonds to form between consecutive monomers.
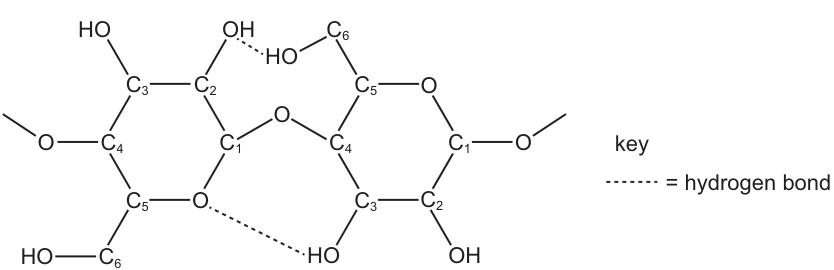
Hydrogen bonds in cellulose affect the tensile strength (the ability to withstand pulling forces without breaking).
How do the hydrogen bonds shown in the diagram help cellulose function as a suitable material for a cell wall?
Options
A The hydrogen bonds add additional tensile strength along individual cellulose molecules within the cell wall.
B The hydrogen bonds create stronger crosslinks between adjacent cellulose molecules, adding to the tensile strength of the cell wall.
C Stronger hydrogen bonds form between adjacent cellulose molecules, adding to the tensile strength of the cell wall.
D Cellulose molecules within a cellulose microfibril have a stronger link between them, increasing the tensile strength of the cellulose microfibrils.
Working
The diagram shows dotted hydrogen bonds forming between the –OH groups of consecutive β-glucose monomers that are part of the same cellulose chain (e.g. between the C6 –OH of one monomer and the oxygen of the glycosidic bond of the next). These are therefore hydrogen bonds along a single cellulose molecule, not between separate cellulose molecules.
- A: H-bonds add tensile strength along individual cellulose molecules — matches what is shown. ✓
- B: describes crosslinks between adjacent cellulose molecules — not what the diagram shows. ✗
- C: same as B — inter-chain H-bonds, not depicted. ✗
- D: also describes inter-chain links within a microfibril — not depicted. ✗
Answer
A
A
Background Concept
Cellulose is a structural polysaccharide made of β-glucose monomers joined by β-1,4-glycosidic bonds. Because each successive glucose is rotated 180° relative to its neighbour, the –OH groups on carbons 2, 3 and 6 of one monomer are positioned close to oxygen-containing groups on the adjacent monomer. This geometry allows hydrogen bonds to form between hydroxyl/oxygen groups of consecutive monomers along the same chain.
A second, distinct set of hydrogen bonds forms between parallel cellulose chains, holding many chains together into microfibrils and then macrofibrils. It is these inter-chain H-bonds, together with the covalent glycosidic bonds, that give plant cell walls their high tensile strength. The trick in this question is to look at exactly which H-bonds the diagram depicts, because the answer depends on that.
Understanding the Question
The question asks specifically about the hydrogen bonds shown in the diagram. The diagram shows dotted lines connecting the –OH on C6 of one β-glucose to the oxygen of the glycosidic bond of the next, and the –OH on C2 to the –OH on C6 of the next. All of these dotted lines lie between consecutive monomers of the same cellulose chain.
The command word is "how", and the options are written so that three of them describe H-bonds between separate cellulose molecules (inter-chain), while only one describes H-bonds within a single cellulose molecule (intra-chain).
Approach
Identify which H-bonds the diagram actually shows (intra-chain), then pick the option that correctly attributes tensile strength to that same set of bonds. Reject any option that describes H-bonds between cellulose molecules, because the diagram does not show those.
Step-by-Step Reasoning
- Read the diagram: two β-glucose units joined by a glycosidic bond, with the second flipped 180°. Dotted lines (H-bonds) run between –OH/–O groups on adjacent monomers within the same chain.
- Option A states the H-bonds add tensile strength along individual cellulose molecules. This matches the diagram — the bonds are running along one cellulose chain.
- Option B says the H-bonds create crosslinks between adjacent cellulose molecules. The diagram shows only one chain, so this cannot be the answer.
- Option C again describes H-bonds between adjacent molecules — the same problem as B.
- Option D describes stronger links between cellulose molecules within a microfibril. This is inter-chain and also not what the diagram shows.
- Therefore A is the only answer consistent with the bonds actually drawn.
(Note: the inter-chain H-bonds described in B, C and D do exist in real cellulose and do contribute to cell-wall strength — but they are not the bonds the question is asking about. The question is deliberately testing whether the candidate can identify the H-bonds in the diagram.)
Key Takeaways
- Cellulose has two distinct sets of hydrogen bonds: intra-chain (between consecutive β-glucose monomers in one chain) and inter-chain (between parallel cellulose chains in a microfibril).
- In MCQs, always read which feature the question is asking about — here, "the hydrogen bonds shown in the diagram".
- Structure–function link: the regular, alternating arrangement of β-glucose monomers is what allows both kinds of H-bonds to form, producing long, straight, strong chains suitable for cell walls.
Common Mistakes
- Choosing B, C or D because "cellulose has H-bonds between chains" is true in general — but the diagram does not show those, and the question is about the bonds shown.
- Confusing the H-bonds shown in the diagram with the covalent β-1,4-glycosidic bonds that actually join the monomers into a chain.
- Thinking that "stronger" (option C) automatically makes an answer correct, without checking whether the description matches what is depicted.
Things to Be Careful About
- Read MCQ options word-for-word: the position of "along" vs. "between" determines whether the H-bonds are intra- or inter-chain.
- Remember that there are two kinds of cellulose H-bonds in reality; the question restricts you to the ones in the printed figure.
- A "cell wall" in this question is shorthand for the cellulose-rich wall — the property being explained (tensile strength) ultimately belongs to the wall, but the immediate mechanism is the H-bond described in the option.
Two solutions, 1 and 2, each contained a mix of two different biological molecules. One solution contained starch and sucrose, and the other contained glucose and protein.
The two solutions were tested with a variety of reagents to identify the presence of the biological molecules in the solution.
The table shows the results recorded for the various tests.
Which row identifies the two solutions?
Options
| add iodine solution | boil with Benedict's solution | boil with Benedict's solution after acid hydrolysis | add biuret solution | |||||
|---|---|---|---|---|---|---|---|---|
| 1 | 2 | 1 | 2 | 1 | 2 | 1 | 2 | |
| A | ✓ | ✗ | ✓ | ✗ | ✗ | ✓ | ✗ | ✓ |
| B | ✗ | ✓ | ✓ | ✗ | ✓ | ✗ | ✗ | ✓ |
| C | ✓ | ✗ | ✗ | ✓ | ✓ | ✓ | ✗ | ✓ |
| D | ✗ | ✓ | ✗ | ✓ | ✓ | ✓ | ✓ | ✗ |
key
✓ = positive result
✗ = negative result
Working
Predicted results for each mixture:
-
Starch + sucrose:
- iodine: ✓ (blue-black, starch present)
- Benedict's (direct boil): ✗ (sucrose is non-reducing, starch is non-reducing)
- Benedict's after acid hydrolysis: ✓ (sucrose hydrolysed to glucose + fructose, both reducing)
- biuret: ✗ (no protein)
-
Glucose + protein:
- iodine: ✗ (no starch)
- Benedict's (direct boil): ✓ (glucose is a reducing sugar)
- Benedict's after acid hydrolysis: ✓ (glucose still present)
- biuret: ✓ (protein present)
Matching to the options:
| iodine | Benedict's | after hydrolysis | biuret | |
|---|---|---|---|---|
| starch + sucrose | ✓ | ✗ | ✓ | ✗ |
| glucose + protein | ✗ | ✓ | ✓ | ✓ |
Row C gives exactly this pattern (Solution 1 = starch + sucrose, Solution 2 = glucose + protein).
Answer
C
C
Background Concept
Four standard reagent tests identify the main biological molecules:
- Iodine solution detects starch: in the presence of starch, the brown/yellow iodine turns blue-black. It does not react with sugars or proteins.
- Benedict's solution (boiled) detects reducing sugars such as glucose: a positive result is a brick-red precipitate of copper(I) oxide. Sucrose is non-reducing because its glycosidic bond joins the two anomeric carbons, leaving no free aldehyde/ketone group, so it gives a negative Benedict's test directly.
- Acid hydrolysis followed by Benedict's is used to detect non-reducing sugars. Boiling with dilute HCl hydrolyses the glycosidic bond in sucrose, producing glucose and fructose — both reducing — which then give a positive Benedict's result after neutralisation.
- Biuret solution detects peptide bonds (proteins): a positive result is a violet/lilac colour. It does not react with starch or sugars.
Understanding the Question
We have two unknown solutions, each containing one of two mixtures:
- Mixture A: starch + sucrose
- Mixture B: glucose + protein
Four tests have been carried out on each solution (iodine, Benedict's direct, Benedict's after acid hydrolysis, biuret), and we are given the pattern of ✓ (positive) and ✗ (negative) results in a table. We must match the results to the two mixtures.
Approach
- Decide the expected result of each test on each pure molecule (starch, sucrose, glucose, protein).
- Combine the expected results for each mixture.
- Compare both mixture patterns to the answer options and find the matching row.
Step-by-Step Reasoning
Step 1 — Expected test outcomes for each molecule:
| molecule | iodine | Benedict's (direct) | Benedict's after hydrolysis | biuret |
|---|---|---|---|---|
| starch | ✓ | ✗ | ✗* | ✗ |
| sucrose | ✗ | ✗ | ✓ | ✗ |
| glucose | ✗ | ✓ | ✓ | ✗ |
| protein | ✗ | ✗ | ✗ | ✓ |
(*Hydrolysis of starch produces glucose, so a Benedict's test after hydrolysis of pure starch is in fact positive. However, in this question the starch is mixed with sucrose, so any positive Benedict's after hydrolysis is more safely attributed to sucrose.)
Step 2 — Combined pattern for each mixture:
- Starch + sucrose: iodine ✓ (starch); Benedict's ✗ (neither is reducing); Benedict's after hydrolysis ✓ (sucrose hydrolysed); biuret ✗ (no protein).
- Glucose + protein: iodine ✗; Benedict's ✓ (glucose); Benedict's after hydrolysis ✓ (glucose still present); biuret ✓ (protein).
Step 3 — Match to the options:
Reading the table headers, "1" and "2" are the two solutions. We need one column pair to match the starch+sucrose pattern (✓ ✗ ✓ ✗) and the other to match the glucose+protein pattern (✗ ✓ ✓ ✓).
- A: solution 1 = ✓ ✓ ✗ ✗; solution 2 = ✗ ✗ ✓ ✓ — neither pattern fits.
- B: solution 1 = ✗ ✓ ✓ ✗; solution 2 = ✓ ✗ ✗ ✓ — biuret is positive for solution 2, but biuret is negative for both starch and sucrose, so a biuret-positive mixture must contain protein.
- C: solution 1 = ✓ ✗ ✓ ✗ — exactly the starch+sucrose pattern; solution 2 = ✗ ✓ ✓ ✓ — exactly the glucose+protein pattern. ✓
- D: solution 1 = ✗ ✗ ✓ ✓; solution 2 = ✓ ✓ ✓ ✗ — solution 2 shows Benedict's positive before hydrolysis, ruling out a pure starch+sucrose mix.
Therefore the correct row is C.
Key Takeaways
- Iodine is specific for starch; biuret is specific for peptide bonds (protein).
- Benedict's alone detects only reducing sugars; a negative Benedict's followed by a positive Benedict's after acid hydrolysis is the diagnostic two-step for a non-reducing sugar such as sucrose.
- A solution containing both a reducing and a non-reducing sugar will be positive in both Benedict's tests (reducing sugar gives the direct result; non-reducing sugar only shows after hydrolysis).
Common Mistakes
- Forgetting that sucrose is non-reducing — many students assume all sugars reduce Benedict's, which would rule out the correct answer.
- Forgetting to neutralise the acid before re-testing with Benedict's; in practice the acid must be neutralised with sodium hydrogencarbonate, but for the purposes of predicting the result, hydrolysis converts sucrose into reducing sugars.
- Assuming Benedict's after hydrolysis detects protein or starch — it detects sugars produced from hydrolysis of any carbohydrate present.
- Reading the table headers in the wrong order: the columns "1" and "2" alternate, so it is easy to misread a row.
Things to Be Careful About
- The "key" defines ✓ as positive and ✗ as negative; do not invert these.
- A positive Benedict's after hydrolysis does not by itself prove a non-reducing sugar is present — it simply confirms that a reducing sugar is present after hydrolysis. The diagnostic feature is a negative direct Benedict's followed by a positive post-hydrolysis Benedict's.
- For mixture B (glucose + protein), Benedict's after hydrolysis is positive simply because glucose is still present; the hydrolysis step is redundant but does not make the result negative.
The diagrams show parts of three pairs of amino acids within a protein.
The pairs are labelled X, Y and Z.

Which row shows the correct type of interaction that would occur between the two amino acids in each pair?
Options
| X | Y | Z | |
|---|---|---|---|
| A | hydrophobic interaction | hydrophobic interaction | hydrogen bond |
| B | hydrogen bond | hydrophobic interaction | ionic bond |
| C | hydrogen bond | hydrogen bond | hydrogen bond |
| D | hydrophobic interaction | hydrogen bond | ionic bond |
Working
- X: both side chains carry hydroxyl () groups; the partially positive H of one is attracted to the lone pair on the partially negative O of the other, forming a hydrogen bond.
- Y: both side chains are non-polar methyl () groups; these cluster together away from water, forming a hydrophobic interaction.
- Z: one side chain is positively charged () and the other is negatively charged (); opposite charges attract electrostatically, forming an ionic bond.
Answer
B
B
Background Concept
Amino acids differ only in their side chains (R-groups), and it is the chemistry of these R-groups that determines how a folded protein is held together in its 3D shape. The three non-covalent interactions most commonly tested at AS level are:
- Hydrogen bond — forms between a hydrogen atom that is covalently bonded to a strongly electronegative atom (O, N or F) and another electronegative atom carrying a lone pair. Classic protein example: between the of serine/threonine/tyrosine side chains, or between and groups.
- Hydrophobic interaction — non-polar R-groups (those made mainly of C and H, e.g. the methyl of alanine or the benzyl ring of phenylalanine) cannot form H-bonds and do not interact favourably with water. They cluster together in the interior of globular proteins to minimise contact with the aqueous solvent.
- Ionic bond (salt bridge / electrostatic interaction) — forms between R-groups that carry full positive and negative charges at physiological pH, e.g. the protonated amine of lysine and the carboxylate (or ) of aspartate or glutamate.
The same chemistry applies to amino acids shown as their free side chains: look at the R-group drawn, decide if it is polar (O or N present, often with H), fully charged, or purely hydrocarbon.
Understanding the Question
The question displays the R-groups of three pairs of amino acid residues within a polypeptide and asks you to identify the type of bonding/interaction that would form between the two R-groups in each pair.
- Pair X: each side chain shows an (hydroxyl) group — a polar, uncharged, H-bond-capable group.
- Pair Y: each side chain shows a (methyl) group attached to additional C/H — entirely non-polar.
- Pair Z: one side chain shows a protonated amine (positive) and the other a deprotonated oxygen (negative) — fully charged.
The command word is effectively "identify", and only one of the four rows (A–D) has the correct interaction for all three pairs.
Approach
Match the R-group chemistry to the standard bond type:
- Both R-groups polar and contain O–H or N–H → hydrogen bond.
- Both R-groups non-polar (only C and H) → hydrophobic interaction.
- One R-group fully positive and the other fully negative → ionic bond.
Step-by-Step Reasoning
- X (–OH with –OH): The oxygen in is strongly electronegative, drawing electron density away from the bonded H and leaving the H δ⁺. The O of the second carries lone pairs (δ⁻). The δ⁺ H of one hydroxyl is attracted to the δ⁻ O of the other — a textbook hydrogen bond.
- Y (–CH₃ with –CH₃): Neither carbon nor hydrogen is significantly electronegative; there is no δ⁺/δ⁻ to drive dipole-based bonding. In water, these non-polar groups are forced together to minimise the disruption of hydrogen bonding in the surrounding water. This is a hydrophobic interaction.
- Z (–NH₃⁺ with –O⁻): The amine has accepted a proton to become a permanent positive charge; the oxygen has lost a proton to become a permanent negative charge. Coulombic attraction between two full opposite charges is an ionic bond (salt bridge).
Comparing with the options:
- A: hydrophobic, hydrophobic, hydrogen — wrong for X (which is polar) and wrong for Z (which is ionic).
- B: hydrogen, hydrophobic, ionic — matches X, Y, Z exactly. ✓
- C: hydrogen, hydrogen, hydrogen — wrong for Y (non-polar) and wrong for Z (charges, not just polar).
- D: hydrophobic, hydrophobic, ionic — wrong for X (it is polar, not hydrophobic).
Key Takeaways
- Identify the R-group, then classify it as: (i) polar uncharged, (ii) non-polar, or (iii) fully charged (+ or −).
- Polar uncharged ↔ polar uncharged → hydrogen bond.
- Non-polar ↔ non-polar → hydrophobic interaction.
- Positive ↔ negative → ionic bond.
- The same R-group can give different interactions depending on its partner: with is H-bonding, but (deprotonated) with is ionic.
Common Mistakes
- Treating all polar groups the same: an is not the same as an . The former is charged and gives an ionic interaction; the latter is polar but uncharged and gives a hydrogen bond.
- Calling the pair a "hydrogen bond" because C–H bonds look like they contain hydrogen — but C and H have similar electronegativities, so no significant dipole exists.
- Confusing hydrophobic interactions with covalent bonds or van der Waals forces; in A-level biology the term "hydrophobic interaction" is the accepted description for non-polar R-group clustering.
Things to Be Careful About
- Always read the actual charges on the diagram, not the underlying amino acid name: serine has (H-bond) but if the oxygen is shown as it is ionic.
- In multiple-choice questions, check the whole row — a single wrong entry in a row eliminates that option, even if the other two are correct.
- Distinguish "hydrogen bond" (a specific dipole–dipole attraction involving H bonded to N/O/F) from a generic polar interaction.
A student carried out investigations at pH 1–8 to look at the effect of pH on an enzyme-catalysed reaction.
The optimum condition for this enzyme is the acidic environment of the stomach at pH 1–2.
The remaining substrate concentration was measured after five minutes at each different pH.
Which graph shows the effect of increasing pH on substrate concentration remaining after five minutes?
Options
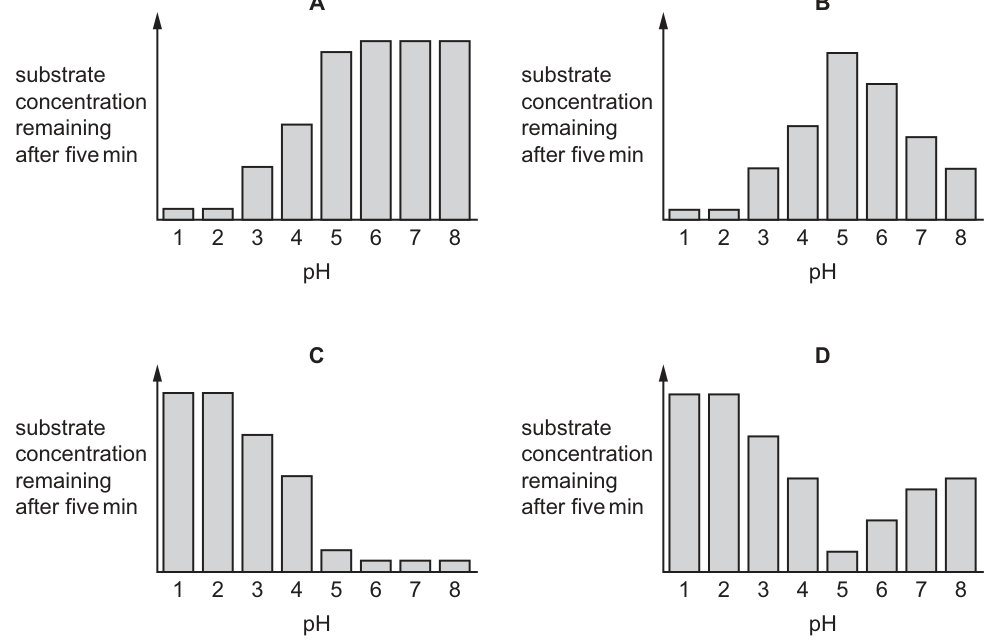
Working
At the optimum pH (1–2, the stomach environment), the enzyme's active site has the correct tertiary structure and ionisation, so the rate of reaction is highest. Most substrate is broken down in 5 minutes, leaving a very low remaining substrate concentration at pH 1–2.
As pH moves further from the optimum, ionic and hydrogen bonds that maintain the tertiary structure are disrupted, the active site loses its specific shape, and enzyme activity falls. Less substrate is broken down, so more remains. By pH 5–8 the enzyme is essentially denatured/non-functional, and almost all of the original substrate is left — the remaining substrate concentration plateaus at a high level.
Therefore the graph must show: very low bars at pH 1–2, rising through pH 3–5, and a high plateau from pH 5–8.
Answer
A
A
Background Concept
Enzymes are globular proteins whose catalytic activity depends on the precise 3-D shape of their active site. That shape is held in place by a network of weak bonds — hydrogen bonds, ionic bonds and hydrophobic interactions — together with any disulfide bridges. Changes in pH alter the ionisation of acidic and basic side chains (e.g. –COOH and –NH₂ groups), which breaks these bonds and distorts the active site. Once the shape is lost, the substrate can no longer bind effectively: the enzyme is said to be denatured and the reaction rate falls sharply.
Every enzyme has an optimum pH at which its tertiary structure, and therefore its active site, fits the substrate best. For pepsin and other gastric proteases that work in the stomach, the optimum is around pH 1–2. For most cytoplasmic enzymes it is around pH 7, and for trypsin (in the small intestine) it is around pH 8. Away from the optimum the rate falls; if the pH shift is large or prolonged, denaturation is irreversible.
A second key idea: in this experiment the student measures substrate remaining after 5 minutes, not rate directly. A low remaining concentration means the enzyme has been working fast (most substrate has been converted to product). A high remaining concentration means the enzyme is barely working.
Understanding the Question
The stem tells us three things:
- The enzyme works best at pH 1–2 (stomach pH).
- The student measured substrate concentration remaining after a fixed 5-minute reaction at pH 1, 2, 3 … 8.
- We must choose the bar graph whose shape is consistent with these facts.
The command word is implicit ("which graph shows…") — the task is to interpret the expected biology and match it to the figure.
Approach
Translate "optimum pH = 1–2" into a prediction about the bar heights, then read each option:
- At pH 1–2 → enzyme most active → most substrate used up → bars must be lowest.
- As pH increases past 2 → activity falls → less substrate used → bars rise.
- At pH ~5 onwards → enzyme denatured/inactive → almost no substrate used → bars plateau at a high value.
The correct graph is therefore the one showing a low → high transition with a high plateau from pH 5–8.
Step-by-Step Reasoning
- Option A: Very short bars at pH 1 and 2, then a step-up at pH 3, 4 and 5, and a tall plateau from pH 5 to 8. This matches the prediction exactly: the enzyme is highly active at its acidic optimum (almost all substrate broken down) and effectively inactive by pH 5 (almost all substrate left). ✓
- Option B: A bell-shaped pattern with the minimum bar at pH 5. This would describe an enzyme whose optimum was pH 5, not pH 1–2. ✗
- Option C: Tall bars at pH 1–2, falling to a low plateau at pH 5–8. This is the reverse of what we expect — it would describe an enzyme that works best at basic pH (e.g. trypsin at pH 8) and is denatured in acid. ✗
- Option D: High at the extremes, minimum at pH 5. This pattern has no biological meaning for a single enzyme with one optimum, and in particular does not place the minimum at pH 1–2. ✗
Hence A is correct.
Key Takeaways
- The "optimum pH" of an enzyme is the pH at which its active site is correctly shaped and the reaction rate is maximum.
- Away from the optimum, the active-site shape is distorted and the rate falls; far from the optimum the enzyme denatures.
- The measure chosen changes how the graph looks: plotting rate gives a bell curve peaking at the optimum, whereas plotting substrate remaining gives an inverted bell (lowest at the optimum, high plateau at extremes). This question uses the latter.
- Always read both axes of a graph carefully — here the y-axis is substrate remaining, the opposite of reaction rate, so the expected shape is inverted relative to the familiar enzyme-rate-vs-pH bell curve.
Common Mistakes
- Inverting the y-axis: Assuming that "low bar = slow reaction" rather than "low bar = lots of substrate broken down, so the reaction was fast".
- Choosing C: Picking the option where the lowest bars are at high pH, because the student "remembers" pH 1–2 being the answer without thinking through which way the substrate will go.
- Choosing B or D: Confusing the optimum pH with the pH at which substrate remains highest (or lowest) without linking it to the enzyme's activity.
- Forgetting that, far from the optimum, denaturation is essentially complete and the bar height plateaus rather than continuing to rise.
Things to Be Careful About
- The same data plotted as rate of reaction would peak at pH 1–2; plotted as substrate remaining it is at its lowest at pH 1–2. Always check the y-axis label before drawing conclusions.
- "Optimum pH" refers to maximum activity, not maximum stability — some enzymes are stable across a wide pH range but only active at one pH.
- Irreversible denaturation at extreme pH means the plateau region (here pH 5–8) should be essentially flat, not still rising.
Which statement is correct for a non-competitive inhibitor?
Options
A The inhibitor binds to the active site of the enzyme and decreases .
B The inhibitor binds away from the active site and increases the Michaelis–Menten constant.
C The inhibitor decreases , but the Michaelis–Menten constant does not change.
D The inhibitor does not change but increases the Michaelis–Menten constant.
Working
A non-competitive inhibitor binds to a site other than the active site (an allosteric site), altering the shape of the active site so substrate can no longer bind effectively.
- This means substrate concentration cannot overcome the inhibition by out-competing the inhibitor, so the maximum rate () decreases.
- The enzymes that remain functional still bind substrate with the same affinity, so the Michaelis–Menten constant () is unchanged.
Checking the options:
- A — describes a competitive inhibitor (binds active site) — wrong.
- B — non-competitive binding is correct, but is unchanged, not increased — wrong.
- C — decreases and is unchanged — correct.
- D — the reverse of the true effect — wrong.
Answer
C
C
Background Concept
Enzyme inhibitors reduce the rate of an enzyme-catalysed reaction. They are classified mainly by where they bind and how that affects enzyme kinetics.
- Competitive inhibitors bind to the active site, directly competing with the substrate. Increasing substrate concentration can out-compete the inhibitor, so is reached eventually but a higher substrate concentration is needed to do so. The apparent affinity decreases: increases, while is unchanged.
- Non-competitive inhibitors bind to a site away from the active site (an allosteric site). Binding alters the tertiary structure of the enzyme so the active site no longer works. Because the inhibitor does not compete with substrate, raising [substrate] cannot overcome the effect; the inhibited enzyme molecules are simply lost from the active pool. The result is that decreases, but the remaining functional enzyme molecules still bind substrate normally, so is unchanged.
The Michaelis–Menten constant is (informally) the substrate concentration at which the reaction rate is half of ; it is inversely related to the affinity of the enzyme for its substrate.
Understanding the Question
This is a single-best-answer multiple choice question asking which statement correctly describes a non-competitive inhibitor. We are tested on two pieces of knowledge:
- Where the inhibitor binds.
- How it changes the two key kinetic parameters, and .
The four options mix the binding site with the kinetic effects, and we need the option that pairs them correctly for a non-competitive inhibitor.
Approach
Recall the defining kinetic signature of a non-competitive inhibitor: falls, is unchanged. Then check each option for the correct pairing of binding site and kinetic effect.
Step-by-Step Reasoning
- Option A says the inhibitor binds to the active site and decreases . Binding to the active site is the definition of a competitive inhibitor (which, by definition, does not change because high [substrate] overcomes it). Eliminate A.
- Option B says the inhibitor binds away from the active site (correct) and increases (incorrect). An increase in is the hallmark of a competitive inhibitor, not a non-competitive one. Eliminate B.
- Option C says the inhibitor decreases and leaves unchanged. This is exactly the kinetic signature of a non-competitive inhibitor: by removing some enzyme molecules from the active pool, the maximum rate drops, but each remaining functional active site still has the same affinity for its substrate. C is correct.
- Option D says the inhibitor does not change but increases — this is the kinetic profile of a competitive inhibitor, so D is wrong.
Key Takeaways
- Competitive inhibitor → binds active site → unchanged, increases.
- Non-competitive inhibitor → binds allosteric site → decreases, unchanged.
- reports the affinity of the functional enzyme population; a non-competitive inhibitor does not change how the remaining active enzymes bind substrate.
Common Mistakes
- Confusing the kinetic effects of competitive and non-competitive inhibitors — students often say "non-competitive inhibitors increase " because is associated with inhibition in general, but only competitive inhibition changes .
- Thinking a non-competitive inhibitor binds to the active site — it does not; it binds elsewhere.
- Forgetting that substrate concentration can overcome a competitive (but not a non-competitive) inhibitor, which is why is reached only with competitive inhibition.
Things to Be Careful About
- A useful mental test: "Does adding more substrate rescue the rate?" If yes, the inhibitor is competitive ( rises, unchanged). If no, it is non-competitive ( falls, unchanged).
- Make sure (maximum velocity) and (the Michaelis–Menten constant reflecting substrate affinity) are not swapped in memory: a high means low affinity.
Pyrophosphatase enzymes catalyse a hydrolysis reaction.
In experiment 1, a scientist studied the rate of this reaction, using a colorimeter.
The absorbance of the solution was measured at regular intervals until all of the pyrophosphate ions had been converted into phosphate ions.
In experiment 2, the scientist repeated the procedure with a higher concentration of pyrophosphatase. All other variables were standardised.
Which graph shows the effect of increasing the concentration of pyrophosphatase?
Options
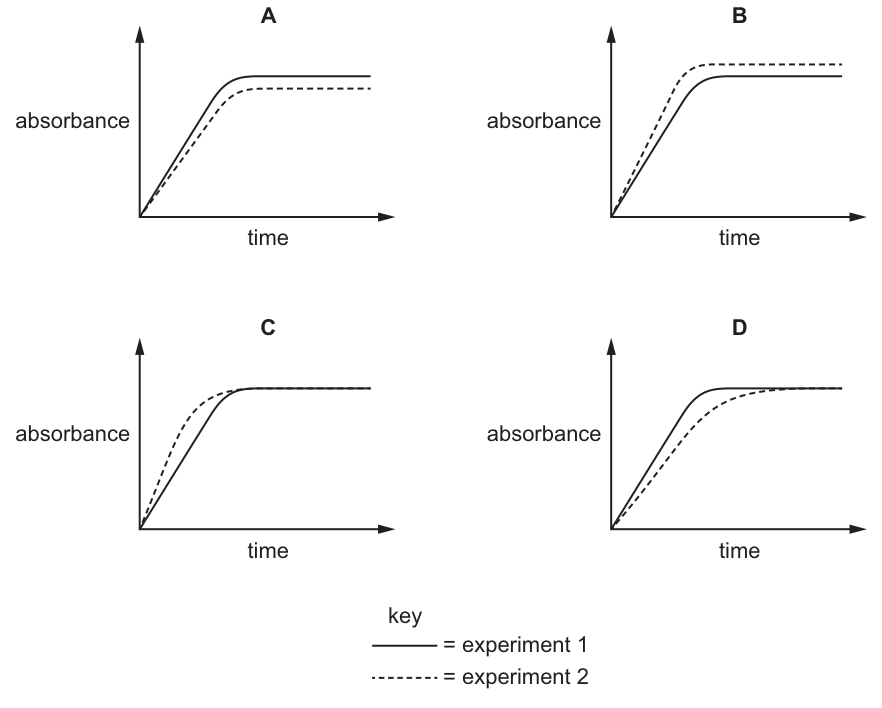
Working
- The total amount of pyrophosphate substrate is identical in both experiments, so once the reaction has gone to completion the same total amount of phosphate product is formed. This means the final absorbance must be the same in both experiments (eliminating A and B).
- In experiment 2, the higher pyrophosphatase concentration means more enzyme active sites are available, so the initial rate of reaction is faster and the plateau is reached sooner (eliminating D).
- Therefore experiment 2 reaches the same final absorbance as experiment 1, but in a shorter time.
Answer
C
C
Background Concept
Enzymes are biological catalysts that speed up reactions without being consumed. The rate of an enzyme-catalysed reaction depends on how many enzyme–substrate (ES) complexes form per unit time. If you increase the concentration of enzyme molecules (with substrate in excess), there are more active sites available at any moment, so more ES complexes form per second and the initial rate increases.
However, the amount of product formed when the reaction reaches completion is fixed by the amount of substrate present, not by the amount of enzyme. Enzyme only changes how fast the substrate is converted; it does not change how much product can be made. This is the key distinction between rate and yield.
In a colorimetry experiment, absorbance is proportional to the concentration of the coloured species in solution. Here, the phosphate product (or a coloured complex formed with it) absorbs light, so absorbance tracks the appearance of product over time.
Understanding the Question
The stem tells us:
- Experiment 1: a fixed concentration of pyrophosphatase converts all pyrophosphate to phosphate; absorbance is recorded at regular intervals until the reaction finishes.
- Experiment 2: the procedure is repeated with a higher pyrophosphatase concentration, all other variables (substrate concentration, temperature, pH, volume) kept constant.
- The four graphs (A–D) each plot absorbance vs time with two curves: a solid line for experiment 1 and a dashed line for experiment 2.
We need the graph that correctly shows what happens when enzyme concentration alone is increased.
Approach
Two predictions follow from the biology:
- Same final absorbance — because the same amount of substrate is present in both experiments, the same total amount of product is formed when the reaction completes, so the plateau must be at the same height on the y-axis.
- Faster rise to the plateau — because there is more enzyme, the initial slope of the absorbance–time curve is steeper and the plateau is reached sooner.
The correct graph must therefore show a dashed curve that climbs more steeply but levels off at the same final absorbance as the solid curve.
Step-by-Step Reasoning
- Option A shows experiment 2 reaching a lower final absorbance. This would only happen if some substrate were not converted, but the stem says all pyrophosphate is converted in both cases. A is wrong.
- Option B shows experiment 2 reaching a higher final absorbance. This would imply more product formed, but with the same starting substrate and complete conversion, the total product is the same. B is wrong.
- Option C shows experiment 2 reaching the same final absorbance as experiment 1, but in a shorter time. This matches both predictions above: faster initial rate, identical yield. C is correct.
- Option D shows experiment 2 reaching the same final absorbance more slowly. A higher enzyme concentration cannot produce a slower reaction when substrate is in excess. D is wrong.
Key Takeaways
- Rate vs extent: increasing enzyme concentration increases the rate of reaction but not the extent (final amount of product), which is set by substrate amount.
- Reading enzyme progress curves: the gradient tells you the rate, the plateau height tells you the total product formed.
- All other variables standardised = any difference between the two curves is attributable solely to the independent variable (here, enzyme concentration).
Common Mistakes
- Choosing a graph where the final absorbance differs (A or B) — confusing rate with yield and assuming "more enzyme = more product".
- Choosing D — assuming that a higher enzyme concentration will somehow slow the reaction, perhaps conflating it with the effect of high substrate concentration when enzyme becomes saturated.
- Ignoring the fact that absorbance is being measured until all substrate is consumed, which fixes the plateau height.
Things to Be Careful About
- Always check both features of an enzyme progress curve: the slope (rate) and the plateau (extent/yield).
- "All other variables were standardised" means substrate amount is unchanged, so the maximum possible product is identical in both experiments.
- In a colorimetric assay the absorbance is a proxy for product concentration, so identical final absorbance = identical final product = identical substrate initially present.
Proteases are a group of enzymes that digest proteins.
Which statements about proteases are correct?
1 A bacterial protease that is secreted from a disease-causing bacterium could act as an antibody and cause the production of antigens against it.
2 Non-competitive inhibition of a protease that has an optimum condition of pH 2 can be overcome by increasing the substrate concentration and increasing the pH.
3 Water molecules are required when peptide bonds that link the monomers together are broken by the action of proteases in hydrolysis reactions.
Options
A 1, 2 and 3
B 1 and 2 only
C 2 only
D 3 only
Working
Statement 1 – Incorrect. A bacterial protease is an enzyme, not an antibody. Antibodies are produced by B-lymphocytes in response to antigens. The protease itself may be recognised as a foreign antigen and trigger antibody production, but it does not act as an antibody.
Statement 2 – Incorrect. Non-competitive inhibition binds to a site other than the active site, changing the active site shape so substrate can no longer bind. This cannot be overcome by increasing substrate concentration (unlike competitive inhibition). Furthermore, the optimum pH is 2, so increasing the pH would move conditions away from the optimum and reduce activity.
Statement 3 – Correct. Proteases catalyse the hydrolysis of peptide bonds, which requires water molecules to break the bond between amino acid monomers.
Answer
D
D
Background Concept
Proteases are hydrolytic enzymes that break peptide bonds between amino acids in proteins. Their action depends on the active site, which is sensitive to conditions such as pH and to molecules that interfere with substrate binding.
In competitive inhibition, an inhibitor molecule resembles the substrate and binds to the active site; this can be overcome by raising substrate concentration. In non-competitive inhibition, the inhibitor binds to a different site (allosteric site) and distorts the active site so substrate cannot bind effectively; this cannot be overcome by adding more substrate because the active site is no longer functional regardless of substrate availability.
Hydrolysis is a chemical reaction in which a bond is broken by the addition of a water molecule. For peptide bonds, the –OH from water attaches to one amino acid and the –H to the other.
In immunity, an antigen is any molecule (often a foreign protein) that triggers an immune response, and an antibody is the protein produced by B-lymphocytes that specifically binds to that antigen. Enzymes themselves are not antibodies.
Understanding the Question
The question presents three statements about proteases and asks which combination of them is correct. The candidate must evaluate each independently, applying knowledge of enzyme inhibition, hydrolysis chemistry, and the distinction between antigens and antibodies.
Approach
Work through each statement in turn:
- Check whether the biological claim is accurate.
- Identify which mark-scheme terms or concepts are misused.
- Eliminate options based on which statements pass or fail.
Step-by-Step Reasoning
Statement 1: The claim conflates antigen and antibody. A protease is an enzyme that digests proteins; it is not an antibody. It may act as an antigen (a foreign protein recognised by the immune system), triggering antibody production, but it does not itself act as an antibody. Statement 1 is false.
Statement 2: The defining feature of non-competitive inhibition is that it cannot be overcome by increasing substrate concentration, because the inhibitor changes the shape of the active site. Additionally, pH 2 is the optimum for this protease, so moving the pH upwards (away from the optimum) would reduce, not improve, activity. Statement 2 is false.
Statement 3: Peptide bonds join amino acid monomers together. Hydrolysis of these bonds requires water – one water molecule per peptide bond broken. Proteases catalyse exactly this reaction. Statement 3 is true.
Only statement 3 is correct, so the answer is D.
Key Takeaways
- Non-competitive inhibition is irreversible by substrate addition (unlike competitive inhibition).
- Hydrolysis always requires water; condensation releases water.
- Antigens trigger antibody production; enzymes are not antibodies.
- Each statement in a 'which are correct' question must be evaluated independently before combining them.
Common Mistakes
- Confusing the terms antigen and antibody – antibodies are produced in response to antigens, not the other way round.
- Thinking that increasing substrate concentration can overcome any form of inhibition – it only overcomes competitive inhibition.
- Assuming that moving pH away from the optimum improves enzyme activity – the optimum is by definition the condition of maximum activity.
- Forgetting that hydrolysis reactions always involve water.
Things to Be Careful About
- In multiple-statement MCQs, do not assume early statements are correct; evaluate each separately.
- Distinguish between what could happen (the protease being recognised as an antigen) and what the statement actually claims (the protease acting as an antibody).
- Remember the Vmax and Km behaviour under non-competitive inhibition: Vmax decreases but Km stays roughly the same; the inhibitor's effect is independent of substrate concentration.
The diagram shows part of a cell surface membrane.
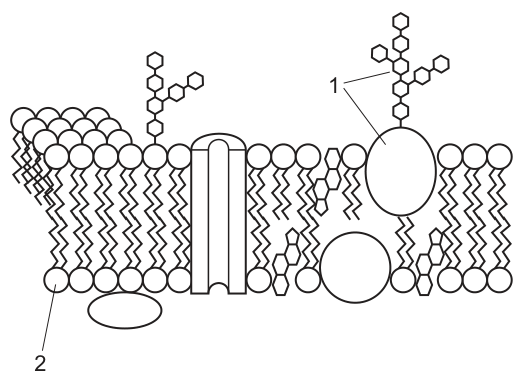
Which row correctly identifies the molecules labelled 1 and 2?
Options
| 1 | 2 | |
|---|---|---|
| A | glycoprotein | protein |
| B | glycolipid | lipoprotein |
| C | glycoprotein | phosphate head |
| D | glycolipid | phosphate head |
Working
Label 1 points to a short carbohydrate chain (shown as linked hexagons) attached to a protein molecule embedded in the bilayer — this is a glycoprotein.
Label 2 points to the round, hydrophilic head of a phospholipid molecule in the bilayer — this is the phosphate head.
Therefore the correct row is:
| 1 | 2 | |
|---|---|---|
| C | glycoprotein | phosphate head |
Answer
C
C
Background Concept
The cell surface membrane is described by the fluid mosaic model as a phospholipid bilayer in which proteins are embedded. Each phospholipid has a hydrophilic (water-loving) phosphate head and two hydrophobic (water-repelling) fatty acid tails. The heads face the aqueous environments on either side of the membrane, while the tails point inward, away from water.
Short carbohydrate chains are attached to some of the membrane components on the outer surface only:
- A carbohydrate chain attached to a protein forms a glycoprotein.
- A carbohydrate chain attached to a lipid (phospholipid) forms a glycolipid.
These carbohydrate chains act as cell-surface markers involved in cell recognition, signalling, and adhesion.
Understanding the Question
The question shows a fluid mosaic diagram of a cell surface membrane with two structures labelled 1 and 2. We are asked to identify each correctly from four options. The image description tells us label 1 points to a chain of hexagons (carbohydrate) attached to a protein, while label 2 points to a round head of a phospholipid at the bottom of the bilayer.
Approach
To answer this we need to:
- Look at label 1 — a carbohydrate chain sitting on top of a protein circle in the membrane → glycoprotein (not glycolipid, because it is bonded to a protein, not a phospholipid).
- Look at label 2 — a circular head at the membrane surface forming part of the bilayer → phosphate head of a phospholipid (not a generic "protein" — it is the rounded head at the bilayer surface).
Step-by-Step Reasoning
- Why C is correct: Label 1 sits on a protein → glycoprotein. Label 2 is the round, polar end of a phospholipid → phosphate head.
- Why A is wrong: The protein option for label 2 is incorrect because label 2 is clearly the round head of a phospholipid at the bilayer surface, not a transmembrane protein.
- Why B is wrong: Label 1 is on a protein, not a lipid, so it cannot be a glycolipid. "Lipoprotein" is also not a membrane structure shown here.
- Why D is wrong: Label 1 is attached to a protein (glycoprotein), not a phospholipid (glycolipid). The second column is correct here, but the first column is not.
Key Takeaways
- Glycoprotein = protein + carbohydrate chain (on outer membrane surface).
- Glycolipid = phospholipid + carbohydrate chain (on outer membrane surface).
- The phosphate head is the hydrophilic, rounded part of a phospholipid that faces the aqueous environment on either side of the bilayer.
- Carbohydrate chains are always on the outer surface of the membrane, useful as cell recognition and signalling markers.
Common Mistakes
- Confusing glycoprotein with glycolipid — check whether the carbohydrate chain is attached to a protein or to the head of a phospholipid.
- Calling the phosphate head a "protein" simply because it looks circular — the bilayer itself is made of phospholipids, and the round shapes forming the two outer layers are the phosphate heads.
Things to Be Careful About
- The carbohydrate chains are drawn as chains of small hexagons in textbook diagrams. They are always on the outer surface only.
- A protein embedded in the membrane is usually drawn as a larger, irregular shape (sometimes a cylinder or globular blob) spanning or partially inserted into the bilayer — not as a small round head at the surface.
The diagram shows the mean dimensions of an epithelial cell in micrometres ().
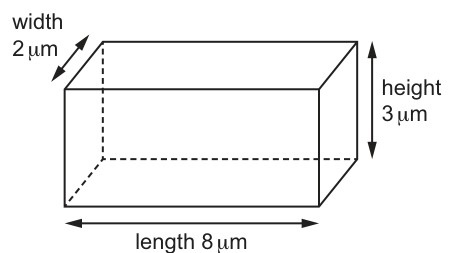
Which row shows the surface area to volume ratio of the epithelial cell and how the surface area to volume ratio of the cell would change if the cell width doubled?
Options
| surface area : volume | how surface area : volume changes if the cell width doubled | |
|---|---|---|
| A | 12 : 23 | decreases |
| B | 12 : 23 | increases |
| C | 23 : 12 | decreases |
| D | 23 : 12 | increases |
Working
Original cell dimensions: length = , height = , width = .
If the width doubles to :
Since , the SA:V ratio decreases when the width doubles.
Answer
C
C
Background Concept
Cells exchange materials (oxygen, carbon dioxide, nutrients, wastes) across their plasma membrane. The rate of exchange depends on the surface area available for diffusion, while the demand for exchange depends on the volume of cytoplasm that needs to be served. As a cell grows, both quantities increase — but volume grows faster than surface area because volume scales with the cube of a linear dimension, while surface area scales with its square. The result is a steadily falling SA:V ratio as cell size increases, which is the fundamental reason why cells stay small or become flattened/elongated.
For a rectangular cuboid cell:
- Surface area:
- Volume:
The SA:V ratio is most usefully expressed in its simplest whole-number form.
Understanding the Question
The question gives the three dimensions of an epithelial cell (length , height , width ) as a 3-D cuboid. We must:
- Calculate the SA:V ratio in its simplest form.
- Decide what happens to that ratio if the width alone doubles (i.e. from to ).
- Match both findings to the correct row of the table.
The options give only two possible ratios: and . Note that the conventional way of writing a ratio is surface area first, so would mean SA is smaller than V (an impossibility for a small cell), while has SA larger than V (typical of small cells).
Approach
- Use the cuboid formulae for surface area and volume with the original dimensions; then simplify the ratio by dividing both terms by their greatest common divisor.
- Repeat the calculation with width = and compare the new ratio to the original to see whether SA:V rises or falls.
- Pick the row whose ratio matches the simplified original and whose "change" column matches the comparison.
Step-by-Step Reasoning
Step 1 — original surface area
Step 2 — original volume
Step 3 — simplify SA:V
This immediately eliminates options A and B, which use (an inverted form).
Step 4 — recalculate with width =
Step 5 — compare
Original ratio is larger than the new ratio , so the SA:V ratio decreases.
Step 6 — pick the answer
Row C states and "decreases", which matches both findings. Row D has the right ratio but the wrong direction.
Key Takeaways
- A cell's surface area and volume are calculated from its dimensions; the SA:V ratio is then expressed in its simplest form.
- The convention is surface area first, then volume (so , not , for this small cell).
- Enlarging any one linear dimension of a cell decreases the SA:V ratio because volume grows as the cube of the change, surface area only as the square. This is why very large cells would be unable to exchange materials fast enough — a key reason cells are small and why many tissues (e.g. epithelium) are made of thin, flat cells.
Common Mistakes
- Inverting the ratio. Writing instead of is biologically nonsensical here because surface area must exceed volume in a small, diffusion-efficient cell.
- Forgetting to simplify , leading to a non-matching number and the wrong answer.
- Reasoning the wrong way around for the second column — saying the SA:V "increases" when the cell gets bigger. Volume always increases faster than surface area as a cell enlarges, so SA:V always falls.
- Using the wrong area formula (e.g. just summing the three visible faces of a cuboid without doubling, because a cuboid has six faces).
Things to Be Careful About
- Read the question carefully: it asks what happens to SA:V if the width doubles, not the length, and not all three dimensions.
- Quote the ratio in its simplest whole-number form — the mark scheme expects the reduced ratio, not the raw calculation.
- The phrase "surface area to volume ratio" is conventionally written as , with surface area first.
- Note the units: SA is in and V in , so the ratio itself is dimensionless (a pure number).
Which diagram shows the correct direction of net water movement between the four cells due to osmosis?
key
= water potential
Options
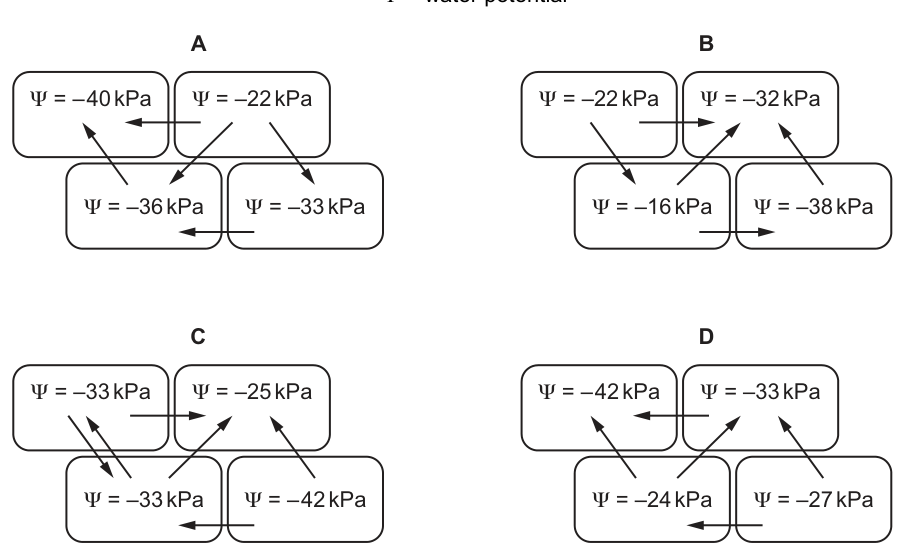
Working
Osmosis is the net movement of water molecules across a partially permeable membrane from a region of higher (less negative) water potential to a region of lower (more negative) water potential.
Checking option A:
- Top cells: water moves from to (less negative → more negative) ✓
- Bottom cells: water moves from to (less negative → more negative) ✓
- Diagonally: water moves from to ✓ and from to ✓
Every arrow in A points from a higher (less negative) to a lower (more negative) — consistent with osmosis.
Options B, C and D each contain at least one arrow that points from a more negative to a less negative water potential, which is the wrong direction for osmosis.
Answer
A
A
Background Concept
Osmosis is the net movement of water molecules across a partially permeable membrane, down a water potential gradient — that is, from a region of higher water potential to a region of lower water potential. No ATP is required.
Water potential () is measured in kilopascals (). Pure water has . When solutes are dissolved in water the water potential becomes negative, and the more solute present the more negative (lower) the value:
- Higher water potential = less negative value (closer to 0)
- Lower water potential = more negative value (further from 0)
So although the numbers are negative, you still compare them in the usual way: is higher than .
Understanding the Question
The stem gives a key: = water potential. Each of the four diagrams (A, B, C, D) shows four adjacent cells with a water potential value inside, and arrows indicating the proposed direction of net water movement between the cells. The task is to identify the single diagram in which every arrow correctly represents osmosis.
The command word is implicit in the MCQ — pick the diagram whose arrows all obey the rule: water moves from higher (less negative) to lower (more negative) .
Approach
For each option, take every arrow in turn and check whether it points from a less negative to a more negative . If even one arrow is wrong, reject the option. The correct option is the one where all arrows obey the rule.
Step-by-Step Reasoning
Option A
- Top pair: vs . Arrow points from → (less negative → more negative) ✓
- Bottom pair: vs . Arrow points from → ✓
- Top-left to bottom-right: vs . Arrow points from → ✓
- Top-right to bottom-left: vs . Arrow points from → ✓
- All four arrows go down the water potential gradient. Option A is correct.
Option B
- Top pair: arrow points from → (more negative → less negative) ✗
- This violates the rule, so B is wrong.
Option C
- One diagonal arrow points upward from to (more negative → less negative) ✗
- C is wrong.
Option D
- A diagonal arrow points from (top right) down to (bottom left) — more negative → less negative ✗
- D is wrong.
Only A has every arrow pointing from a higher (less negative) water potential to a lower (more negative) water potential.
Key Takeaways
- Osmosis moves water from higher (less negative) to lower (more negative).
- Water potential is a comparative quantity: even though values are negative, .
- In multi-arrow diagrams, every single arrow must be checked; one wrong arrow disqualifies the whole option.
- The water potential gradient is the driving force for osmosis; energy (ATP) is not required.
Common Mistakes
- Treating the negative sign as a barrier: thinking is "greater" than because of the larger absolute value. Always compare numbers in the normal way.
- Only checking the obvious horizontal arrows and missing a wrong diagonal arrow.
- Confusing osmosis with active transport, which moves substances against a gradient and requires ATP (and applies to solutes, not water in the same way).
Things to Be Careful About
- "Higher" water potential always means less negative, never more negative.
- Water moves down the gradient by osmosis — no membrane protein or ATP involved.
- A cell cannot gain water by osmosis from a neighbour with a more negative ; check the numbers on the actual cells, not the direction of the arrow you expect.
An investigation was carried out into the effect of four different treatments on the permeability of the cell surface membranes and tonoplasts of beetroot cells. Beetroot cell vacuoles contain a red pigment. This pigment cannot diffuse through the tonoplasts or cell surface membranes.
cubes were cut from beetroot tissue and washed in running water for 20 minutes to remove any pigment released from damaged cells.
Two cubes were then placed in each of the four test-tubes containing different contents and observed for five minutes.
Which row shows a correct explanation for the observation recorded for one of the treatments?
Options
| treatment | observation | explanation | |
|---|---|---|---|
| A | dilute hydrochloric acid | contents of test-tube stay clear | membrane proteins have been denatured |
| B | ethanol | contents of test-tube turn red | lipids, including membrane phospholipids, have dissolved |
| C | water at | contents of test-tube stay clear | membrane proteins have been denatured |
| D | water at | contents of test-tube turn red | lipids, including membrane phospholipids, have dissolved |
Working
The red pigment is trapped inside the vacuole by the tonoplast and cannot pass through an intact cell surface membrane. Any treatment that damages the membrane structure allows pigment to leak out, turning the surrounding water red.
- A is wrong: if membrane proteins were denatured, the membrane would be more permeable and the pigment WOULD leak out (contents would turn red), not stay clear.
- B is correct: ethanol dissolves the phospholipids of the membrane, destroying the bilayer structure. The damaged membranes can no longer retain the pigment, so it diffuses out and the contents turn red.
- C is wrong: at membrane proteins are not denatured; the contents stay clear simply because the membranes are intact.
- D is wrong: hot water damages the membrane by denaturing membrane proteins and disrupting the bilayer; it does not dissolve phospholipids. Water is not a lipid solvent.
Answer
B
B
Background Concept
The cell surface membrane and the tonoplast (the membrane around the central vacuole of a plant cell) are both phospholipid bilayers with embedded proteins — the fluid mosaic model. Their integrity depends on:
- Phospholipids forming a continuous bilayer held together by hydrophobic interactions between their fatty-acid tails. Anything that disrupts these interactions (a lipid solvent, very high temperature) breaks the bilayer apart.
- Membrane proteins maintaining their specific tertiary structure, kept stable by hydrogen bonds, ionic bonds and hydrophobic interactions. High temperature or extreme pH breaks these bonds and denatures the proteins, distorting the membrane.
When either structure is damaged, the membrane becomes more permeable: substances that are normally retained (such as the red betalain pigment inside the beetroot vacuole) leak out into the surrounding solution.
Understanding the Question
This is a classic beetroot permeability experiment. The red pigment (a betalain) is normally kept inside the vacuole because it cannot cross intact membranes. If a treatment damages either the tonoplast or the cell surface membrane, the pigment escapes and the colourless surrounding water turns red.
The question asks which row correctly matches:
- the treatment,
- the observation (clear or red),
- a biologically valid explanation linking the two.
Approach
For each row, test internal consistency: would that treatment actually produce that observation, and is the stated explanation the correct biological reason?
- A clear tube = membranes are still intact (pigment retained).
- A red tube = membranes have been damaged (pigment leaked out).
- Valid explanations for damage: protein denaturation (heat, extreme pH) or lipid dissolution (organic solvents such as ethanol).
Step-by-Step Reasoning
Option A — dilute HCl, clear contents, "proteins denatured"
Dilute HCl lowers the pH and can denature proteins. BUT if proteins were denatured, the membranes would be damaged and the pigment WOULD leak out, turning the contents red. The observation (clear) contradicts the explanation. Reject.
Option B — ethanol, red contents, "lipids dissolved"
Ethanol is a non-polar solvent that readily dissolves membrane phospholipids. As the phospholipid bilayer breaks down, the tonoplast and cell surface membrane can no longer retain the pigment, and it diffuses out into the water — so the contents turn red. Treatment, observation and explanation are all consistent. Accept.
Option C — water at 20 °C, clear contents, "proteins denatured"
20 °C is room temperature; no denaturation occurs. The contents stay clear simply because the membranes are intact and the pigment cannot cross them. The explanation is biologically wrong. Reject.
Option D — water at 80 °C, red contents, "lipids dissolved"
Hot water does damage the membrane (hence the red colour), but the mechanism is denaturation of membrane proteins and increased fluidity/disruption of the bilayer — NOT dissolution of lipids. Water is polar and is not a lipid solvent. The explanation is wrong. Reject.
Key Takeaways
- Organic solvents (ethanol, acetone) damage membranes by dissolving the phospholipids.
- High temperature damages membranes by denaturing membrane proteins and disrupting the bilayer's hydrophobic interactions.
- Extreme pH damages membranes by denaturing proteins.
- The colour of the surrounding solution tells you whether the membrane is intact (clear) or compromised (red, with beetroot).
- The explanation must be biologically correct AND match the observation.
Common Mistakes
- Saying that water at 80 °C "dissolves membrane lipids" — water cannot dissolve lipids.
- Claiming that protein denaturation explains why the contents STAY clear — denaturation would make them leak out.
- Confusing tonoplast with cell surface membrane; both are phospholipid bilayers and both must be damaged for pigment to escape the cell.
- Forgetting that 20 °C is essentially a control: no denaturation, no dissolution, intact membranes, clear solution.
Things to Be Careful About
- "Lipid solubility" vs "water solubility": only non-polar solvents dissolve phospholipids.
- Distinguish clearly between protein denaturation (high temperature or extreme pH) and lipid dissolution (organic solvents).
- An observation must be logically consistent with its explanation; CIE questions often include rows that "sound right" but contradict themselves.
The photomicrograph shows a stage of mitosis.
What would be correct for the next stage in mitosis?
Options
| two sister chromatids remain attached | nuclear membrane | |
|---|---|---|
| A | no | not present |
| B | no | re-forming |
| C | yes | not present |
| D | yes | breaking down |
Working
The photomicrograph shows chromosomes aligned at the equator (metaphase plate) with spindle fibres attached — this is metaphase. The next stage is anaphase, in which:
- The centromeres divide and the two sister chromatids of each chromosome separate, so they are no longer attached to one another.
- The nuclear membrane remains absent (it broke down during prometaphase and does not re-form until telophase).
Therefore: two sister chromatids remain attached = no; nuclear membrane = not present.
Answer
A
A
Background Concept
Mitosis is a continuous process that biologists divide into four named stages — prophase, metaphase, anaphase and telophase — for ease of description. Two structural landmarks help to identify each stage:
- The chromosomes (each consisting of two sister chromatids joined at a centromere) and their position in the cell.
- The nuclear envelope (nuclear membrane), which surrounds the chromosomes in interphase, breaks down at the start of mitosis and re-forms only at the end.
Key events of each stage:
- Prophase — chromosomes condense and become visible; the nuclear envelope breaks down; the spindle forms.
- Metaphase — chromosomes line up on the equator (the metaphase plate), with spindle fibres attached to their centromeres.
- Anaphase — centromeres divide; the sister chromatids of every chromosome are pulled apart and travel to opposite poles; each former chromatid is now an independent chromosome.
- Telophase — chromosomes decondense at the poles; a new nuclear envelope re-forms around each set; cytokinesis usually follows.
Throughout anaphase the nuclear envelope is still absent — it only re-appears in telophase.
Understanding the Question
The image shows a cell whose chromosomes are arranged across the middle of the cell, with spindle fibres visible radiating from the poles. This is the classic appearance of metaphase. The question asks what will be true at the next stage (i.e. anaphase) for two specific features: (i) whether two sister chromatids remain attached, and (ii) the state of the nuclear membrane.
Approach
Identify the stage shown, recall the defining event of the next stage, and check both features against the answer options.
Step-by-Step Reasoning
- Identify the stage in the micrograph. The chromosomes are aligned along the central equator of the cell, with spindle fibres clearly extending from each pole to the centromeres. This is metaphase.
- Name the next stage. After metaphase comes anaphase.
- Apply the defining event of anaphase. The centromeres split and the two sister chromatids of every chromosome separate, moving to opposite poles. So they are no longer attached to each other — option: no.
- Apply knowledge of the nuclear envelope. The nuclear envelope broke down during late prophase/prometaphase and remains absent throughout anaphase; it only re-forms in telophase. So during anaphase the nuclear membrane is still not present.
- Match to the options. "No, not present" corresponds to option A.
Key Takeaways
- Recognising the position of the chromosomes (equator vs. poles) and the state of the spindle tells you which stage of mitosis you are looking at.
- "Sister chromatids attached" is a feature of prophase and metaphase; once the cell enters anaphase, the chromatids separate and become independent daughter chromosomes.
- The nuclear envelope is absent from late prophase all the way through to telophase, when it re-forms around each new set of chromosomes.
Common Mistakes
- Choosing B ("re-forming") because the student confuses anaphase with telophase. The nuclear envelope re-forms in telophase, not anaphase.
- Choosing C ("yes, not present") because the student thinks sister chromatids only separate in telophase. They actually separate at the start of anaphase.
- Choosing D ("yes, breaking down") because the student confuses the events of prometaphase (nuclear envelope breakdown) with the events of anaphase.
Things to Be Careful About
- The order of stages is fixed: prophase → metaphase → anaphase → telophase. Always place events in this order.
- A chromosome with two sister chromatids is still considered "one chromosome"; once the centromere divides in anaphase, each former chromatid becomes a separate chromosome.
- Do not confuse "chromatid" with "chromosome" — the mark scheme (and examiners) expect this distinction to be used correctly when describing anaphase.
What are the correct roles of mitosis?
Options
| stem cell growth | replacing lost skin cells | |
|---|---|---|
| A | ✓ | ✗ |
| B | ✓ | ✓ |
| C | ✗ | ✗ |
| D | ✗ | ✓ |
key
✓ = correct
✗ = not correct
Working
Mitosis produces two genetically identical daughter cells from one parent cell. Its principal roles are growth (increase in cell number), repair of damaged tissues, and asexual reproduction.
- Replacing lost skin cells ✓ — the epidermis is constantly shed and replaced by mitotic division of cells in the basal layer; this is a textbook example of repair by mitosis.
- Stem cell growth ✗ — although stem cells divide by mitosis, the phrase "stem cell growth" refers to the proliferation and self-renewal of the stem cell population, not to a role of mitosis itself. Mitosis produces differentiated/committed progeny, it does not by itself "grow" the stem cell pool.
Only the second statement is a correct role of mitosis, matching option D.
Answer
D
D
Background Concept
Mitosis is the division of a nucleus to produce two genetically identical daughter nuclei, followed by cytokinesis to form two daughter cells. In the Cambridge 9700 syllabus it is described as the process responsible for three principal outcomes: growth of an organism (by increasing cell number), repair and replacement of cells, and asexual reproduction. The cell cycle that encloses mitosis has four phases — G₁, S, G₂ and M (mitosis) — and is carefully regulated so that the correct number of chromosomes is maintained in every somatic cell.
Stem cells are unspecialised cells that retain the ability to divide and to differentiate into one or more specialised cell types. They are important in embryonic development, tissue maintenance and repair, and in laboratory contexts (e.g. therapeutic cloning). Their continued presence in adult tissues (e.g. epidermal stem cells, haematopoietic stem cells) is what allows tissues with high cell turnover, such as skin and intestinal lining, to be continuously renewed.
Understanding the Question
The question presents a table of two statements and asks which are correct roles of mitosis. The columns are:
- stem cell growth
- replacing lost skin cells
A tick (✓) means the statement is a correct role of mitosis, a cross (✗) means it is not. The candidate must decide for each column whether mitosis is responsible, and then pick the option (A, B, C or D) that matches.
The command word is effectively "identify" — the answer depends on knowing precisely what mitosis does and what counts as a "role" of mitosis.
Approach
Apply the standard list of mitotic roles (growth, repair, asexual reproduction) to each statement:
- If the statement is a clear example of one of these three roles, mark it ✓.
- If the statement describes something different (e.g. the proliferation of a stem cell pool, or a process upstream of mitosis), mark it ✗.
Then read across the row of the matching option to give the letter.
Step-by-Step Reasoning
Statement 1 — stem cell growth:
Stem cells do divide by mitosis, and this division is what supplies the body with the differentiated cells needed for repair. However, "stem cell growth" as a phrase describes the maintenance and expansion of the stem cell population itself — a self-renewal process rather than a role of mitosis. Mitosis takes a parent cell and produces two daughter cells; it does not by itself cause a stem cell to grow (in the sense of enlarge or mature). On the mark scheme this is therefore marked ✗ (not correct).
Statement 2 — replacing lost skin cells:
The epidermis is continually shed. New skin cells are produced by mitotic division of cells in the basal (deepest) layer of the epidermis. This is a textbook example of repair/replacement by mitosis, so this column is marked ✓ (correct).
Reading the options:
- A: stem cell growth ✓, replacing lost skin cells ✗ — wrong, the second statement is correct.
- B: both ✓ — wrong, the first statement is not credited.
- C: both ✗ — wrong, the second statement is correct.
- D: stem cell growth ✗, replacing lost skin cells ✓ — matches the analysis.
The correct option is therefore D.
Key Takeaways
- Mitosis has three core roles: growth (cell number increase), repair, and asexual reproduction.
- Continuous replacement of tissues with high cell turnover (skin, gut lining, blood) is a repair role of mitosis.
- The phrase "stem cell growth" refers to the self-renewal/proliferation of the stem cell pool and is not itself classed as a role of mitosis on this mark scheme, even though stem cells divide mitotically.
Common Mistakes
- Marking stem cell growth as a role of mitosis because stem cells do divide by mitosis. The mark scheme distinguishes the role of mitosis (what mitosis is for) from what divides by mitosis; conflating the two leads to selecting B.
- Forgetting that skin replacement is a classic repair example and selecting A.
Things to Be Careful About
- Read the column headings carefully — a ✓ means "this is a correct role of mitosis", not "this process involves mitosis".
- The mark scheme is precise: "growth" of an organism (more cells) is a role of mitosis, but "growth" of a stem cell (the stem cell population expanding) is not credited as a role of mitosis here.
- Only one option can be correct; eliminate options as soon as one column is wrong.
Which row about the stages of the mitotic cell cycle is correct?
Options
| DNA ligase used in the nucleus | RNA polymerase used in the nucleus | |
|---|---|---|
| A | phase | S phase |
| B | phase | mitosis |
| C | mitosis | phase |
| D | S phase | phase |
Working
- DNA ligase joins Okazaki fragments on the lagging strand during DNA replication, which takes place in the S phase of interphase.
- RNA polymerase synthesises pre-mRNA during transcription, which is most active in the G₁ phase (when the cell is growing and producing proteins needed before DNA replication).
Only row D places DNA ligase in the S phase and RNA polymerase in the G₁ phase.
Answer
D
D
Background Concept
The mitotic cell cycle has two major phases: interphase (a period of growth and DNA replication) and M phase (mitosis + cytokinesis). Interphase is itself divided into three sub-phases:
- G₁ (Gap 1) — the cell grows, makes organelles and proteins, and carries out its normal metabolism. Transcription is very active here because the cell needs to produce the enzymes and structural proteins required for the upcoming round of DNA replication and division.
- S (Synthesis) phase — the entire genome is replicated. Each chromosome is copied to form two sister chromatids held at the centromere.
- G₂ (Gap 2) — the cell continues to grow, synthesises proteins required for mitosis (e.g. those involved in spindle assembly), and checks that DNA replication has been completed correctly before entering M phase.
During the S phase, two key nuclear enzymes are at work:
- DNA polymerase extends new DNA strands by adding nucleotides to the 3′ end.
- DNA ligase seals the nicks between Okazaki fragments on the lagging strand, producing a continuous daughter strand.
During G₁ (and to a lesser extent G₂), the cell is actively transcribing genes, so RNA polymerase is operating in the nucleus to produce mRNA from template DNA.
Understanding the Question
This is an MCQ requiring the candidate to match each of two enzymes to the cell cycle stage in which it functions in the nucleus. The two enzymes are:
- DNA ligase (used in DNA replication)
- RNA polymerase (used in transcription)
The question is essentially asking: during which stage of interphase does DNA replication occur, and during which stage is transcription most active?
Approach
Resolve each enzyme to the process it catalyses, then map each process to the cell cycle stage in which it occurs:
Then scan the four rows to find the one with DNA ligase in the S phase and RNA polymerase in the G₁ phase.
Step-by-Step Reasoning
- Option A places DNA ligase in G₁ and RNA polymerase in S phase. DNA ligase is not used in G₁ (no DNA is being replicated) and RNA polymerase is not the marker enzyme of S phase. Incorrect.
- Option B places DNA ligase in G₂ and RNA polymerase in mitosis. By G₂, DNA replication is already complete, so DNA ligase has finished its job. Transcription is essentially shut down during mitosis because the chromosomes are highly condensed. Incorrect.
- Option C places DNA ligase in mitosis and RNA polymerase in G₂. DNA replication does not occur during mitosis. Incorrect.
- Option D places DNA ligase in the S phase and RNA polymerase in the G₁ phase. This matches the biology: replication uses DNA ligase in S phase, and transcription is highly active in G₁ as the cell grows. Correct.
Key Takeaways
- S phase = DNA replication → DNA polymerase, DNA ligase, helicase, primase, etc. all act here.
- G₁ phase = growth and gene expression → RNA polymerase is very active making mRNA for the proteins the cell needs.
- G₂ phase = preparation for mitosis → still some transcription, but also synthesis of mitotic machinery; DNA replication is finished.
- Mitosis = chromosome segregation → chromatin is condensed, transcription is essentially silent.
Common Mistakes
- Confusing the G₁, S and G₂ stages — students often think "DNA is made in G₁ because G comes first", but replication is specifically in S phase.
- Assuming RNA polymerase is only used in protein synthesis broadly, without linking it to a specific cell cycle stage.
- Thinking that "DNA ligase" operates at any time DNA is present — it only operates during DNA replication to seal nicks between Okazaki fragments.
- Believing transcription is highest in G₂ because the cell is "preparing for division"; in fact, G₁ is the major transcriptional phase, and the cell also makes specific mitotic proteins in G₂ but transcription is not the defining activity of G₂.
Things to Be Careful About
- The question specifies enzymes used in the nucleus — this is true for both DNA ligase and RNA polymerase (the mRNA must be made in the nucleus before export to the cytoplasm).
- Do not be distracted by "mitosis" as a possible location for DNA ligase — although small amounts of DNA repair occur throughout the cycle, the canonical role of DNA ligase that the syllabus tests is during S-phase DNA replication.
- Note that some transcription also occurs in G₂, but the mark scheme recognises G₁ as the principal answer because that is when the cell is most actively expressing its genes for growth.
Which statements describe how a gene mutation can lead to the production of a non-functional protein?
1 During transcription, an incorrect nucleotide is added to a DNA molecule.
2 The mutated gene results in a new codon being transcribed.
3 The order of the bases in an anticodon on tRNA is altered during translation.
Options
A 1, 2 and 3
B 1 and 2 only
C 2 and 3 only
D 2 only
Working
Statement 1 is incorrect. Transcription is the synthesis of mRNA using DNA as a template; nucleotides are added to the growing mRNA strand, not to the DNA molecule. A change in the DNA sequence (mutation) arises during DNA replication, not transcription.
Statement 2 is correct. A gene mutation (a change in the base sequence of the DNA) will be transcribed into a different mRNA codon, which may code for a different amino acid (or a stop codon), producing a non-functional protein.
Statement 3 is incorrect. tRNA molecules are transcribed from separate tRNA genes, not from the protein-coding gene. A mutation in a protein-coding gene does not alter the anticodon of tRNA used during translation of its own mRNA.
Only statement 2 is correct.
Answer
D
D
Background Concept
A gene mutation is a change in the base sequence of DNA. Such changes arise during DNA replication, when the new DNA strand is being synthesised and the wrong nucleotide is occasionally inserted. Once a mutation is present in the DNA, it is then copied into mRNA during transcription, and may result in a different codon being read at the ribosome during translation, potentially substituting an amino acid or producing a premature stop codon and so yielding a non-functional protein.
It is essential to keep the three processes distinct:
- DNA replication — copying DNA to make new DNA; mutations can occur here.
- Transcription — copying the DNA template into mRNA.
- Translation — reading the mRNA codon sequence at the ribosome, with tRNAs bringing amino acids via their anticodons.
tRNA molecules are themselves the products of separate tRNA genes, transcribed by RNA polymerase III (in eukaryotes). They are not produced from the protein-coding mRNA being translated. Therefore, a mutation in a protein-coding gene does not directly alter the anticodons of tRNAs in the cell.
Understanding the Question
This is a multiple-choice question asking which of three statements correctly describe how a gene mutation (a change in the DNA) can lead to a non-functional protein. Each statement must be evaluated for biological accuracy. The options combine the statements, so identifying which statements are valid determines the answer.
Approach
Examine each statement and check:
- Does the process described correctly locate where a mutation occurs or what its consequence is?
- Are the molecular species (DNA, mRNA, tRNA) correctly assigned to their roles?
Step-by-Step Reasoning
Statement 1 — "During transcription, an incorrect nucleotide is added to a DNA molecule."
This conflates transcription with DNA replication. In transcription, RNA polymerase adds ribonucleotides to a growing mRNA strand complementary to the DNA template; no nucleotides are added to the DNA itself. Mutations are changes in the DNA sequence and arise during DNA replication, not transcription. Statement 1 is incorrect.
Statement 2 — "The mutated gene results in a new codon being transcribed."
A mutation in the gene (DNA) changes the template strand, so the mRNA produced by transcription will carry a different codon. Depending on the type of substitution (e.g. missense or nonsense), this can place a different amino acid in the polypeptide or truncate it, often producing a non-functional protein. Statement 2 is correct.
Statement 3 — "The order of the bases in an anticodon on tRNA is altered during translation."
Translation reads mRNA codons using tRNA anticodons, but tRNAs are encoded by their own separate tRNA genes. A mutation in a protein-coding gene does not change tRNA anticodons. A separate mutation in a tRNA gene could, but the question specifies a gene mutation in the protein being considered. Statement 3 is incorrect in the context described.
Only statement 2 is correct, so the answer is D.
Key Takeaways
- Mutations occur in DNA, typically during replication, not transcription.
- A mutation is then transcribed into mRNA as an altered codon.
- tRNAs are products of separate genes; a mutation in a protein-coding gene does not alter the anticodons of tRNAs used to translate its mRNA.
- Carefully distinguish between replication, transcription and translation when evaluating statements about molecular biology.
Common Mistakes
- Believing that transcription can introduce new mutations into the DNA — transcription copies DNA into mRNA but does not change the DNA sequence.
- Thinking that a gene mutation directly changes tRNA anticodons — tRNAs come from their own genes, so the relevant tRNA anticodon sequence is unaffected by mutations in a different (protein-coding) gene.
- Confusing codons (on mRNA) with anticodons (on tRNA) when reasoning through translation.
Things to Be Careful About
- The word "gene mutation" specifically refers to a change in the DNA sequence of a gene; consequences downstream (in mRNA, in protein) follow from this single initial event.
- Watch for traps where a process name is paired with the wrong molecule (e.g. "transcription… DNA molecule") — these are usually the false statements in such MCQs.
There are 64 chromosomes in the muscle cells of a particular mammal.
How many DNA molecules are present in a cell during early prophase and telophase of mitosis?
Options
| early prophase | telophase | |
|---|---|---|
| A | 64 | 32 |
| B | 64 | 64 |
| C | 128 | 128 |
| D | 128 | 64 |
Working
The muscle cell is somatic, so chromosomes.
During S phase of interphase, every chromosome is replicated. Each chromosome therefore consists of two sister chromatids joined at one centromere, and each chromatid is one DNA molecule.
- Early prophase: 64 chromosomes, each with 2 chromatids → DNA molecules.
- Telophase: the sister chromatids have separated at anaphase and are now at opposite poles. The cell as a whole still contains chromosomes, each with a single chromatid → DNA molecules (this number is conserved until cytokinesis splits the cytoplasm).
Answer
C
C
Background Concept
A chromosome is defined by the number of centromeres it contains, while a DNA molecule is counted per chromatid. In a non-dividing (G1) cell, each chromosome contains a single DNA molecule. During S phase of interphase, every DNA molecule is replicated semi-conservatively, producing two identical sister chromatids held together at the centromere. From S phase until anaphase, each chromosome therefore contains two DNA molecules (one per chromatid). At anaphase, the centromeres split and the sister chromatids are pulled apart; once separated, each former chromatid is itself counted as a new chromosome containing one DNA molecule.
The cell in this question is a muscle cell — a somatic, diploid cell — with chromosomes.
Understanding the Question
We are given a diploid number () and asked to work out the total number of DNA molecules in that cell at two stages: early prophase and telophase of mitosis. The options look very similar (a factor of 2 in either row), so the trap is mixing up "number of chromosomes" with "number of DNA molecules". The question is about DNA molecules, so we must count chromatids, not centromeres.
Approach
- Establish the starting chromosome number: 64.
- Remember that DNA replication has already occurred by early prophase, so each chromosome now has 2 chromatids (2 DNA molecules).
- Track the chromatids through mitosis: at anaphase the chromatids separate, so by telophase the cell contains 128 separate chromatids (now considered 128 chromosomes), each with one DNA molecule.
- Cytokinesis divides the cytoplasm, not the DNA, so as long as we are looking at the cell before it splits into two daughter cells, the total DNA count is still 128.
Step-by-Step Reasoning
Early prophase
- DNA replication finished in S phase.
- 64 chromosomes, each with 2 sister chromatids.
- Number of DNA molecules = .
Telophase
- Anaphase has already split the centromeres and pulled sister chromatids to opposite poles.
- The cell has not yet divided by cytokinesis, so both poles' worth of chromatids are still in one cell.
- Total chromosomes in the cell = , and each has only 1 DNA molecule.
- Number of DNA molecules = .
Therefore the answer is 128 in early prophase and 128 in telophase — option C.
Key Takeaways
- Count chromosomes by centromere; count DNA molecules by chromatid.
- During S phase to metaphase, each chromosome contains 2 DNA molecules; from anaphase onwards, each chromosome contains 1 DNA molecule.
- Telophase (before cytokinesis) still contains the whole complement of separated chromatids; only after cytokinesis does each daughter cell have half.
- A common distractor in this style of question is to halve the telophase number to 64 (treating the cell as if it has already split) — this is wrong because cytokinesis is the very last event.
Common Mistakes
- Halving at telophase to give 64. This wrongly assumes cytokinesis has already occurred. The two sets of chromatids are in the same cell until the cytoplasm divides.
- Confusing DNA molecules with chromosomes. A replicated chromosome is still counted as one chromosome (one centromere) even though it contains two DNA molecules. This leads to choosing B (64 and 64) instead of C.
- Doubling at telophase to give 256. This would only be correct if DNA replicated again, which it does not in mitosis.
Things to Be Careful About
- Read the column headings carefully — the question is about DNA molecules, not chromosomes.
- "Early prophase" matters: by then S phase is complete, so DNA is already replicated.
- "Telophase" of mitosis refers to the nuclear re-formation stage before cytokinesis completes; the cell has not yet split into two daughter cells.
The diagram shows the nucleotide sequence of a small section of the transcribed strand of a gene.
GCG CGC GGC GCG
The table shows the amino acids coded for by 10 mRNA codons.
| mRNA codon | amino acid |
|---|---|
| AAG | Lys |
| ACG | Thr |
| CGG CGC CGU | Arg |
| CCG | Pro |
| GCC GCG | Ala |
| GGC | Gly |
| UGC | Cys |
What is the sequence of the four amino acids in the polypeptide translated from this small section of a gene?
Options
A Ala-Ala-Cys-Ala
B Ala-Arg-Gly-Ala
C Arg-Ala-Pro-Arg
D Arg-Arg-Thr-Arg
Working
The "transcribed strand" is the template (antisense) strand, so the mRNA is complementary to it (with U replacing T).
Template strand: 5'-GCG CGC GGC GCG-3'
mRNA (complement, read in the same order): 5'-CGC GCG CCG CGC-3'
Translating each codon using the table:
- CGC → Arg
- GCG → Ala
- CCG → Pro
- CGC → Arg
Polypeptide: Arg–Ala–Pro–Arg
Answer
C
C
Background Concept
Genes are regions of DNA that code for proteins. DNA is double-stranded, with two antiparallel strands held together by complementary base pairing (A with T, G with C). During transcription, RNA polymerase reads ONE of the two DNA strands — the template strand (also called the antisense strand or transcribed strand) — and uses it to synthesize a complementary mRNA molecule. The mRNA is built in the 5' to 3' direction by complementary base pairing (A pairs with U in the mRNA, T pairs with A, G pairs with C, C pairs with G).
The OTHER DNA strand is called the coding strand (or sense strand, or non-transcribed strand). It has the same sequence as the mRNA except that thymine (T) is replaced by uracil (U). It is NOT the template for transcription; it merely has the same "code" as the resulting mRNA.
During translation, the ribosome reads the mRNA in triplets called codons (5' to 3'), and each codon specifies an amino acid. A polypeptide is built by linking the amino acids specified by successive codons.
Understanding the Question
The question states: "The diagram shows the nucleotide sequence of a small section of the transcribed strand of a gene." The critical phrase is transcribed strand — this is the template strand, not the coding strand. The given sequence is:
5'-GCG CGC GGC GCG-3'
The candidate must:
- Recognise that the given strand is the template, so the mRNA must be complementary to it.
- Construct the mRNA sequence by applying complementary base pairing (and remembering that mRNA contains U, not T — though there are no T's in this particular sequence).
- Read the mRNA codons in order and use the provided codon table to identify the corresponding amino acids.
The four options (A, B, C, D) all give different amino acid sequences, so precision in each step is essential. The trap in this question is the strand-type distinction.
Approach
The strategy is:
- Identify the strand type: "Transcribed strand" = template strand. The mRNA is complementary to this strand.
- Derive the mRNA: For each base in the template, write its complement (G↔C; the template has no T/A in this case). The mRNA will be read as codons in the same left-to-right order as the template is written.
- Translate the mRNA: Group the mRNA into codons (three bases each) and use the codon table to identify each amino acid.
- Match the answer: Compare the resulting amino acid sequence to the four options.
Step-by-Step Reasoning
Step 1: Recognise the template strand
The question explicitly states this is the "transcribed strand," which is the template (antisense) strand. The mRNA is complementary to this strand.
If a student mistakenly treats this as the coding strand (or as mRNA directly), they would read:
- GCG = Ala (GCC/GCG both code for Ala)
- CGC = Arg (CGG/CGC/CGU all code for Arg)
- GGC = Gly
- GCG = Ala
This would give Ala-Arg-Gly-Ala, which is option B — the most common trap.
Step 2: Derive the mRNA sequence
Apply complementary base pairing to each base in the template (and use U instead of T in the mRNA — although there are no T's here):
Template: 5'-G-C-G-C-G-C-G-G-C-G-C-G-3'
↓ ↓ ↓ ↓ ↓ ↓ ↓ ↓ ↓ ↓ ↓ ↓
mRNA: 5'-C-G-C-G-C-G-C-C-G-C-G-C-3' (read in the same order as the template)
Grouped as codons: 5'-CGC-GCG-CCG-CGC-3'
In the simplified CIE AS approach, the mRNA codons are taken as the complement of the template codons, read in the same left-to-right order. (The full "antiparallel" treatment is treated more formally at A2; for AS, the codons on the mRNA are simply the complement of the template codons written in the same order.)
Step 3: Translate the mRNA codons
Using the codon table:
- CGC → Arg
- GCG → Ala
- CCG → Pro
- CGC → Arg
Step 4: Construct the polypeptide
Reading in order: Arg–Ala–Pro–Arg
This matches option C.
Key Takeaways
- The "transcribed strand" is the template strand (antisense strand) — the one used by RNA polymerase to make mRNA.
- The "non-transcribed strand" is the coding strand (sense strand) — it has the same sequence as the mRNA (with T replaced by U).
- The mRNA is complementary to the template strand.
- mRNA contains uracil (U) instead of thymine (T).
- A polypeptide's amino acid sequence is determined by reading the mRNA codons in the 5' to 3' direction.
Common Mistakes
- Treating the transcribed strand as the coding strand (or as mRNA directly): This is the most common error and leads to option B (Ala-Arg-Gly-Ala). Always check whether the given strand is described as "transcribed" (template) or "non-transcribed" (coding) before deciding to complement or to copy.
- Forgetting to take the complement: If you copy the bases directly without complementing, you get the same wrong answer (B).
- Forgetting that mRNA uses U instead of T: Less of a problem here since the given template has no T's, but it is a common mistake in general and would cost marks on a question with A's in the template.
- Misreading the codon table: e.g., confusing CCG (Pro) with another codon. The provided table must be read carefully — note that several amino acids have multiple codons (Arg has CGG, CGC, CGU; Ala has GCC, GCG).
Things to Be Careful About
- The phrase "transcribed strand" specifically means the template strand. The complementary strand (with the same sequence as the mRNA) is the non-transcribed strand or coding strand.
- mRNA is built antiparallel to the template in reality, but for AS-level CIE questions, the codons on the mRNA are obtained by simply taking the complement of the template codons and reading them in the same left-to-right order as the template is written. This gives the same polypeptide as the more formal antiparallel treatment for the sequences typically used in AS papers.
- Always read the mRNA codons in the 5' to 3' direction to get the correct amino acid sequence.
- The codon table provided is specifically for mRNA codons, not DNA codons; codons in the table that include a U (e.g. CGU, UGC) are reminders of this.
- This question gives the transcribed strand — do not be misled into reading the bases directly as codons.
How many hydrogen bonds form when adenine and cytosine each bind to their complementary bases?
Options
| adenine | cytosine | |
|---|---|---|
| A | 2 | 2 |
| B | 2 | 3 |
| C | 3 | 2 |
| D | 3 | 3 |
Working
In DNA, complementary base pairing follows two rules:
- Adenine (A) pairs with thymine (T) via 2 hydrogen bonds.
- Cytosine (C) pairs with guanine (G) via 3 hydrogen bonds.
Therefore adenine forms 2 hydrogen bonds and cytosine forms 3 hydrogen bonds.
Answer
B
B
Background Concept
DNA is a double helix made of two antiparallel strands of nucleotides. Each nucleotide carries one of four nitrogenous bases: adenine (A), thymine (T), cytosine (C) or guanine (G). The bases on opposite strands pair in a highly specific way — this is the principle of complementary base pairing:
- A always pairs with T
- C always pairs with G
The pairing is held together by hydrogen bonds between the bases. The number of hydrogen bonds differs between the two types of pair:
- A–T: 2 hydrogen bonds
- C–G: 3 hydrogen bonds
This difference matters biologically: a C–G pair is therefore slightly stronger than an A–T pair, which influences DNA stability, melting temperature, and the ease with which the two strands can be separated (for example, during replication or transcription).
Understanding the Question
The question gives a small table with two columns (adenine and cytosine) and four options, each supplying a pair of numbers. The candidate must identify, for each base, how many hydrogen bonds it forms when paired with its correct partner. The biological context is implicit: the bonds are those formed in a DNA double helix between complementary bases.
The command word is implicit ("How many…?") — a direct recall question with no calculation or explanation required.
Approach
Apply the standard rule for complementary base pairing in DNA:
- Adenine → pairs with thymine → 2 hydrogen bonds
- Cytosine → pairs with guanine → 3 hydrogen bonds
The numbers to look for in the table are therefore 2 (under adenine) and 3 (under cytosine).
Step-by-Step Reasoning
- Identify the complementary partner of each base listed in the question:
- Adenine's partner is thymine.
- Cytosine's partner is guanine.
- Recall the number of hydrogen bonds for each base pair:
- A–T pair = 2 hydrogen bonds.
- C–G pair = 3 hydrogen bonds.
- Match the numbers to the two columns of the table:
- Adenine column: 2
- Cytosine column: 3
- Look down the four options to find the row that reads 2 | 3. That is option B.
Key Takeaways
- A–T base pairs are joined by 2 hydrogen bonds; C–G base pairs are joined by 3 hydrogen bonds.
- The difference in hydrogen-bond number contributes to differences in DNA stability and melting temperature, and is exploited in laboratory techniques such as PCR, where higher GC content raises the required annealing/extension temperatures.
Common Mistakes
- Confusing A–T with C–G numbers: candidates sometimes remember that A pairs with T but reverse the bond counts, choosing 3 for A and 2 for C (option C in this question).
- Assuming all base pairs have the same number of bonds: a common misconception that leads candidates to choose A (2 | 2) or D (3 | 3).
- Mixing up the partners: writing that A pairs with C, or that C pairs with T. Remember: the partners are fixed — A with T, C with G.
Things to Be Careful About
- This question is about DNA base pairing. In RNA, uracil (U) replaces thymine, but the bond count is the same: A–U still forms 2 hydrogen bonds, because U has the same hydrogen-bonding pattern as T in the relevant positions.
- The hydrogen-bond counts (2 and 3) refer to the canonical Watson–Crick base pairs; they are not properties of the bases in isolation but of the pair once aligned in the double helix.
- The question is single-mark: there is no partial credit, so be sure of the pair before selecting.
Which statement correctly identifies the movement of sucrose and amino acids in plant vascular tissue?
Options
A They are carried from source to sink by mass flow in upward and downward directions.
B They are carried from sink to source by cohesion-tension in upward and downward directions.
C They are carried from sink to source by mass flow in one direction.
D They are carried from source to sink by cohesion-tension in one direction.
Working
Sucrose and amino acids are assimilates transported in the phloem (sieve tubes). They are moved by the mass flow mechanism from a source (e.g. photosynthesising leaf, storage organ) to a sink (e.g. roots, fruits, growing shoots). Because a plant has sources above and sinks below (and vice versa, depending on season), phloem transport occurs in both upward and downward directions. The cohesion-tension mechanism, by contrast, is restricted to the xylem and only moves water and mineral ions upward.
Answer
A
A
Background Concept
In flowering plants there are two independent transport systems running through the vascular bundles:
-
Xylem carries water and dissolved mineral ions from the roots to the leaves. The mechanism is the cohesion–tension theory: water evaporates from the mesophyll cell walls (transpiration), generating a tension (negative pressure) that pulls a continuous column of water up the xylem. Water molecules cohere to one another (hydrogen bonds) and adhere to the walls of the narrow xylem vessels, so the column does not break. Movement is essentially upward only and the driving force is a physical pull from above.
-
Phloem carries organic assimilates — mainly sucrose, but also amino acids and other small solutes — from where they are made or stored (the source) to where they are used or stored (the sink). The mechanism is mass flow (the pressure-flow hypothesis of Münch). Companion cells use ATP-driven proton pumps to load sucrose actively into the sieve tubes at the source, lowering the water potential there so water enters by osmosis; this raises the hydrostatic pressure at the source end. At the sink, solutes are unloaded (often actively), water follows, and the pressure at the sink end falls. The resulting pressure gradient drives a bulk flow of sap from source to sink through the sieve tubes.
Crucially, the identity of source and sink changes with the season and developmental stage. In summer a mature leaf is a source and a developing root or fruit is a sink — so the phloem carries assimilates downwards. In spring a storage root (e.g. a sugar beet taproot) becomes a source, mobilising sucrose to fuel the growth of new shoots — so the phloem carries assimilates upwards. Hence phloem transport is genuinely bidirectional in the plant as a whole.
Understanding the Question
This is a one-mark multiple choice item. The stem asks which statement correctly describes the movement of sucrose and amino acids in plant vascular tissue. We are being tested on three things at once:
- The identity of the mechanism (mass flow vs. cohesion–tension).
- The direction of transport (source → sink vs. sink → source).
- The orientation of movement in the whole plant (one direction vs. up and down).
Approach
Eliminate the distractors by recognising that:
- Sucrose and amino acids are carried in the phloem, never by cohesion-tension. That rules out B and D.
- Phloem transport is from source to sink, not sink to source. That rules out C.
- A source may be above or below a sink, so phloem flow is bidirectional in the plant. Therefore the correct answer must combine source → sink, mass flow and upward and downward — which is A.
Step-by-Step Reasoning
- A — source → sink, mass flow, upward and downward directions. Consistent with the pressure-flow hypothesis. Loading at the source raises the pressure there; unloading at the sink lowers it; sap flows down the pressure gradient. Because source and sink positions vary, the same sieve tube can carry sap in either direction over the plant's life cycle. ✓
- B — sink → source, cohesion-tension, upward and downward. Cohesion-tension moves only water (in the xylem) and only upward; the direction is wrong and the mechanism is wrong. ✗
- C — sink → source, mass flow, one direction. The mechanism is right but the direction of assimilate flow is reversed. ✗
- D — source → sink, cohesion-tension, one direction. Direction is right, but cohesion-tension is the wrong mechanism for assimilates. ✗
Key Takeaways
- Sucrose and amino acids are phloem sap — they travel by mass flow.
- Mass flow goes from source to sink down a hydrostatic pressure gradient set up by active loading of sucrose at the source.
- Because sources and sinks are not fixed, phloem flow can be upward or downward in the plant.
- Cohesion-tension is restricted to the xylem and moves water and mineral ions upward only.
Common Mistakes
- Confusing phloem and xylem mechanisms and choosing a cohesion-tension option (B or D).
- Believing phloem flow is always downwards because that is the most familiar summer situation; in spring the reverse is true.
- Writing "sink to source" — students sometimes wrongly think of roots as the source.
Things to Be Careful About
- "Source" and "sink" are defined by the direction of net solute movement at that moment, not by the identity of the organ: a leaf can be a sink when young and a source when mature.
- Sucrose loading at the source is active (proton pumps + sucrose–H⁺ symporters); this is what builds the pressure gradient that drives mass flow.
- Mass flow is a bulk movement of solution — solutes and water move together — which is why even substances not directly loaded (e.g. some amino acids, hormones) are carried along.
Xylem vessel elements are specialised cells that are adapted for the transport of water.
Which statement correctly matches an adaptation of a xylem vessel element to its function?
Options
A Cytoplasm is only found in a thin layer next to the cell walls and does not contain any organelles. This reduces resistance to the flow of water in the xylem vessels.
B The end walls between xylem vessel elements have partially broken down, forming end plates. This reduces resistance to the flow of water in the xylem vessel.
C The walls of the xylem vessel elements contain cellulose that is hydrophilic and can form hydrogen bonds to water, allowing adhesion of water molecules to the vessel walls.
D Xylem vessel elements have plasmodesmata that connect them with companion cells. The companion cells provide ATP, which is needed for the transport of water.
Working
- A is incorrect because xylem vessel elements are dead at maturity and contain no cytoplasm at all.
- B is incorrect because the end walls are completely broken down, not partially, and the structures are called perforation plates, not 'end plates'.
- C is correct: cellulose in the vessel walls is hydrophilic and hydrogen-bonds to water, allowing adhesion of water to the walls. This adhesion, together with cohesion between water molecules, supports the upward pull of the transpiration stream.
- D is incorrect: companion cells are associated with sieve tube elements of the phloem, not xylem vessel elements, and water transport in xylem is passive and does not require ATP.
Answer
C
C
Background Concept
Xylem is the plant tissue that transports water and dissolved mineral ions from the roots to the rest of the plant. A xylem vessel is a long, continuous tube formed from many xylem vessel elements joined end to end. Each vessel element is a dead, empty cell at maturity: its cytoplasm and organelles have been lost, and its end walls have been broken down to form perforation plates, leaving a continuous hollow lumen through which water can flow with very little resistance. The lateral cell walls remain and are thickened and reinforced with lignin to withstand the negative pressure (tension) generated as water is pulled up the plant.
The mechanism that moves this water is the cohesion–tension theory. Water evaporates from the mesophyll cell walls into the air spaces of the leaf and diffuses out through the stomata (transpiration). This sets up a tension (a pull under negative pressure) in the continuous column of water in the xylem. The column does not break because:
- water molecules cohere to each other through hydrogen bonding (cohesion);
- water molecules adhere to the hydrophilic inner surface of the xylem vessel walls through hydrogen bonding (adhesion), which is made possible by the cellulose component of those walls.
Companion cells, by contrast, are parenchyma cells that are metabolically active and supply ATP and other molecules to the sieve tube elements of the phloem, not to xylem vessel elements. Phloem transports assimilates (e.g. sucrose) by an energy-dependent mass flow driven by proton pumps in the companion cell plasma membrane.
Understanding the Question
The stem describes xylem vessel elements as cells specialised for water transport and asks which option correctly matches a structural adaptation to its function. Each option states a structural feature and then links it to a functional consequence. The correct answer must be both structurally accurate and functionally appropriate. This is a typical CIE Paper 1 multiple choice that tests precise knowledge of xylem anatomy and the cohesion–tension theory rather than just broad recall.
Approach
For each option, check two things:
- Is the structure described correctly? Identify any inaccurate terms (e.g. 'partially broken down' vs 'completely broken down'; 'end plates' vs 'perforation plates'; 'plasmodesmata connecting to companion cells' applied to xylem).
- Is the stated functional consequence correct? Confirm that the adaptation genuinely contributes to water transport.
A single inaccuracy in the structure, or a functional claim that is biologically wrong, is enough to reject the option.
Step-by-Step Reasoning
-
Option A describes a 'thin layer' of cytoplasm lacking organelles next to the walls. Xylem vessel elements are dead at functional maturity — there is no cytoplasm at all, not even a thin layer. The aim of the statement (reducing resistance) is correct, but the structure described is wrong, so A is rejected.
-
Option B says the end walls have partially broken down to form end plates. The correct description is that the end walls have completely broken down to form perforation plates. The imprecise wording 'partially' and the wrong term 'end plates' make B incorrect, even though the functional point about reducing resistance is the right idea.
-
Option C states that the walls contain cellulose, which is hydrophilic and forms hydrogen bonds to water, allowing adhesion of water to the vessel walls. This is correct. Cellulose is the main polysaccharide of plant cell walls; its many hydroxyl (–OH) groups hydrogen-bond to water molecules, and this adhesion is one half of the cohesion–tension mechanism that holds the water column together and allows it to be pulled upward. The structure (cellulose in the walls) and the function (adhesion of water) are correctly matched.
-
Option D claims that xylem vessel elements have plasmodesmata connecting them to companion cells, which provide ATP for water transport. Companion cells are part of the phloem (associated with sieve tube elements), not the xylem. Xylem water transport is passive — driven by the evaporation of water from the leaves — and does not require ATP supplied by adjacent cells. The structure, the cellular association, and the functional claim are all wrong, so D is rejected.
Key Takeaways
- Xylem vessel elements are dead at maturity, with no cytoplasm or organelles, and with end walls that are completely broken down into perforation plates.
- Cellulose in the vessel walls is hydrophilic and forms hydrogen bonds with water, providing the adhesion component of the cohesion–tension mechanism.
- Companion cells belong to the phloem and supply ATP to sieve tube elements; they are not partners of xylem vessel elements.
- Water movement in xylem is passive (driven by transpiration pull); ATP is not directly required for bulk water transport.
Common Mistakes
- Believing that xylem vessel elements retain some cytoplasm — they do not; they are dead and empty at functional maturity.
- Writing or accepting that the end walls are partially broken down — they are completely lost, leaving perforation plates.
- Confusing xylem vessel elements with sieve tube elements and pairing xylem with companion cells. Companion cells are exclusively a phloem feature.
- Assuming water transport up a plant requires ATP supplied by surrounding cells. The transpiration stream is passive; ATP is needed in the phloem (for loading sucrose at the source), not in the xylem.
Things to Be Careful About
- The exam mark scheme will reject the wrong term 'end plates'; the correct term is 'perforation plates'.
- 'Adhesion' refers specifically to water sticking to the vessel wall; 'cohesion' refers to water molecules sticking to each other. The two terms are not interchangeable.
- Hydrogen bonding is the molecular interaction responsible for both adhesion (water to cellulose) and cohesion (water to water); the question's option C correctly identifies cellulose, not lignin, as the hydrophilic wall component responsible for adhesion.
A student makes an accurate labelled plan diagram of a section of a leaf containing a vascular bundle.
Which statement correctly describes part of their plan diagram?
Options
A The vascular bundle has labels for the xylem vessel elements, phloem sieve tube elements and companion cells.
B The vascular bundle is divided into two sections, with the section closer to the upper epidermis labelled as xylem and the other section labelled as phloem.
C In the section of the vascular bundle positioned closer to the lower epidermis, each sieve tube element has an associated companion cell.
D The phloem sieve tube elements are drawn with thick cell walls to represent the lignin in the walls.
Working
A plan diagram of a leaf shows the distribution of tissues — not individual cells.
- A is wrong: a plan diagram does not label individual cell types (vessel elements, sieve tube elements, companion cells); it labels tissues such as xylem and phloem.
- C is wrong: for the same reason — a plan diagram does not show individual sieve tube elements or their companion cells.
- D is wrong: phloem sieve tube elements do not have lignified walls; it is xylem vessels that are lignified.
- B is correct: in a typical dicot leaf the vascular bundle is divided into two regions, with xylem on the upper side (closer to the upper epidermis) and phloem on the lower side (closer to the lower epidermis), and these tissues are exactly what a plan diagram labels.
Answer
B
B
Background Concept
A plan diagram is a low-magnification drawing that shows the overall distribution of tissues in a specimen, with no individual cells drawn. Only the outlines of tissues are shown, using clear continuous lines, and each tissue is labelled (e.g. upper epidermis, palisade mesophyll, spongy mesophyll, lower epidermis, xylem, phloem, vascular bundle, cuticle). Plan diagrams are drawn from low-power observations of a microscope slide or a print of a micrograph.
In a typical dicotyledonous leaf, the midrib and each lateral vein contain a vascular bundle in which:
- Xylem lies on the upper side of the bundle, closer to the upper epidermis. Xylem vessels are dead, hollow tubes with lignified walls thickened to resist the tension of the transpiration pull and to prevent the vessels collapsing inwards.
- Phloem lies on the lower side of the bundle, closer to the lower epidermis. Phloem sieve tube elements are living cells with thin cellulose walls (no lignin), and each sieve tube element is associated with one or more companion cells that supply it with ATP and metabolites.
The xylem-on-top / phloem-below arrangement is essentially the opposite of a young dicot stem, where the phloem is external to the xylem.
Understanding the Question
This is a multiple-choice question testing whether the student can recognise what should and should not appear in an accurate plan diagram of a leaf section. Each option is a statement about part of the diagram, and only one is correct. The candidate must apply two pieces of knowledge simultaneously: (1) the conventions of plan-diagram drawing, and (2) the structure and arrangement of xylem and phloem in a leaf vascular bundle.
Approach
Eliminate options by checking each against:
- Plan-diagram conventions — tissues are labelled, not individual cells; lignin-related features (thick walls) belong to xylem not phloem.
- Leaf vascular bundle anatomy — xylem is upper, phloem is lower; only xylem walls are lignified.
Step-by-Step Reasoning
- Option A is wrong because a plan diagram does not label individual cell types such as xylem vessel elements, phloem sieve tube elements, or companion cells. Plan diagrams show tissue distribution, not cellular detail. That level of detail belongs in a high-power cell drawing.
- Option C is wrong for the same reason. Even though it is true that each sieve tube element does have an associated companion cell in real phloem, a plan diagram would not show or label these individual cells. The phloem tissue as a whole is labelled, not its constituent cells.
- Option D is wrong because phloem sieve tube elements do not have lignified walls. Their walls are thin and made of cellulose. The thick walls reinforced with lignin are a feature of xylem vessels (and tracheids). Drawing thick walls on phloem would be biologically incorrect as well as inappropriate in a plan diagram.
- Option B is correct. In a typical dicot leaf the vascular bundle is split into an upper region of xylem (closer to the upper epidermis) and a lower region of phloem (closer to the lower epidermis). These two regions are exactly what a plan diagram should label.
Key Takeaways
- A plan diagram shows tissue distribution only — never individual cells, and never subcellular detail.
- In a dicot leaf vascular bundle, xylem is uppermost (towards the upper epidermis) and phloem is below it (towards the lower epidermis).
- Lignin is found in xylem walls, not phloem. Sieve tube elements have thin cellulose walls and are associated with companion cells.
- When asked about a diagram, always check that the answer respects the type of diagram being drawn (plan vs cell drawing) and the biology being depicted.
Common Mistakes
- Confusing which tissue is lignified — many students think both xylem and phloem have thickened, supportive walls, but only xylem is lignified. Phloem walls are thin.
- Confusing leaf and stem arrangement — in a young dicot stem the phloem is on the outside and xylem towards the centre, but in a leaf the xylem is on the upper side of the bundle.
- Trying to label individual cells on a plan diagram — plan diagrams show tissues, not cells. Cell-level detail belongs in a high-power drawing.
Things to Be Careful About
- Always match the labels in the option to the type of diagram the question is about. If the question specifies a plan diagram, options that name individual cell types (vessel elements, sieve tube elements, companion cells) should immediately be treated with suspicion.
- The lignified/thick-wall statement is only ever true of xylem, never phloem.
- "Section closer to the upper epidermis" = xylem; "section closer to the lower epidermis" = phloem — this is the convention expected in a leaf plan diagram.
Some babies are born with a hole between the right and left atria. These babies are found to have an increased number of red blood cells.
What is the reason for this increase in red blood cells in these babies?
Options
A Blood is pumped faster, which causes more blood to circulate in the heart.
B More blood is needed in the heart because the pressure is lower.
C Their haemoglobin has a higher affinity for oxygen.
D There is a lower oxygen concentration in the body of the newborn baby.
Working
A hole between the right and left atria (an atrial septal defect) allows oxygenated blood from the left atrium to flow back into the right atrium (a left-to-right shunt) instead of being pumped to the body. This means that less oxygenated blood is delivered to the body tissues per unit time, lowering the oxygen concentration in the body. The kidneys respond to this reduced tissue oxygen by releasing erythropoietin, which stimulates the bone marrow to produce more red blood cells.
A — incorrect. A faster heart rate does not directly stimulate red blood cell production.
B — incorrect. Lower pressure in the heart does not trigger erythropoiesis.
C — incorrect. A higher haemoglobin affinity for oxygen would mean more oxygen is loaded per red blood cell, reducing (not increasing) the need for more red blood cells.
D — correct. The shunt reduces oxygen delivery to the body, and this low tissue oxygen stimulates erythropoietin release and more red blood cell production.
Answer
D
D
Background Concept
The heart has four chambers: right atrium, right ventricle, left atrium and left ventricle. Blood normally follows one direction: from the body into the right side of the heart, then to the lungs, then back to the left side, and out to the body. The left side of the heart generates higher pressure than the right side because it must pump blood through the systemic circulation. The septum — the muscular wall between the two atria and the two ventricles — normally prevents oxygenated and deoxygenated blood from mixing.
Red blood cell (erythrocyte) production is controlled by the hormone erythropoietin (EPO), which is released mainly by the kidneys in response to low oxygen tension in the tissues (hypoxia). EPO travels in the blood to the bone marrow, where it stimulates the proliferation and differentiation of erythroid progenitor cells, raising the red cell count and therefore the blood's oxygen-carrying capacity.
Understanding the Question
The question describes a congenital heart defect — a hole between the right and left atria, known as an atrial septal defect (ASD). It tells us that affected babies have an increased number of red blood cells, and asks us to explain why. The command word is implied: select the option that correctly explains the link between the structural defect and the raised red cell count.
The key idea is that the heart defect alters blood flow, which alters oxygen delivery to the body's tissues, and the body responds to that change by adjusting its red cell production.
Approach
Work out what the hole does to blood flow and oxygen delivery, then connect that to the control of erythropoiesis:
- In the normal heart, the left atrium pressure is higher than the right atrium pressure.
- An ASD allows blood to flow directly from the left atrium into the right atrium (a left-to-right shunt). This means some oxygenated blood that should have been pumped out to the body is instead recycled back through the lungs.
- The net effect is reduced delivery of oxygen to the systemic tissues — the body's tissues experience a lower oxygen concentration than they should.
- Low tissue oxygen is detected by the kidneys, which release erythropoietin.
- Erythropoietin stimulates the bone marrow to produce more red blood cells, compensating for the reduced oxygen delivery.
Step-by-Step Reasoning
- Option A — "Blood is pumped faster, which causes more blood to circulate in the heart." A faster heart rate is not the stimulus for erythropoiesis. The stimulus is low tissue oxygen, sensed by the kidneys. This option is therefore wrong.
- Option B — "More blood is needed in the heart because the pressure is lower." Lower pressure inside the heart does not trigger red cell production. Pressure is not the signal the kidneys respond to. This option is therefore wrong.
- Option C — "Their haemoglobin has a higher affinity for oxygen." A higher affinity for oxygen would mean each red blood cell carries oxygen more efficiently, reducing the need for more red blood cells — the opposite of what is observed. The defect does not change haemoglobin's affinity for oxygen. This option is therefore wrong.
- Option D — "There is a lower oxygen concentration in the body of the newborn baby." The left-to-right shunt reduces effective oxygen delivery to body tissues, producing mild systemic hypoxia. The kidneys sense this and release erythropoietin, which increases red blood cell production. This option correctly identifies the cause.
Key Takeaways
- A hole between the atria is an atrial septal defect (ASD), which produces a left-to-right shunt because the left atrium has higher pressure.
- A left-to-right shunt reduces the volume of oxygenated blood reaching the systemic circulation, lowering tissue oxygen levels.
- Tissue hypoxia is detected by the kidneys, which release erythropoietin.
- Erythropoietin stimulates erythropoiesis in the bone marrow, raising the red blood cell count to compensate for the reduced oxygen delivery.
Common Mistakes
- Confusing cause and effect for the shunt direction. Some students think a right-to-left shunt occurs (mixing deoxygenated blood into the left side), but in an uncomplicated ASD the higher left-sided pressure drives blood left-to-right. The systemic effect is still reduced effective oxygen delivery to the body.
- Confusing higher oxygen affinity with more oxygen delivery. A higher affinity makes haemoglobin hold on to oxygen more tightly, which actually reduces unloading at the tissues — it does not raise the red cell count.
- Attributing the raised red cell count to "blood moving faster" or "more blood in the heart." The correct link is oxygen delivery, not flow rate or pressure.
Things to Be Careful About
- The question is about the body's compensatory response, not the mechanics of the shunt itself. Stay focused on the link between the structural defect and the hormonal control of erythropoiesis.
- Erythropoietin is released by the kidneys in response to low tissue oxygen, not in response to low blood oxygen directly. The body's tissues sensing reduced oxygen is the key trigger.
- Do not be misled by options that sound plausible but do not actually connect to red blood cell production: blood flow rate, pressure changes, and haemoglobin affinity are not the controlling variables here.
An increase in carbon dioxide in human blood shifts the oxyhaemoglobin dissociation curve to the right.
What is the explanation for this effect?
Options
A An increase in carbon dioxide concentration increases the breathing rate.
B Carbon dioxide is more soluble than oxygen and displaces it.
C Diffusion of carbon dioxide between the alveoli and the blood is more rapid.
D Increasing the concentration decreases haemoglobin affinity for oxygen.
Working
Carbon dioxide enters red blood cells and reacts with water, catalysed by carbonic anhydrase:
The increased binds to haemoglobin, lowering its affinity for oxygen. As a result, oxygen is released more readily at any given partial pressure, shifting the oxyhaemoglobin dissociation curve to the right (the Bohr shift).
A — incorrect: a faster breathing rate is a consequence of high , not the mechanism shifting the curve.
B — incorrect: does not displace by being more soluble; the two gases bind to different sites/forms.
C — incorrect: a faster diffusion rate does not, by itself, change haemoglobin's affinity for oxygen.
D — correct: increased lowers haemoglobin's affinity for , shifting the curve to the right.
Answer
D
D
Background Concept
Haemoglobin is a globular protein in red blood cells that binds oxygen to form oxyhaemoglobin. Its affinity for oxygen is not fixed — it depends on the local chemical environment. The relationship between the partial pressure of oxygen () and the percentage saturation of haemoglobin is shown by the oxygen dissociation curve (an S-shaped/sigmoid curve).
Two physiological factors shift this curve:
- A rightward shift means haemoglobin releases oxygen more readily (lower affinity) — useful in actively respiring tissues that need .
- A leftward shift means haemoglobin holds onto oxygen more tightly (higher affinity) — useful at the lungs.
The Bohr shift/effect describes how increasing (and the resulting fall in pH) shifts the curve to the right, so that more oxygen is unloaded where it is needed most — in respiring tissues that produce .
The key reaction inside red blood cells is catalysed by the enzyme carbonic anhydrase:
The ions produced bind to haemoglobin (specifically to histidine residues and other amino acid side chains), stabilising the deoxygenated (T) form. This stabilises a conformation with a lower affinity for , which is exactly what the rightward shift represents.
Understanding the Question
The question states a fact: an increase in blood shifts the oxyhaemoglobin dissociation curve to the right. It then asks for the explanation of this effect. The command word is "what is the explanation" — so we need to give the underlying mechanism, not just describe a consequence.
Each option offers a different kind of explanation:
- A attributes the shift to a downstream physiological response (breathing rate).
- B proposes a competitive/solubility displacement at the binding site.
- C claims a kinetic (diffusion) explanation.
- D identifies the chemical mechanism via changing haemoglobin's affinity.
Only D correctly identifies the Bohr effect mechanism.
Approach
Recall the Bohr effect: (via carbonic anhydrase) binds haemoglobin affinity for falls curve shifts right. The answer must mention the change in haemoglobin's oxygen affinity, mediated by .
Step-by-Step Reasoning
- Carbon dioxide enters red blood cells in respiring tissues down its partial pressure gradient.
- Inside the red cell, carbonic anhydrase rapidly catalyses the hydration of to carbonic acid, which then dissociates into and .
- The increased concentration binds to haemoglobin, stabilising its deoxygenated (taut/T) state.
- Stabilising the T state lowers haemoglobin's affinity for — for any given , less oxygen is bound (or equivalently, oxyhaemoglobin dissociates more readily).
- This is graphed as a rightward shift of the dissociation curve — the Bohr shift.
- Option D states this mechanism directly. The other options describe events that may occur alongside (A: hyperventilation is a consequence of chemoreceptor detection of high /low pH; B: is not transported on the same site as — they bind different forms/proteins; C: faster diffusion does not change binding affinity).
Key Takeaways
- The Bohr effect links production in respiring tissues to increased release from haemoglobin.
- The mediator is produced by carbonic anhydrase, which lowers haemoglobin's affinity.
- A rightward shift of the dissociation curve = lower affinity = easier unloading of .
- This is a classic example of how protein function (haemoglobin affinity) responds to small-molecule modulators (protons, , 2,3-BPG).
Common Mistakes
- Conflating "more is produced" with " displaces " (option B) — they are transported differently and do not compete at the same binding site.
- Confusing the Bohr effect with the chloride shift: both involve , but the chloride shift is about exchange across the red cell membrane, not about the dissociation curve.
- Choosing A because hyperventilation does follow high — but the question asks for the biochemical mechanism behind the curve shift, not a downstream consequence.
- Confusing the direction: high / shifts the curve right (lower affinity), not left.
Things to Be Careful About
- The Bohr shift is about a change in affinity, not a change in capacity — maximum saturation is unchanged at very high , so the upper plateau of the curve is the same; only the steep part shifts.
- The question uses the word "explanation" — a single consequence (e.g. "more is released") is not by itself an explanation of the shift; the mark requires linking the shift to changed affinity via .
- Remember the exact wording: decreases haemoglobin's affinity for — saying "decreases oxygen binding" alone may be too vague to earn the mark on free-response, but for this MCQ option D is the precise match.
‘Heart block’ is a disease which can result in a lower than normal heart rate. A doctor treating a person with heart block found that electrical impulses were initiated as normal but were not correctly conducted to the ventricles, so the rate of ventricular contraction was slowed.
Which parts may not be functioning correctly in the person with heart block?
1 atrioventricular node (AVN)
2 Purkyne tissue
3 sinoatrial node (SAN)
Options
A 1 and 2
B 1 and 3
C 2 and 3
D 3 only
Working
The cardiac conduction pathway:
- SAN initiates the impulse (pacemaker) — in heart block, impulses are initiated as normal, so the SAN is working.
- AVN receives the impulse from the atria and passes it to the ventricles via the Bundle of His — if faulty, the impulse is not conducted to the ventricles.
- Purkyne tissue spreads the impulse through the ventricular walls to cause ventricular contraction from the apex upwards — if faulty, the rate of ventricular contraction is slowed.
Therefore, the AVN (1) and Purkyne tissue (2) may not be functioning correctly, but not the SAN (3).
Answer
A
A
Background Concept
The heart is myogenic — it generates its own electrical impulses without needing nerve stimulation. A specialised conducting system coordinates the contraction of the cardiac muscle so that the atria contract first (from the top down) followed almost immediately by the ventricles (from the apex upwards).
The components of this conduction system, in order, are:
- Sinoatrial node (SAN) — located in the wall of the right atrium. It sets the basic rhythm by generating impulses at the highest natural frequency, so it acts as the pacemaker.
- Atrioventricular node (AVN) — located in the septum between the atria. It introduces a short delay (about 0.1–0.2 s) so the atria finish contracting and emptying before the ventricles contract. After the delay, the impulse passes into the Bundle of His.
- Purkyne tissue (fibres) — runs down the interventricular septum and branches through the ventricular walls, carrying the impulse rapidly so that the ventricles contract almost simultaneously from the apex upwards, efficiently pushing blood out into the pulmonary artery and aorta.
'Heart block' refers to any condition in which the conduction of the impulse from atria to ventricles (or through the ventricles) is impaired, producing a slower than normal ventricular rate.
Understanding the Question
The stem gives us two key clinical observations:
- Impulses are initiated as normal — the SAN is working.
- Impulses are not correctly conducted to the ventricles, and the rate of ventricular contraction is slowed.
We must decide which of the three listed structures (AVN, Purkyne tissue, SAN) could plausibly be responsible for this picture. The answer combines the two defective possibilities and excludes the one that is demonstrably working.
Approach
Use the order of the conduction pathway: an impulse that is initiated normally but fails to reach the ventricles in the normal way must be getting blocked after the SAN — i.e. at the AVN or within the ventricular conducting tissue. The SAN itself, by the wording of the stem, is functioning, so it is excluded.
Step-by-Step Reasoning
- SAN (3): The question states that impulses are initiated as normal. The SAN is the only structure that initiates impulses. Therefore the SAN is functioning and cannot be the cause. Statement 3 is excluded.
- AVN (1): The AVN is the gateway between the atria and the ventricles. If it is not conducting impulses correctly, the ventricles receive fewer or weaker signals and contract more slowly. AVN dysfunction directly matches the description 'impulses not correctly conducted to the ventricles'. Statement 1 is included.
- Purkyne tissue (2): Purkyne fibres distribute the impulse across the ventricular myocardium. Damage to this tissue slows the spread of excitation through the ventricles and reduces the rate/co-ordination of ventricular contraction. Purkyne tissue dysfunction also matches the described symptoms. Statement 2 is included.
The faulty parts are therefore 1 and 2 — option A.
Key Takeaways
- Heart myogenicity and the sequence SAN → AVN → Bundle of His → Purkyne fibres → ventricular contraction.
- Reading a clinical description and tracing where in the pathway the failure could occur.
- The SAN is identified by the word initiates; the AVN by conducts to the ventricles; Purkyne fibres by spreads through the ventricles.
Common Mistakes
- Choosing B (1 and 3) because the AVN is involved in conduction — but the SAN is explicitly stated to be initiating impulses normally, so it cannot be the failing component.
- Choosing C (2 and 3) because the ventricles are slow — forgetting that the SAN is the initiator, not the ventricular conductor.
- Choosing D (3 only) — confusing the pacemaker (SAN) with the ventricular conducting system.
- Confusing heart block (a conduction problem) with bradycardia caused by the SAN itself firing too slowly.
Things to Be Careful About
- 'Initiated as normal' is the giveaway that the SAN is fine — always re-read the stem for words like initiated, conducted, spread, and contracted, because each pinpoints a different structure.
- The AVN and Purkyne tissue both lie on the atrial-to-ventricular pathway; the question is asking which could explain the symptoms, and either of them on its own could — hence both are included.
The pumping action of the heart creates hydrostatic pressure in the blood. The table shows the hydrostatic pressure in a blood capillary.
| arteriole end of capillary / KPa | venule end of capillary / KPa | |
|---|---|---|
| hydrostatic pressure in blood | 4.2 | 1.7 |
About 90% of the tissue fluid which surrounds a capillary is returned to the blood at the venule end.
How is this achieved?
Options
A The capillary wall is more permeable at the arteriole end than the venule end.
B The hydrostatic pressure in tissue fluid is higher than in blood.
C There is a higher concentration of dissolved solutes in tissue fluid than in blood.
D There is osmotic movement of water from the tissue fluid into the blood.
Working
At the arteriole end, the high hydrostatic blood pressure (4.2 kPa) forces fluid out of the capillary into the surrounding tissue. By the venule end, this hydrostatic pressure has fallen to 1.7 kPa and is no longer sufficient to force fluid out.
Large plasma proteins (e.g. albumin) remain inside the capillary and lower the water potential of the blood. At the venule end, the osmotic effect of these plasma proteins outweighs the reduced hydrostatic pressure, so water moves by osmosis from the tissue fluid (higher water potential) into the blood (lower water potential).
Answer
D
D
Background Concept
Tissue fluid is formed by filtration of blood plasma across the thin, partially permeable walls of capillaries. Two opposing forces determine the direction of fluid movement across a capillary wall:
- Hydrostatic pressure — the physical pressure of the blood, generated mainly by the pumping of the heart. This tends to push fluid out of the capillary.
- Osmotic pressure (due to plasma proteins) — large solute molecules such as plasma albumins cannot cross the capillary wall and remain in the blood. They lower the water potential () of the blood, so water tends to move into the capillary by osmosis.
The net filtration pressure at any point along the capillary = hydrostatic pressure of blood − hydrostatic pressure of tissue fluid − plasma-protein osmotic pressure. Where this is positive, fluid is forced out; where it is negative, fluid is drawn back in.
Understanding the Question
The table gives the hydrostatic pressure of blood at the two ends of a capillary (4.2 kPa at the arteriole end; 1.7 kPa at the venule end). The question asks how ~90% of the tissue fluid surrounding the capillary is returned to the blood at the venule end. We need to identify the correct mechanism of reabsorption.
Approach
- Eliminate options that are factually wrong about permeability, pressure direction or solute distribution.
- Select the option that correctly identifies osmosis — driven by the plasma-protein osmotic gradient — as the mechanism of reabsorption at the venule end.
Step-by-Step Reasoning
Option A — "The capillary wall is more permeable at the arteriole end than the venule end." The wall of a continuous capillary is uniformly partially permeable along its length; it is not differentially permeable. This does not explain reabsorption. Incorrect.
Option B — "The hydrostatic pressure in tissue fluid is higher than in blood." If this were true, fluid would be forced into the blood everywhere along the capillary and there would be no net filtration. In reality, hydrostatic pressure in the tissue fluid is lower than in the capillary blood; it is the blood hydrostatic pressure that drives filtration out at the arteriole end. Incorrect.
Option C — "There is a higher concentration of dissolved solutes in tissue fluid than in blood." The opposite is true. Plasma proteins (especially albumin) are too large to cross the capillary wall in significant quantities, so the blood has the higher solute concentration and the lower (more negative) water potential. This is precisely what enables water to return osmotically. Incorrect.
Option D — "There is osmotic movement of water from the tissue fluid into the blood." Correct. Plasma proteins trapped in the blood give blood a lower water potential than tissue fluid. At the venule end, the capillary hydrostatic pressure has fallen to 1.7 kPa, so it no longer overrides this osmotic gradient; the net force now draws water into the capillary by osmosis. This returns about 90% of the tissue fluid to the bloodstream. The remaining ~10% is returned via the lymph system.
Key Takeaways
- Tissue fluid forms at the arteriole end where high hydrostatic pressure forces fluid out.
- Plasma proteins (e.g. albumin) lower the blood's water potential, drawing water back by osmosis at the venule end.
- About 90% of tissue fluid is reabsorbed osmotically; the rest drains into the lymphatic system.
Common Mistakes
- Confusing the direction of the hydrostatic pressure gradient — tissue-fluid hydrostatic pressure is lower than blood, not higher.
- Forgetting that plasma proteins cannot cross the capillary wall, which is why the osmotic gradient exists.
- Saying the arteriole end has "higher permeability" — the capillary wall is uniformly partially permeable.
Things to Be Careful About
- The mark scheme expects the mechanism (osmosis due to plasma-protein osmotic pressure), not just the observation that water returns. Stating only that "water returns to the blood" would be too vague to earn the mark.
- Remember that about 10% of tissue fluid returns via the lymphatic system, not via reabsorption at the venule end — a precise answer distinguishes these two routes.
What is the function of cilia in the gas exchange system?
Options
A to increase the surface area
B to move mucus
C to produce mucus
D to trap dust and pathogens
Working
Cilia are tiny hair-like structures on the surface of ciliated epithelial cells lining much of the gas exchange system (trachea, bronchi, bronchioles). They beat in a coordinated, wave-like rhythm to propel the layer of mucus (secreted by goblet cells and mucous glands) upwards towards the pharynx, where it can be swallowed.
- A is wrong: cilia are motile projections, not microvilli; they do not increase surface area.
- C is wrong: mucus is produced by goblet cells and mucous glands, not by cilia.
- D is wrong: dust and pathogens are trapped in the sticky mucus layer; cilia then move that mucus, but they do not perform the trapping themselves.
Answer
B
B
Background Concept
The gas exchange system (trachea, bronchi, bronchioles) is lined by a specialised epithelium. Most of the conducting airways are lined by ciliated epithelium, with scattered goblet cells and underlying mucous glands. Goblet cells and mucous glands secrete mucus, a sticky glycoprotein-rich fluid that traps inhaled particles such as dust, smoke particles, microorganisms (bacteria, viruses, fungal spores) and other debris. Sitting on top of this mucus is the ciliated epithelium. Each ciliated cell carries hundreds of cilia — slender projections of the cell surface, about 5–10 µm long, containing a core of microtubules arranged as a 9 + 2 axoneme. Cilia beat in a metachronal rhythm (coordinated waves) with a fast power stroke in one direction and a slower recovery stroke, propelling the mucus blanket upwards towards the pharynx (the mucociliary escalator). Once at the pharynx, the mucus is swallowed and the trapped material is destroyed by stomach acid.
Understanding the Question
This is a straightforward multiple-choice question (Paper 1, AS Level) asking for the specific function of cilia in the gas exchange system. The command word is implicit "What is the function…" — the candidate must select the single best answer. The distractors test whether the student confuses the roles of the different cell types and secretions in the airway lining.
Approach
Recall the division of labour in the airway epithelium: goblet cells/mucous glands produce mucus; the mucus traps particles; cilia move the mucus. Then match each role to the options.
Step-by-Step Reasoning
- Option A — to increase the surface area: Microvilli (e.g. on intestinal epithelial cells) increase surface area; cilia are motile and do not have this function. Reject.
- Option B — to move mucus: Correct. Cilia beat in a coordinated wave to propel the mucus layer (with its trapped debris) up the airways towards the pharynx. This is the textbook function of ciliated epithelium in the gas exchange system.
- Option C — to produce mucus: Mucus is a secretion of goblet cells and submucosal mucous glands, not of cilia. Cilia contain no secretory machinery for mucus. Reject.
- Option D — to trap dust and pathogens: Trapping is a physical property of the sticky mucus; cilia are motile, not adhesive. Reject.
The mucociliary escalator is essential for keeping the lower airways sterile. Damage to cilia (e.g. by smoking, which paralyses and destroys cilia) impairs this clearance mechanism, contributing to the chronic cough and infection seen in chronic obstructive pulmonary disease (COPD).
Key Takeaways
- Cilia = movement of mucus (mucociliary escalator).
- Goblet cells / mucous glands = produce mucus.
- Mucus = traps dust and pathogens.
- Smoking and pollutants paralyse/destroy cilia, reducing clearance and predisposing to infection.
Common Mistakes
- Confusing cilia with goblet cells: candidates often pick "produce mucus" because both cells sit side by side in the epithelium.
- Picking "trap dust and pathogens" because cilia look like tiny hairs that might filter air — but the trapping is done by the mucus layer they move, not by the cilia themselves.
- Confusing cilia with microvilli, leading to the "increase surface area" answer.
Things to Be Careful About
- The mark scheme is precise: the function of cilia is to move mucus. Do not credit "filter" or "clean the air" as these describe the system, not cilia specifically.
- Read each option against the labelled cell type: goblet cells → produce; mucus → trap; cilia → move.
Which tissues are present in the walls of a trachea and an alveolus?
Options
| epithelium with goblet cells | smooth muscle | ||
|---|---|---|---|
| A | trachea | ✓ | ✓ |
| alveolus | ✗ | ✗ | |
| B | trachea | ✓ | ✓ |
| alveolus | ✗ | ✓ | |
| C | trachea | ✓ | ✗ |
| alveolus | ✓ | ✓ | |
| D | trachea | ✗ | ✓ |
| alveolus | ✗ | ✗ |
key
✓ = present
✗ = not present
Working
The trachea wall contains pseudostratified ciliated epithelium with goblet cells (which secrete mucus) and a layer of smooth muscle (in addition to C-shaped cartilage rings and elastic fibres). The alveolus wall consists of very thin simple squamous epithelium with elastic fibres only — there are no goblet cells and no smooth muscle, because the alveoli need to be maximally thin and stretchable for efficient gas exchange, not for trapping or moving air.
This matches option A: trachea has both goblet cells and smooth muscle, alveolus has neither.
Answer
A
A
Background Concept
The human gas exchange system is a branching tube (trachea → bronchi → bronchioles → alveoli) whose wall structure changes along its length to match its function. Near the top of the airway the wall is thick, rigid and lined with mucus-secreting cells, because its job is to clean, warm and moisten incoming air. Deep in the lung the wall is paper-thin and elastic, because its job is to allow rapid diffusion of oxygen and carbon dioxide between air and blood.
The trachea wall contains:
- C-shaped rings of hyaline cartilage (keep the airway open).
- Smooth muscle (between the ends of the cartilage rings and the mucosa) — can constrict the airway.
- Elastic fibres (allow recoil).
- Pseudostratified ciliated epithelium with many goblet cells that secrete sticky mucus to trap dust and pathogens. The cilia beat the mucus upwards towards the throat.
The alveolus wall contains:
- A single layer of simple squamous epithelium (Type I pneumocytes) — extremely thin (~0.1–0.2 µm) to minimise diffusion distance.
- Elastic fibres (so the alveolus can stretch on inhalation and recoil on exhalation).
- It does NOT contain goblet cells (no air-cleaning needed at the gas exchange surface) and does NOT contain smooth muscle (would only slow diffusion and obstruct flow).
Understanding the Question
The question is a multiple-choice item asking which combination of two specific tissues — epithelium with goblet cells, and smooth muscle — is found in the trachea wall and the alveolus wall. The candidate must know the tissue composition of each structure and match it to the tick/cross table.
Approach
Apply knowledge of the histology of the human gas exchange system:
- Decide which tissues are in the trachea wall.
- Decide which tissues are in the alveolus wall.
- Select the option whose ticks and crosses match.
Step-by-Step Reasoning
- Trachea: both tissues present. The trachea is lined by pseudostratified ciliated epithelium with numerous goblet cells, and its wall contains a layer of smooth muscle. So: goblet cells ✓, smooth muscle ✓.
- Alveolus: neither tissue present. Alveoli are lined by simple squamous epithelium only, and their wall is a delicate elastic meshwork — no mucus-secreting cells (the air reaching the alveoli has already been filtered higher up) and no muscle layer (it would only impede gas exchange and add unnecessary thickness). So: goblet cells ✗, smooth muscle ✗.
- This corresponds to Option A.
Why the distractors are wrong:
- B puts smooth muscle in the alveolus. Alveolar walls have no muscle layer; their recoil is passive and elastic.
- C puts goblet cells in the alveolus. Goblet cells belong to the conducting airway (trachea, bronchi, larger bronchioles) where they trap debris. At the gas exchange surface, mucus would block diffusion.
- D removes goblet cells from the trachea, which is false — the trachea is the prime site of mucus secretion in the airway.
Key Takeaways
- The trachea wall has: ciliated epithelium with goblet cells, smooth muscle, cartilage and elastic fibres.
- The alveolus wall has: simple squamous epithelium and elastic fibres only.
- The general rule: structures whose function is air conduction and cleaning carry goblet cells, cilia, cartilage and muscle; structures whose function is gas exchange are stripped back to the thinnest possible epithelium and elastic recoil tissue.
Common Mistakes
- Assuming that all parts of the gas exchange system have the same wall structure — they don't, and the structure changes progressively down the airway.
- Thinking goblet cells line the alveoli because they are 'part of the lung' — goblet cells are confined to the conducting zone (trachea, bronchi, larger bronchioles), never the respiratory zone.
- Confusing elastic fibres (passive recoil) with smooth muscle (active contraction) — the alveolus has the former but not the latter.
Things to Be Careful About
- The phrase 'epithelium with goblet cells' is specific; the tracheal lining is ciliated epithelium with goblet cells, and this whole combination is what the question is asking about.
- The small bronchioles do have smooth muscle (which constricts in asthma), but they are not alveoli — make sure you are answering for the structure named in the question.
The photomicrograph shows part of a bronchus.
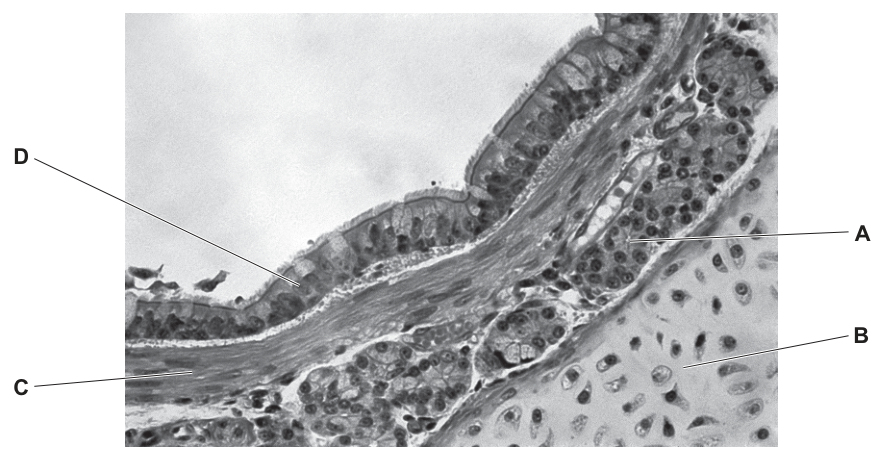
Which label identifies cartilage?
Options
A A
B B
C C
D D
Working
Cartilage in a stained section appears as cells (chondrocytes) sitting inside small spaces (lacunae) embedded in a dense, often pink-stained matrix. In this micrograph, label B points to tissue showing exactly this appearance, so B is cartilage.
The other labels identify different structures:
- A – smooth muscle (elongated, darker-staining muscle cells in the wall)
- C – ciliated epithelium (a single layer of columnar cells lining the airway)
- D – the lumen (the empty airway space)
Answer
B
B
Background Concept
The wall of a bronchus is built from several distinct tissue layers, which are easiest to remember going from the airway lumen outwards:
- Ciliated epithelium – pseudostratified columnar epithelium with goblet cells. It lines the lumen, traps dust/microbes in mucus and moves the mucus upward by ciliary beating.
- Lamina propria / connective tissue – loose tissue beneath the epithelium containing blood vessels, nerves and lymphatics.
- Smooth muscle – a layer of contracting muscle that can narrow the airway (bronchoconstriction) during an asthma attack or in response to irritants.
- Cartilage – C-shaped (incomplete) rings of hyaline cartilage that hold the airway open and prevent it from collapsing during inhalation when pressure inside falls.
- Adventitia / outer connective tissue – binds the bronchus to surrounding lung tissue.
Under a light microscope, each layer has a characteristic appearance:
- Epithelium: a tidy row of tall cells with prominent dark nuclei and, often, a fuzzy apical surface (the cilia).
- Smooth muscle: elongated cells with cigar-shaped nuclei, arranged in bundles, staining pink/red with eosin.
- Cartilage: chondrocytes sitting in small white spaces called lacunae, scattered through a dense, often pale-staining matrix. The matrix is what makes cartilage look so different from the cellular layers around it.
- Lumen: just empty (air) space.
Understanding the Question
The candidate is shown a photomicrograph of a bronchus with four labels (A, B, C, D) and asked to identify which one is cartilage. This is a tissue-recognition task: you must match the appearance of the tissue at each label against the features of cartilage described above.
Approach
The fastest route to the answer is to scan each labelled region and ask: does this look like cartilage (cells in lacunae in a dense matrix)? If yes, that is the answer. If not, decide what it actually is – which lets you reject that label and move on.
Step-by-Step Reasoning
- Label D sits over the open space inside the bronchus. That is the lumen (the air-filled passage), not a tissue at all. Reject.
- Label C lies in the thin, regular layer of columnar cells with dark nuclei immediately bordering the lumen. That is the ciliated epithelium. Reject.
- Label A sits in a darker-staining layer that appears to consist of elongated, tightly packed cells just deep to the epithelium. That is consistent with smooth muscle. Reject.
- Label B points to a region in which cells are scattered, each cell sitting in its own small clear space (a lacuna), within a uniform pale matrix. This is the classic appearance of hyaline cartilage. ✓
Therefore the correct label for cartilage is B.
Key Takeaways
- Cartilage under the microscope = chondrocytes in lacunae within a matrix.
- The bronchus wall is layered (from lumen outwards): epithelium → smooth muscle → cartilage → adventitia.
- The C-shaped cartilage rings keep the airway patent; without them the bronchus would collapse on inspiration.
- Being able to recognise the main tissues of the gas-exchange system in a micrograph is a core practical skill for AS Biology (relevant to Paper 3 as well as MCQs).
Common Mistakes
- Confusing smooth muscle (elongated cells with cigar-shaped nuclei in bundles) with cartilage (rounded cells in lacunae in a matrix). They look quite different once you know to look for lacunae.
- Confusing connective tissue matrix with the empty lumen – both can appear pale, but only the lumen is a clear, empty space surrounded by epithelium.
- Selecting C because it is the most prominent layer near the lumen – the most prominent layer is often the epithelium, not the cartilage.
Things to Be Careful About
- Always read the line of the label carefully: A label that starts in one tissue may end pointing at another. Follow the arrow tip, not its tail.
- Cartilage can appear quite pale if the matrix does not stain strongly, but the chondrocytes in lacunae are the giveaway – never accept cartilage without seeing these.
- The bronchus (and trachea) have cartilage, but the smaller bronchioles do not. If a micrograph shows cartilage, the airway is definitely a bronchus or larger.
Which structures or compounds are present in a typical cell that can be killed by penicillin?
1 circular DNA
2 cytoplasmic DNA
3 70S ribosomes
4 peptidoglycan
Options
A 1, 2, 3 and 4
B 1, 2 and 4 only
C 1 and 2 only
D 4 only
Working
Penicillin kills bacteria, which are prokaryotic cells. A typical bacterial cell has:
- 1 — Circular DNA: the single bacterial chromosome is a circular DNA molecule located in the cytoplasm.
- 2 — Cytoplasmic DNA: because there is no nucleus, the DNA is free in the cytoplasm (and plasmids add further cytoplasmic DNA).
- 3 — 70S ribosomes: bacterial ribosomes are 70S, smaller than the 80S ribosomes of eukaryotic cells.
- 4 — Peptidoglycan: the bacterial cell wall is made of peptidoglycan, which is the actual target of penicillin (it inhibits cross-linking during cell-wall synthesis).
All four features are present.
Answer
A
A
Background Concept
Antibiotics such as penicillin target structures that are found in bacteria but not in human (eukaryotic) cells — this is what makes them selectively toxic. To answer this question you need to recall the defining features of a prokaryotic (bacterial) cell and the mode of action of penicillin.
A typical bacterium:
- has no true nucleus; its single chromosome of circular DNA lies free in the cytoplasm, often together with smaller circular plasmids;
- carries 70S ribosomes (made of a 50S and a 30S subunit), in contrast to the 80S ribosomes of eukaryotic cytoplasm;
- is enclosed by a cell wall composed of peptidoglycan (murein), a mesh of sugar chains cross-linked by short peptide chains.
Penicillin works by inhibiting the enzyme transpeptidase, which cross-links the peptide chains of peptidoglycan. Without intact cross-links the cell wall cannot withstand osmotic pressure, so the bacterium lyses and dies. Human cells lack peptidoglycan, which is why penicillin is not directly toxic to them.
Understanding the Question
The stem asks which of the four listed items (1–4) are present in a typical cell that can be killed by penicillin. That is a roundabout way of asking: which of these are features of a typical bacterial cell? Each item must be evaluated on its own.
Approach
The cleanest way to attack the question is:
- Identify the target of penicillin → bacteria (prokaryotes).
- Check each numbered item against the standard list of prokaryotic features.
- Select the option that contains only the items that are TRUE of bacteria.
Step-by-Step Reasoning
- 1 — Circular DNA: TRUE. The bacterial chromosome is a single, closed, circular DNA molecule. Eukaryotic chromosomes are linear.
- 2 — Cytoplasmic DNA: TRUE. With no nuclear envelope, the DNA sits in the cytoplasm. Plasmids are also cytoplasmic DNA. So this is a correct feature of bacteria.
- 3 — 70S ribosomes: TRUE. All bacteria have 70S ribosomes, distinguishing them from the 80S cytoplasmic ribosomes of eukaryotes.
- 4 — Peptidoglycan: TRUE. Peptidoglycan is the polymer that forms the bacterial cell wall — and it is precisely the structure whose synthesis penicillin disrupts.
All four statements are correct, so the answer must include all of 1, 2, 3 and 4 — that is option A.
Key Takeaways
- Penicillin is selectively toxic because it interferes with peptidoglycan synthesis, a molecule unique to bacterial cell walls.
- A typical bacterium has: circular chromosomal DNA, DNA in the cytoplasm (no nucleus), 70S ribosomes, and a peptidoglycan cell wall.
- Distinguishing prokaryotic from eukaryotic features is a high-frequency exam skill — expect it to appear in both MCQ and structured questions.
Common Mistakes
- Choosing B (1, 2 and 4 only): some students forget that bacteria have 70S ribosomes or think only eukaryotic cells have ribosomes. Both cell types have ribosomes, but they differ in size.
- Choosing C (1 and 2 only): forgetting that peptidoglycan is a defining component of the bacterial cell wall — and the very thing penicillin attacks.
- Choosing D (4 only): focusing on the mechanism of penicillin (peptidoglycan) and forgetting that "a typical cell that can be killed by penicillin" must also have all the other standard prokaryotic features.
- Confusing 70S with 80S ribosomes (mitochondria and chloroplasts also have 70S ribosomes, but a bacterial cell as a whole is described as having 70S ribosomes).
Things to Be Careful About
- The wording "typical cell that can be killed by penicillin" points specifically to a bacterium, not a mitochondrion or chloroplast (which also have 70S ribosomes and circular DNA but are not cells in their own right and are not the target of penicillin).
- Penicillin only affects growing cells that are actively synthesising peptidoglycan; it does not work on bacteria that lack a cell wall (e.g. Mycoplasma). However, the question says typical, so the standard textbook bacterial features apply.
- Remember the contrasting ribosome sizes: 70S in prokaryotes, 80S in eukaryotic cytoplasm, with 70S in eukaryotic organelles derived from prokaryotes.
Three statements about cholera and its transmission are listed.
1 The pathogen causes watery faeces.
2 Frequent air flight has led to mobile populations.
3 The pathogen is transmitted through water.
Which statements are reasons why outbreaks of cholera are likely to occur?
Options
A 1, 2 and 3
B 1 and 2 only
C 1 and 3 only
D 2 and 3 only
Working
- The pathogen causes watery faeces — Vibrio cholerae produces cholera toxin, causing profuse watery ("rice-water") diarrhoea that massively contaminates water supplies and the environment, fuelling further cases. ✓ outbreak reason
- Frequent air flight has led to mobile populations — international travel lets infected individuals introduce the bacterium into new, susceptible populations far from the original focus. ✓ outbreak reason
- The pathogen is transmitted through water — cholera is a faecal–oral, waterborne disease; contaminated drinking water is the main route of spread, so any break in water sanitation triggers outbreaks. ✓ outbreak reason
All three statements are reasons why outbreaks of cholera are likely to occur.
Answer
A
A
Background Concept
Cholera is an acute diarrhoeal disease caused by the bacterium Vibrio cholerae. Infection is acquired almost exclusively through the faecal–oral route, with contaminated drinking water being the dominant vehicle of transmission. The bacterium colonises the small intestine and secretes cholera toxin (CT), an AB₅ exotoxin whose A subunit enters intestinal epithelial cells and permanently activates the Gs α-subunit, locking adenylate cyclase "on". The resulting sustained rise in intracellular cAMP drives massive secretion of Cl⁻ (and Na⁺ and water) into the gut lumen, producing the characteristic profuse, pale, "rice-water" stools. A single infected individual can lose many litres of fluid per day, rapidly contaminating the local water supply and the environment.
Understanding the Question
The command word is "Which statements are reasons…?" — we are asked to judge each of the three statements as either a genuine reason why cholera outbreaks are likely to occur, or not. The correct response is the option that contains only the valid reasons. The context (cholera and its transmission) tells us to focus on features of the pathogen, the host, and the environment that promote spread.
Approach
For each statement, ask: does this feature of cholera (or its modern context) actually drive outbreaks? A valid reason must either (i) increase the number of infectious particles released into the environment, (ii) increase contact between susceptible hosts and those infectious particles, or (iii) increase the speed at which the pathogen reaches new populations.
Step-by-Step Reasoning
-
Statement 1 — watery faeces: V. cholerae's toxin-driven, voluminous watery diarrhoea floods the environment with huge numbers of bacteria. This is one of the most important drivers of outbreaks because it directly contaminates water sources and hands (faecal–oral spread). Valid reason.
-
Statement 2 — frequent air flight / mobile populations: Modern international travel allows an infected traveller to incubate (and then excrete) the bacterium in a country thousands of kilometres away within hours, introducing V. cholerae into a fresh, non-immune population with local conditions (poor sanitation, lack of clean water) that favour an outbreak. This is exactly how cholera has spread globally in the past (e.g. the 2010s outbreaks in Yemen and Haiti). Valid reason.
-
Statement 3 — transmission through water: Cholera is the textbook waterborne disease. Contaminated drinking water, food washed in such water, and poor hand-washing facilities all enable transmission. Wherever water and sanitation infrastructure fails, outbreaks occur. Valid reason.
All three are correct, so the answer is A (1, 2 and 3).
Key Takeaways
- Cholera is a faecal–oral, waterborne bacterial disease caused by Vibrio cholerae.
- Toxin-driven profuse watery diarrhoea generates the environmental contamination that fuels outbreaks.
- Global travel allows the pathogen to seed outbreaks in distant, susceptible populations.
- Outbreaks arise where a contaminated water source, a susceptible population, and poor sanitation coincide.
Common Mistakes
- Treating "the pathogen is transmitted through water" as too obvious to count — it is precisely the canonical reason cholera outbreaks occur, and must be selected.
- Assuming statement 2 (mobile populations) is a "social" rather than a biological reason — for this question all three are accepted reasons for an outbreak, regardless of category.
- Confusing the symptom (watery diarrhoea) with transmission route (water) and therefore rejecting statement 1.
Things to Be Careful About
- The question is about reasons outbreaks are likely, not about features of the pathogen in general — anything that genuinely promotes spread counts.
- The marking scheme for this paper accepts all three statements, so option A is the only correct choice; do not be tempted by option D, which omits the most fundamental mechanism (the watery faeces contaminating the water supply that then transmits the disease).
What will be produced by the division of memory cells during a secondary immune response?
Options
A macrophages
B plasma cells
C neutrophils
D monocytes
Working
Memory B-lymphocytes generated during the primary response persist in the body after the infection is cleared. On re-exposure to the same antigen, they are rapidly activated and divide, differentiating into plasma cells that secrete large quantities of specific antibody, and into further memory cells.
The other options are wrong because:
- A — macrophages arise from monocytes, not from memory cell division.
- C — neutrophils are granulocytes produced in the bone marrow; they are not the progeny of memory lymphocytes.
- D — monocytes are also bone-marrow-derived leucocytes, unrelated to the clonal expansion of memory cells.
Answer
B
B
Background Concept
The adaptive immune response depends on lymphocytes — B-lymphocytes (which mature in the bone marrow) and T-lymphocytes (which mature in the thymus). Each lymphocyte carries membrane receptors specific to one antigenic epitope. When an antigen is encountered for the first time (the primary response), only the small number of lymphocytes whose receptor matches that antigen are activated. These selected lymphocytes proliferate (clonal expansion) and differentiate into short-lived effector cells and long-lived memory cells.
- B-effector cells are called plasma cells. They are antibody factories, secreting large amounts of the specific immunoglobulin.
- T-effector cells include cytotoxic T-cells (Tc) and helper T-cells (Th), which kill infected cells or coordinate the response.
- Memory cells (both B and T) persist for years, sometimes for life, providing immunological memory.
If the same antigen is encountered again, memory cells respond faster, more strongly and with a higher affinity antibody — the secondary (anamnestic) response. Because the body already holds a clone of antigen-specific memory cells, the lag phase is short and antibody titre rises to a much higher level.
Understanding the Question
The stem asks: when a memory cell divides during a secondary response, what cell type is produced? It is a single-best-answer MCQ testing recall of the fate of activated memory B-lymphocytes.
Approach
Identify the lineage pathway: memory B-cell → division and differentiation → plasma cell (and additional memory cells). Then rule out the other three options, which belong to different cell lineages (monocyte–macrophage and the granulocyte/neutrophil lineages), neither of which arises from lymphocyte clonal expansion.
Step-by-Step Reasoning
- Re-exposure to antigen. On a second encounter, the antigen is processed by antigen-presenting cells and presented to memory T-helper cells, which release cytokines to stimulate the memory B-cells.
- Clonal expansion of memory B-cells. The memory B-cells recognise the antigen via their surface immunoglobulin and proliferate rapidly.
- Differentiation. The proliferating memory B-cells differentiate predominantly into plasma cells — terminally differentiated antibody-secreting cells — and a smaller proportion into further memory B-cells to maintain the long-term clone.
- Eliminating the distractors.
- Macrophages (A) are tissue phagocytes derived from blood monocytes, which originate in the bone marrow. They are not lymphocyte progeny.
- Neutrophils (C) are polymorphonuclear granulocytes, also produced in the bone marrow from a myeloid precursor. They are innate cells with no role in adaptive memory.
- Monocytes (D) are the circulating precursors of macrophages/dendritic cells; like neutrophils, they are myeloid lineage cells, not derived from memory lymphocytes.
- Conclusion. Only plasma cells (B) are produced when memory cells divide during the secondary response.
Key Takeaways
- A secondary response is faster, larger and more specific than a primary response because memory cells are already present.
- Memory B-cells divide to give plasma cells (the antibody secretors) and more memory cells.
- The cell-lineage distinction matters: lymphocytes (B, T, NK) are separate from myeloid cells (monocytes, macrophages, neutrophils, eosinophils, basophils).
Common Mistakes
- Confusing macrophages with cells of the lymphocyte lineage. Macrophages are phagocytes from the monocyte lineage; they do not come from memory cell division.
- Thinking memory cells themselves are the antibody producers. In fact, memory cells are the long-lived "reserve" that, on re-exposure, give rise to the antibody-secreting plasma cells.
- Selecting plasma cells but mis-spelling or describing them as "B-cells producing antibodies" without naming them. CIE mark schemes credit the term plasma cell specifically.
- Confusing memory B-cells with memory T-cells in the question — the principle is the same (both divide to give effectors plus more memory cells) but the effector type differs.
Things to Be Careful About
- The question asks what is produced by the division of memory cells — i.e. the immediate cellular progeny, not the eventual product (antibody) of those progeny.
- "Macrophage" and "monocyte" are not interchangeable; monocytes are the blood-borne precursor, macrophages are the tissue form.
- Read the question as a pure MCQ: the answer is the option that completes the sentence precisely, not the one that is "involved in immunity in some way".
A vaccine is used to give immunity to the virus that causes the disease influenza.
A new influenza vaccine is needed every year because the virus mutates regularly.
What is the reason for needing a new influenza vaccine every year?
Options
A Memory cells become less effective as they age.
B The primary immune response does not produce enough antibodies.
C The secondary immune response does not produce enough antibodies.
D The virus antigens change and are not recognised by the immune system.
Working
Influenza virus surface antigens (haemagglutinin and neuraminidase) change due to mutation (antigenic drift/shift). A vaccine works by stimulating memory B-lymphocytes that recognise specific antigens. When the antigens change, the existing memory cells can no longer bind to the new virus, so a new vaccine containing the updated antigens is needed to generate a fresh primary response and new memory cells.
- A — incorrect: memory cells do not lose effectiveness with age; they persist for years.
- B — incorrect: the primary response is sufficient to generate memory cells; it does produce enough antibodies to clear the infection initially.
- C — incorrect: the secondary response is faster and produces more antibodies than the primary response.
- D — correct: mutations change the viral antigens, so they are no longer recognised by existing memory cells.
Answer
D
D
Background Concept
Vaccines stimulate the immune system to produce memory B-lymphocytes (and T-lymphocytes) against specific antigens on a pathogen. These memory cells persist in the body for years, sometimes for life, allowing a rapid and powerful secondary response if the same pathogen is encountered again. The secondary response is faster, produces more antibodies, and has a higher affinity than the primary response because of class switching and affinity maturation during the initial exposure.
Crucially, both responses depend on the immune system being able to recognise the antigen. Antibodies and memory cells are antigen-specific: a memory cell that recognises one shape of haemagglutinin protein cannot recognise a haemagglutinin with a substantially different shape.
The influenza virus is unusual because it undergoes antigenic variation:
- Antigenic drift — small, gradual mutations in the genes encoding surface antigens (haemagglutinin, HA, and neuraminidase, NA) cause minor changes. These accumulate over time and eventually allow the virus to evade pre-existing immunity.
- Antigenic shift — major, sudden changes that occur when two different strains infect the same cell and reassort their genome segments, producing a novel subtype (e.g. H1N1, H3N2).
Understanding the Question
The stem tells us a vaccine is given for influenza, a new vaccine is required each year, and the reason given is that the virus "mutates regularly". The question asks: why does this mutation mean a new vaccine is needed every year?
The command word is implicit here — the candidate must select the statement that correctly explains the link between viral mutation and the need for annual re-vaccination.
Approach
To answer this, the candidate must connect three ideas:
- Vaccines work by generating memory cells against specific antigens.
- Mutation changes the antigens on the virus.
- If the antigens change, the existing memory cells do not recognise the new virus, so a new vaccine is needed to stimulate a new primary response against the new antigens.
Any option that contradicts one of these ideas is wrong.
Step-by-Step Reasoning
Option A — Memory cells become less effective as they age.
Incorrect. Memory B-lymphocytes are long-lived and can persist for decades (e.g. smallpox vaccination still provides protection for many years). Loss of protection against influenza is not because the memory cells "wear out" but because the virus has changed.
Option B — The primary immune response does not produce enough antibodies.
Incorrect. The primary response does produce enough antibodies to clear the initial infection (otherwise the person would not recover). It is also sufficient to generate memory cells. The problem is not the magnitude of the primary response.
Option C — The secondary immune response does not produce enough antibodies.
Incorrect. The secondary response is, by definition, stronger and faster than the primary response — this is the whole purpose of vaccination. The secondary response is not deficient.
Option D — The virus antigens change and are not recognised by the immune system.
Correct. The memory cells from a previous infection or vaccination recognise only the old antigens. When mutation alters the shape of the surface antigens (especially the HA protein), antibodies and memory cell receptors can no longer bind effectively. The immune system effectively "sees" the new strain as a novel pathogen, requiring a new primary response — and therefore a new vaccine.
Key Takeaways
- Vaccines generate antigen-specific memory cells; they protect only against pathogens bearing those antigens.
- Antigenic variation in influenza (drift and shift) means that antigen-specific immunity is short-lived in terms of cross-strain protection.
- A "new" vaccine each year is not because memory cells age — it is because the target antigens have changed.
Common Mistakes
- Confusing the cause: students often choose options about "memory cells failing" or "insufficient antibodies" without recognising that the real problem is antigenic change.
- Thinking the primary response is "weak": the primary response is sufficient to clear infection and produce memory; the issue is specificity, not magnitude.
- Forgetting specificity: the immune system is antigen-specific. A new virus strain with altered antigens is, to the immune system, essentially a new pathogen.
Things to Be Careful About
- Distinguish antigenic drift (small mutations, gradual change, responsible for seasonal flu) from antigenic shift (major reassortment, can cause pandemics).
- Remember that antibodies and memory cells recognise shape, not the pathogen itself — so any change in antigen shape reduces recognition.
- The question stem explicitly states the virus "mutates regularly" — this is a strong hint that the answer involves antigens changing, ruling out options about memory cell quality or antibody quantity.
Your score so far
Answer a question to start scoring
Your marks add up here as you work through the paper.