Biology 9700/34 — May/June 2024
Cambridge AS Level · Advanced Practical Skills · worked solutions for every part, with the mark scheme
Topics Manipulation, Measurement and Observation · Presentation of Data and Observations · Analysis, Conclusions and Evaluation · Use of the Light Microscope
Salicylic acid acts as a painkiller and is the active ingredient in aspirin.
When a person ingests a dose of aspirin, the salicylic acid enters the blood and circulates in the bloodstream. Most of the salicylic acid is metabolised by the body. Some of the salicylic acid is excreted by the kidneys into the urine.
You will estimate the concentration of salicylic acid in two solutions, S1 and S2. These solutions represent samples of blood and urine taken from a person who has ingested aspirin.
Note: you will not be working with real blood or real urine.
You are provided with the materials shown in Table 1.1.
Table 1.1
| labelled | contents | hazard | volume / |
|---|---|---|---|
| A | 1.0% salicylic acid | harmful | 50 |
| C | iron(III) chloride solution | harmful | 30 |
| S1 | sample with unknown concentration of salicylic acid | harmful | 20 |
| S2 | sample with unknown concentration of salicylic acid | harmful | 20 |
| W | distilled water | none | 50 |
If any solution comes into contact with your skin, wash off immediately with cold water.
It is recommended that you wear suitable eye protection.
The concentration of salicylic acid can be determined by using iron(III) chloride, C, which forms a purple solution when mixed with salicylic acid. The greater the concentration of salicylic acid, the more intense the purple colour formed.
You will need to:
- prepare different concentrations of salicylic acid
- record the intensity of purple colour for each concentration
- estimate the concentration of salicylic acid in S1 and S2.
You will use proportional dilution to make different concentrations of salicylic acid.
You will prepare of each concentration, using A and W.
Table 1.2 shows how to prepare two of the concentrations you will use.
Decide which other concentrations of salicylic acid you will use.
Complete Table 1.2 to show how you will prepare the concentrations of salicylic acid you will use.
Table 1.2
| percentage concentration of salicylic acid | volume of A / | volume of W / |
|---|---|---|
| 1.0 | 10.0 | 0.0 |
| 0.0 | 0.0 | 10.0 |
Answer
| percentage concentration of salicylic acid | volume of A / | volume of W / |
|---|---|---|
| 1.0 | 10.0 | 0.0 |
| 0.8 | 8.0 | 2.0 |
| 0.6 | 6.0 | 4.0 |
| 0.4 | 4.0 | 6.0 |
| 0.2 | 2.0 | 8.0 |
| 0.0 | 0.0 | 10.0 |
See working
Background Concept
Proportional (serial) dilution is the standard way of producing a calibration series when you want to compare an unknown against a known range. The concentrated stock A (1.0% salicylic acid) is mixed with distilled water W so that the concentration falls in known steps while the total volume of every tube is held constant. Because the concentration falls in proportion to the fraction of stock used, a tube made from 8.0 cm³ of A + 2.0 cm³ of W gives salicylic acid. This is a special case of the dilution equation , where is the stock concentration, is the volume of stock, is the desired concentration and is the total volume.
Understanding the Question
You are told to prepare of each concentration using only A and W. The top row (1.0%) and the bottom row (0.0%) are already filled in; you must insert at least three intermediate rows. The marks require (1) at least three further concentrations, (2) correct volumes of A for each, and (3) every row to sum to .
Approach
Pick a sensible, evenly spaced range that brackets the unknown samples S1 and S2. Because both unknowns are described as samples from a person who has taken aspirin, their concentrations will lie somewhere between 0% and 1%. An evenly spaced 0.2% interval gives a clean series: 0.8, 0.6, 0.4, 0.2% (plus the 0% and 1% already present). For each concentration, the volume of A is the desired percentage as a fraction of (e.g. ), and the volume of W makes up the rest.
Step-by-Step Reasoning
- For 0.8%: , so .
- For 0.6%: , so .
- For 0.4%: , so .
- For 0.2%: , so .
Each row sums to , the volumes are at sensible precision, and the 0.0% control (10.0 cm³ W + 0.0 cm³ A) is preserved at the bottom of the table.
Key Takeaways
A standard dilution series always: keeps total volume constant; spans the expected range of unknowns; includes a 0% control; and uses evenly spaced intervals so that interpolation is straightforward.
Common Mistakes
- Forgetting the 0% control at the bottom, or omitting the original 1.0% stock.
- Volumes not summing to (e.g. writing 6.0 cm³ A and 2.0 cm³ W).
- Choosing concentrations that bunch together (e.g. 0.9, 0.8, 0.7, 0.6%), which makes the calibration too crowded at one end of the range.
- Using awkward intervals such that you cannot match the unknown samples by interpolation.
Things to Be Careful About
- Always quote volumes to one decimal place (consistent with the volumes on the printed row).
- Make sure the volumes physically fit in the apparatus you are using.
- The 0% control is essential; without it you cannot tell whether the iron(III) chloride solution itself contributes any purple colour.
Carry out step 1 to step 7.
step 1 In the beakers provided, prepare the concentrations of salicylic acid, as shown in Table 1.2.
step 2 Label the test-tubes with the concentrations of salicylic acid prepared in step 1.
step 3 Put of C into each of the test-tubes labelled in step 2.
step 4 Put of A into the test-tube labelled 1.0%. Use a glass rod to mix.
step 5 Repeat step 4 for each of the other concentrations you prepared in step 1.
step 6 Place the white card behind the test-tubes and observe the intensity of colour in each test-tube. You may see the same intensity in more than one test-tube.
step 7 Compare the intensity of colour in each test-tube with the key in Fig. 1.1. Record your observations in (a)(ii) using only the symbols shown in the key in Fig. 1.1.
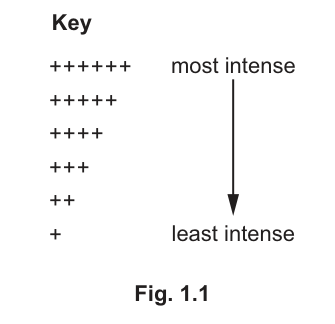
Fig. 1.1
Record your results in an appropriate table.
Answer
| percentage concentration of salicylic acid | intensity (of colour) |
|---|---|
| 1.0 | ++++++ |
| 0.8 | +++++ |
| 0.6 | ++++ |
| 0.4 | +++ |
| 0.2 | ++ |
| 0.0 | + |
(The exact symbols depend on the candidate's own observations; the table above shows the expected trend — the higher the concentration, the more intense the purple colour. The actual intensities recorded must follow the symbol key in Fig. 1.1.)
See working (intensity symbols depend on the candidate's own observations)
Background Concept
When the dependent variable is qualitative (a colour, not a number), you record it using a defined symbol key so that another reader can interpret your results. In this investigation iron(III) chloride, C, forms a purple complex with salicylic acid; the intensity of the purple is proportional to the concentration. A six-symbol scale (++++++, +++++, ++++, +++, ++, +) lets you assign a single symbol per tube and, later, interpolate the concentration of an unknown by visual matching.
Understanding the Question
After running step 1–7 of the procedure, you have six test-tubes (one for each concentration in Table 1.2), each containing of C plus of the appropriate dilution. You must record the intensity of purple in each tube using only the symbols given in the key in Fig. 1.1. The marks reward (1) a correct independent-variable heading, (2) a correct dependent-variable heading, (3) a result for every concentration, and (4) the correct trend.
Approach
Draw a two-column table. The first column is the independent variable — the percentage concentration of salicylic acid — exactly as in Table 1.2. The second column is the dependent variable — intensity (of colour). Working in order from highest to lowest concentration (or vice versa), assign the symbol from the key that best matches each tube. Hold the tubes side by side against the white card (as in step 6) so the eye can scan across them and rank them by eye.
Step-by-Step Reasoning
- Read each tube against the white card with the key to one side; the eye naturally ranks the tubes from most to least intense.
- The 1.0% tube should match ++++++ (most intense), the 0.0% tube should match + (least intense), and the intermediate tubes should fall between them in the order 0.8 > 0.6 > 0.4 > 0.2.
- Two adjacent tubes may legitimately share a symbol — the mark scheme explicitly says "you may see the same intensity in more than one test-tube".
- The recorded symbols must come from the key only; do not invent new descriptors ("dark purple", "very dark") which would not be credited.
Key Takeaways
For a qualitative dependent variable: define a symbol key in advance; record using those symbols only; and check that the trend you have recorded is biologically sensible.
Common Mistakes
- Using a heading such as "colour" or "purple" rather than "intensity (of colour)".
- Inventing symbols or descriptors outside the key (e.g. "dark", "very dark", "+++ ½").
- Recording the trend backwards (e.g. saying 1.0% is + and 0.0% is ++++++) because the tubes were inspected in the wrong order.
- Putting the dependent variable as the row headings and the independent variable down the side; this is unconventional for a calibration series.
Things to Be Careful About
- Both column headings must be present; the independent variable ("percentage concentration of salicylic acid") and the dependent variable ("intensity (of colour)") each earn their own mark.
- The same symbol may appear in more than one row — this is expected when the human eye cannot resolve adjacent intensities, and it does not lose marks.
- The 0.0% control should never be assigned ++++++; it should be + (or + at most). If your 0.0% tube looks intense, you have probably contaminated it with stock.
Carry out step 8 to step 12.
step 8 Label one test-tube S1 and label another test-tube S2.
step 9 Put of C into each of the test-tubes labelled in step 8.
step 10 Put of S1 into the appropriately labelled test-tube. Use a glass rod to mix.
step 11 Put of S2 into the appropriately labelled test-tube. Use a glass rod to mix.
step 12 Observe the intensity of colour in each test-tube.
Record your observations for S1 and S2 using the symbols shown in the key in Fig. 1.1.
intensity of colour for S1 ______
intensity of colour for S2 ______
Answer
intensity of colour for S1 = (symbol from the key that matches the candidate's own observation)
intensity of colour for S2 = (symbol from the key that matches the candidate's own observation)
(The candidate must use only the symbols + , ++ , +++ , ++++ , +++++ , ++++++ from the key in Fig. 1.1. A representative pair might be: S1 = ++, S2 = ++++, but the marks depend on the candidate's own observations.)
Student-dependent (symbols from Fig. 1.1)
Background Concept
The symbol key in Fig. 1.1 is a coarse ranking scale, so two tubes that differ slightly in real intensity may legitimately be given the same symbol. What matters is that you commit to one of the six symbols for each tube and that the comparison is made under identical lighting, with the white card behind.
Understanding the Question
Steps 8–12 ask you to repeat the colour test on the unknown samples S1 and S2 (the simulated blood and urine) and record the intensity in the same symbol notation. This is the data you will use in (a)(iv) to estimate the concentration of each unknown.
Approach
Stand the S1 tube next to the calibration series and find the calibration tube (or tubes) whose purple intensity matches it most closely; record that symbol. Repeat for S2. Use the same lighting, the same white card, and a quick glance so that your eye does not adapt and distort the comparison.
Step-by-Step Reasoning
- The mark is awarded for using the symbol notation correctly, not for any particular pair of symbols.
- The candidate's pair is internally consistent with their (a)(ii) table — if S1 looked the same as the 0.4% tube, then S1 gets the same symbol as 0.4%.
- A typical representative pair might place S1 in the middle of the series (e.g. ++ or +++) and S2 above it (e.g. ++++), reflecting the biological expectation that urine contains a higher concentration than blood (see (a)(v)).
Key Takeaways
Always record unknowns using exactly the same notation as the calibration series so that direct matching is possible in the next step.
Common Mistakes
- Writing the intensity in words ("light purple", "dark") rather than as a key symbol.
- Inventing intermediate symbols (e.g. +++½, + ½) that are not in the key.
- Comparing the unknowns under different lighting from the calibration tubes.
Things to Be Careful About
- The mark is for the use of the symbols, not for a particular value — but the symbols you choose here dictate the concentrations you give in (a)(iv), so they must agree.
Use your results in (a)(ii) and (a)(iii) to estimate the concentration of salicylic acid in S1 and S2.
concentration in S1 = ______
concentration in S2 = ______
Answer
concentration in S1 = (the percentage concentration whose tube matches the symbol assigned to S1 in (a)(iii))
concentration in S2 = (the percentage concentration whose tube matches the symbol assigned to S2 in (a)(iii))
(Representative example, consistent with the sample table in (a)(ii) and a typical pair in (a)(iii): S1 ≈ 0.2%, S2 ≈ 0.4%. The actual values are awarded by ecf from the candidate's own results.)
Student-dependent (read off from the candidate's own calibration series)
Background Concept
A calibration series lets you estimate the concentration of a sample by visual interpolation: you match the colour of the unknown against the closest tube in the series. If the unknown lies between two calibration points, the convention is to take the lower of the two (or to record the bracket — e.g. "between 0.2% and 0.4%"), because the colour test cannot resolve smaller differences.
Understanding the Question
Using the symbols recorded in (a)(ii) for the calibration and the symbols recorded in (a)(iii) for S1 and S2, write down the concentration (as a percentage) of each unknown. The mark is awarded by error carried forward (ecf) from the candidate's own results, so any consistent pair of numbers is acceptable.
Approach
For each unknown, find the row(s) in (a)(ii) whose intensity symbol is the same as the symbol you gave the unknown in (a)(iii). If there is a unique match, quote that percentage. If there are two (because your series gave the same symbol to two adjacent tubes), quote the lower percentage, or write "between … and …".
Step-by-Step Reasoning
- Example: if 0.4% tube = ++++ and 0.6% tube = ++++ in your (a)(ii) table, and S2 = ++++, then S2 is somewhere in the range 0.4%–0.6%. In a representative answer one might give 0.4% or 0.5%.
- The two concentrations should be different if S1 and S2 were given different symbols; if they were given the same symbol they should be quoted as the same percentage.
- Always use the units (%) that the question asks for.
Key Takeaways
Colorimetric estimation is only as accurate as the resolution of the symbol key; for higher accuracy one would use a colorimeter and a calibration curve of absorbance vs concentration.
Common Mistakes
- Inventing a precise-looking value (e.g. 0.37%) when the key only allows discrimination at the 0.2% level.
- Quoting a concentration that does not appear in Table 1.2 and is not consistent with the symbols chosen in (a)(iii).
- Forgetting the % unit.
Things to Be Careful About
- This mark is awarded by ecf from your own (a)(ii) and (a)(iii) — so a coherent set of answers scores even if the actual concentrations differ from those of another candidate.
- If you gave S1 and S2 the same symbol in (a)(iii), they should receive the same percentage here.
When a person ingests a dose of aspirin, some of the salicylic acid is excreted by the kidneys into the urine.
State which sample, S1 or S2, is from the person’s blood. Explain your answer.
sample ______
explanation
Answer
sample = S1
explanation = Most of the salicylic acid ingested is metabolised by the body, so only a small amount remains in the blood; the rest is excreted by the kidneys into the urine, which becomes more concentrated. S1 has the lower concentration, so S1 must be the blood sample and S2 the urine sample.
S1 is from the blood.
Background Concept
After a dose of aspirin, salicylic acid is absorbed into the blood and is then removed from the body by two routes: metabolism (mostly by liver enzymes, which break it down into other compounds) and excretion (filtered by the kidneys into the urine). The question tells us explicitly that most of the dose is metabolised and only some is excreted. The kidneys concentrate the filtrate as they reabsorb water, so the salicylic acid that does reach the urine is in a smaller volume than the blood plasma from which it was filtered, and is therefore at a higher concentration.
Understanding the Question
You have two unknowns — S1 and S2 — and you have just estimated their concentrations in (a)(iv). One is blood, one is urine. The question asks you to identify the blood sample and to justify your answer using the statements in the stem about metabolism and excretion.
Approach
Compare the two concentrations you obtained in (a)(iv). The sample with the lower concentration is the blood, because metabolism has removed most of the salicylic acid before it can be excreted. The sample with the higher concentration is the urine, because the kidneys concentrate the excreted fraction.
Step-by-Step Reasoning
- In the representative run, S1 ≈ 0.2% and S2 ≈ 0.4%, so S1 < S2.
- The stem tells us most of the dose is metabolised in the body — that is, in the blood (and liver) — leaving only a fraction to be excreted.
- Therefore the sample with the lower concentration (S1) is the blood, and the more concentrated sample (S2) is the urine.
- The explanation must include a reference to metabolism or excretion; simply saying "S1 is blood" without justification does not earn the mark.
Key Takeaways
A practical result only becomes meaningful when you can link it to the underlying biology. Here, the link is pharmacokinetics: metabolism removes most of the dose, so blood retains less than the concentrated urine.
Common Mistakes
- Stating a sample without any justification ("S1 is blood because") — the mark requires a statement about metabolism or excretion.
- Choosing the wrong sample because the candidate forgot which tube was lower in concentration.
- Confusing "metabolised" with "excreted" — these are two separate removal routes.
Things to Be Careful About
- The mark is awarded by ecf from your (a)(iv) result, so your chosen sample must match the sample you said had the lower (or higher) concentration.
- Always reference the biological reasoning, not just the data.
Answer
Independent variable = (percentage) concentration of salicylic acid.
Concentration of salicylic acid.
Background Concept
Every experiment has at least one variable that is deliberately changed (the independent variable), at least one that is measured to see the effect (the dependent variable), and a set of others that are kept the same (the controlled variables). The independent variable goes on the x-axis (or in the left-hand column of a results table), and the dependent variable goes on the y-axis (or in the right-hand column).
Understanding the Question
The investigation deliberately prepares tubes with different concentrations of salicylic acid (0.0%, 0.2%, 0.4%, 0.6%, 0.8%, 1.0%) and measures what happens when iron(III) chloride is added. State which variable is the one that is being deliberately changed.
Approach
The variable that is varied on purpose is the percentage concentration of salicylic acid. The dependent variable (the one measured) is the intensity of the purple colour formed. The controlled variables include the volume of iron(III) chloride (), the volume of salicylic-acid solution (), the temperature and the timing.
Step-by-Step Reasoning
- Step 1 of the procedure prepares several concentrations of salicylic acid — this is the independent variable.
- Step 7 records the intensity of colour — this is the dependent variable.
- The independent variable is therefore the (percentage) concentration of salicylic acid.
Key Takeaways
"Independent" = what I change; "dependent" = what depends on it.
Common Mistakes
- Writing "colour intensity" or "amount of purple" — these are the dependent variable, not the independent.
- Writing "volume of iron(III) chloride" — this is a controlled variable, not the independent.
- Writing "salicylic acid" without specifying "concentration of".
Things to Be Careful About
- The answer must be the variable being varied (the concentration), not the substance (salicylic acid) or the procedure (mixing).
Describe one significant source of error when carrying out step 6 and step 7 and suggest an improvement to reduce this error.
source of error ______
improvement ______
Answer
source of error = judging the intensity of the purple colour by eye is subjective.
improvement = use a colorimeter to measure the absorbance (or transmittance) of each tube quantitatively.
Subjective judgement of colour intensity — improved by using a colorimeter.
Background Concept
A source of error is anything that introduces uncertainty into a measurement that is not present in the idealised procedure. A source of error is significant when it is large enough to affect the result. An improvement is a change to the procedure that reduces that source of error. Improvements must be paired with their specific source of error — they earn their mark together.
Understanding the Question
Steps 6 and 7 of the procedure ask you to look at the test-tubes against a white card and assign each one a symbol from the key in Fig. 1.1. This is a visual judgement that varies from person to person, and even for the same person under different lighting. State one significant source of error in this judgement and one improvement.
Approach
The judgement is subjective, so the natural source of error is the subjectivity of the eye. The natural improvement is to replace the eye with an instrument that measures absorbance, i.e. a colorimeter. Together these earn both marks.
Step-by-Step Reasoning
- Source of error: different observers (or the same observer under different lighting) would assign different symbols to the same tube, because colour intensity is being judged qualitatively.
- Improvement: a colorimeter passes light of a fixed wavelength through the tube and measures the absorbance, giving a numerical value that does not depend on the observer.
- Both must be present to earn the two marks — a source without an improvement, or a vague improvement ("be more careful"), does not score.
Key Takeaways
A well-designed improvement targets the specific source of error. "Be more careful" and "repeat more times" do not remove subjectivity; only an instrumental measurement does.
Common Mistakes
- Vague source of error ("human error", "it is not very accurate") — the mark scheme requires the word "subjective" or equivalent.
- Vague improvement ("use better equipment" without naming the colorimeter).
- Mismatched pairs (e.g. "small sample size" with "use a colorimeter").
- Listing a source of error that does not apply to steps 6–7 (e.g. "the concentrations might not be accurate") — that would be a source of error in step 1, not in steps 6–7.
Things to Be Careful About
- The source of error must be specific to the colour-matching steps; do not write about general issues with the dilution series.
- The improvement must address the source directly; "use a colorimeter" addresses the subjectivity, "repeat with more observers" does not.
A person was given an oral dose of aspirin and the concentration of salicylic acid in their urine was measured at intervals over a period of four hours.
The results are shown in Table 1.3.
Table 1.3
| time / minutes | concentration of salicylic acid in urine / |
|---|---|
| 30 | 36.0 |
| 60 | 65.5 |
| 120 | 42.5 |
| 180 | 33.0 |
| 240 | 31.5 |
Plot a graph of the data in Table 1.3 on the grid in Fig. 1.2.
Use a sharp pencil.
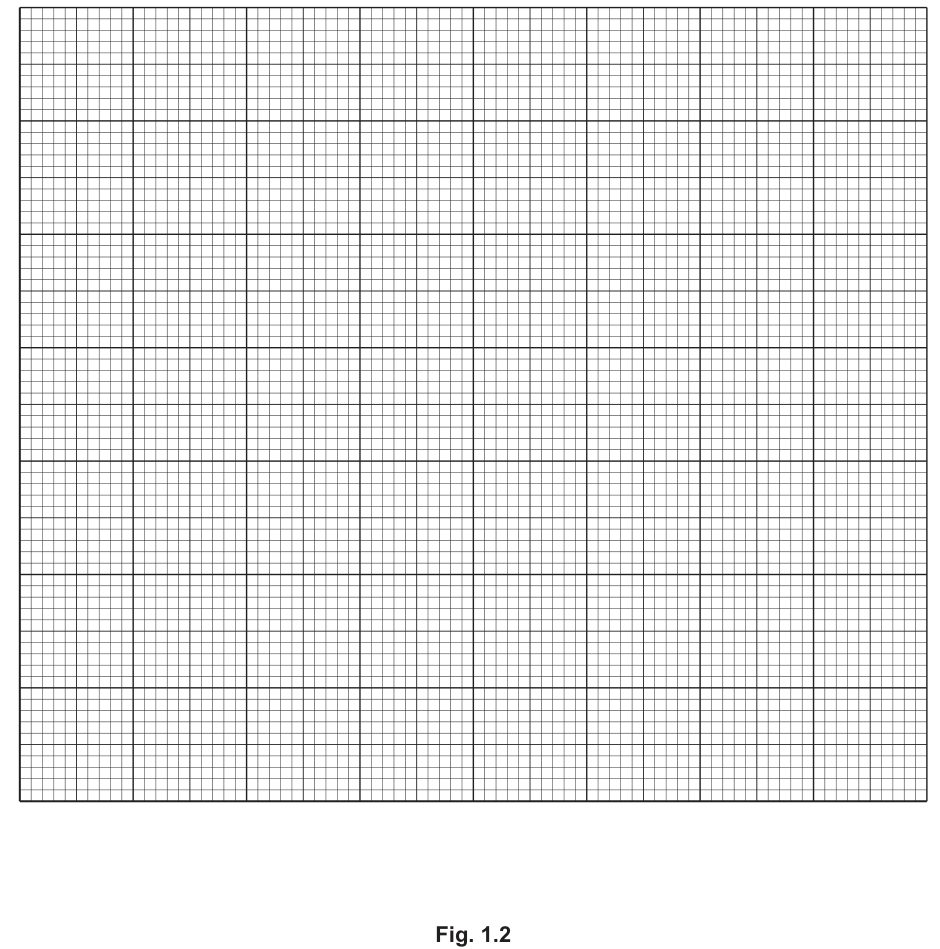
Fig. 1.2
Answer
Plot the data from Table 1.3 on the grid in Fig. 1.2 using the conventions below.
| convention | detail |
|---|---|
| x-axis label | time / minutes |
| x-axis scale | to ; labelled at least every (e.g. 0, 30, 60, 90, 120, 150, 180, 210, 240) |
| y-axis label | concentration of salicylic acid in urine / |
| y-axis scale | to ; labelled at least every (e.g. 0, 10, 20, 30, 40, 50, 60, 70) |
| points | small, sharp crosses (or dots in circles) at (30, 36.0), (60, 65.5), (120, 42.5), (180, 33.0), (240, 31.5) |
| line | thin line, smooth curve or point-to-point, passing through (or close to) every point |
See working — five points joined by a thin line on correctly labelled axes.
Background Concept
A line graph is the right choice when both variables are continuous (time and concentration) and you want to show how one changes as the other changes. The CIE conventions for a paper-3 line graph are strict and each convention earns its own mark:
- Each axis is labelled with the quantity and its unit.
- Each scale is linear, uses at least half the grid in both directions, and is labelled at regular (here, every ) intervals.
- Each point is plotted with a small, sharp cross or a dot in a circle (so that the position is unambiguous) — a fat dot that covers a whole small square is not acceptable.
- The points are joined either point-to-point with straight line segments or with a single smooth curve that passes through (or close to) every point. A best-fit straight line through non-linear data loses marks.
Understanding the Question
You are given five (time, concentration) pairs in Table 1.3 and a blank grid in Fig. 1.2. You must plot them so that the next part of the question (a reading at 105 min) can be done by interpolation, not extrapolation. The marks reward each of the four conventions above.
Approach
- Decide which variable goes on which axis: time on x (the variable the experimenter controls / measures first), concentration on y (the variable that responds).
- Choose scales: the data span 30–240 min on x and 31.5–65.5 on y. per fills the x-axis nicely; per fills the y-axis comfortably to 70.
- Plot each of the five pairs as a sharp cross.
- Join with a smooth curve that rises steeply between 30 and 60 min, peaks at 60 min, then falls back towards a plateau around 30–35 by 180–240 min.
Step-by-Step Reasoning
- The x-axis spans 0 to 270 min at per ; major grid lines fall every , which matches the data spacing.
- The y-axis spans 0 to at per , comfortably covering the maximum value of 65.5 with room to spare.
- The five plotted points are (30, 36.0), (60, 65.5), (120, 42.5), (180, 33.0), (240, 31.5).
- The curve should pass through (or very close to) every plotted point and be drawn with a single thin line — not a series of fat dots or ruler-thick strokes.
Key Takeaways
A good paper-3 line graph has: correct axes with units; scales that fill the grid; sharp, accurately placed crosses; and a single smooth curve. Each is a separate mark.
Common Mistakes
- Swapping the axes (concentration on x, time on y).
- Using awkward scales (e.g. per , or per ) that compress the data into a corner.
- Plotting with fat dots or large crosses that obscure the position of the point.
- Drawing a best-fit straight line through clearly non-linear points.
- Drawing a histogram (bars) instead of a line graph.
Things to Be Careful About
- Use a sharp pencil and a ruler for the axes.
- Mark the intersection of the gridlines with a small, neat cross — one stroke horizontal, one vertical, both visible but not larger than a single small square.
- The curve should not be drawn as a series of separate zig-zags; it should be one continuous, thin, smooth line.
Use your graph in Fig. 1.2 to estimate the concentration of salicylic acid in the urine at 105 minutes.
Show on your graph how you obtained your answer.
concentration of salicylic acid = ______
Working
- Draw a vertical construction line from on the x-axis up to the curve.
- From that intersection, draw a horizontal construction line across to the y-axis.
- Read off the y-axis value where the horizontal line meets it.
(For a curve that rises to a peak at and falls through , linear interpolation between 60 and 120 min gives ; a smooth curve through the points typically gives a reading in the range .)
Answer
concentration of salicylic acid (representative value; ecf from the candidate's own graph).
≈ 48 μg mL⁻¹ (representative; ecf from own graph)
Background Concept
To read a value that lies between two plotted points, draw construction lines: a vertical line from the desired x-value up to the curve, and a horizontal line from that point across to the y-axis. The y-value where the horizontal line meets the axis is the interpolated concentration. This is interpolation (within the data range) and is much more reliable than extrapolation (outside the data range).
Understanding the Question
The data in Table 1.3 are at 30, 60, 120, 180 and 240 min. The question asks for the concentration at 105 min, which is between two data points (60 and 120 min). You must show the construction lines on the graph and read off the value.
Approach
- Step 1: locate 105 min on the x-axis (just past the major gridline at 90 and three small squares further on, if your scale is per = per small square).
- Step 2: draw a vertical line from 105 up to where it meets the curve.
- Step 3: from that intersection, draw a horizontal line across to the y-axis.
- Step 4: read the y-axis value where the horizontal line meets it.
Step-by-Step Reasoning
- 105 min lies between the data at 60 min () and 120 min (), on the descending limb of the curve.
- Linear interpolation: the fraction of the way from 60 to 120 is , so the value is
- A smooth curve drawn through the points will give a slightly different reading (because the curve is concave in that region), but typically in the range .
- Always quote the unit ().
Key Takeaways
Interpolation between two data points: construction lines on the graph, then read off the y-axis. Extrapolation (reading outside the data range) is unreliable and is not acceptable here.
Common Mistakes
- Reading off the y-axis at 105 min as if it were a data point (i.e. guessing without drawing the construction lines).
- Forgetting to show the construction lines on the graph — the first mark is specifically for showing the intercept.
- Reading a value extrapolated beyond 240 min or before 30 min.
- Quoting a value without units.
Things to Be Careful About
- Both marks are needed: one for the visible construction lines on the graph, one for the correct numerical answer.
- The numerical answer is awarded by ecf from the candidate's own curve — so a coherent value that lies between and scores.
The highest concentration of salicylic acid in the urine is detected at 60 minutes.
Using the data in Table 1.3 and your graph in Fig. 1.2, describe the change in concentration of salicylic acid between 60 minutes and 240 minutes.
Answer
The concentration of salicylic acid in the urine decreases (overall) from at to at .
Concentration decreases from 65.5 μg mL⁻¹ to 31.5 μg mL⁻¹ between 60 and 240 minutes.
Background Concept
A trend description should state the direction of change (increases, decreases, stays the same), and where possible support it with specific numerical values from the data. Vague phrasing ("it goes down a bit") scores nothing; precise phrasing ("decreases from X to Y") earns the mark.
Understanding the Question
You are asked to describe what is happening to the urinary salicylic acid concentration between 60 min (the time of the peak) and 240 min (the last reading), using the data in Table 1.3 and the graph you have just drawn.
Approach
Look at the relevant slice of the table / curve: 60, 120, 180, 240 min. The values are 65.5, 42.5, 33.0, 31.5 . The overall direction is downward. Quote the start and end values to support the description.
Step-by-Step Reasoning
- At 60 min, the concentration is at its peak of .
- At 120 min it has fallen to (a sharp drop).
- At 180 min it has fallen further to .
- At 240 min it is — close to a plateau.
- So the overall trend between 60 and 240 min is a decrease, with most of the fall happening in the first hour after the peak and a near-plateau by the end.
Key Takeaways
A trend description needs a direction word and numerical evidence. Always quote the values at the start and end of the interval you are describing.
Common Mistakes
- Saying only "it decreases" without quoting any numbers — the mark scheme requires both and to be referenced.
- Quoting the values but saying "increases" because the candidate looked at the wrong slice of the curve.
- Saying "it returns to normal" or other vague biology without anchoring to the data.
Things to Be Careful About
- The question specifies the interval 60–240 min; do not include the rising phase (0–60 min).
- "Decreases" is the direction; the values 65.5 and 31.5 are the supporting evidence. Both are needed.
Aspirin is also taken to reduce inflammation and blood clotting. Inflammation and blood clotting involve enzyme-controlled reactions.
Suggest how aspirin reduces these enzyme-controlled reactions.
Answer
Any two from:
- Aspirin acts as an enzyme inhibitor.
- Aspirin changes the shape of the active site of the enzyme.
- As a result, fewer enzyme–substrate complexes form, so the rate of the reaction is reduced.
Aspirin is an inhibitor; it changes the shape of the active site, so fewer enzyme–substrate complexes form.
Background Concept
Enzyme-controlled reactions proceed when the substrate binds to the enzyme's active site to form an enzyme–substrate complex (ESC). Anything that prevents that complex from forming — or that prevents it from breaking down into products — will reduce the rate of the reaction. Inhibitors do exactly this. A competitive inhibitor mimics the substrate and occupies the active site; a non-competitive inhibitor binds elsewhere and changes the shape of the active site so that the substrate can no longer bind. Aspirin is believed to act by acetylation of an active-site residue, irreversibly blocking the active site.
Understanding the Question
Inflammation and blood clotting both involve enzyme-controlled reactions (e.g. cyclo-oxygenase in inflammation, thromboxane synthase in clotting). The question asks you to suggest how aspirin reduces these reactions.
Approach
Apply the standard "inhibitor" reasoning: state that aspirin is an inhibitor, state what it changes (the shape of the active site), and state the consequence (fewer enzyme–substrate complexes form, so the reaction is slower).
Step-by-Step Reasoning
- The mark scheme accepts any two of three points: (1) aspirin is an inhibitor; (2) it changes the shape of the active site; (3) fewer enzyme–substrate complexes form.
- "Aspirin denatures the enzyme" is incorrect — denaturation is irreversible destruction of tertiary structure by heat or pH, not the specific, localised change produced by an inhibitor at body temperature. Do not use that word.
- "Aspirin blocks the active site" is an acceptable alternative way of stating point (2).
- "Aspirin is competitive / non-competitive" is not required — the question only asks for the mechanism at the level of "how does it reduce the reaction".
Key Takeaways
A clean inhibitor explanation has three parts: identity (inhibitor), action (alters the active site so the substrate cannot bind), consequence (fewer ESCs form, so the rate falls). Memorise this three-part structure — it scores in any inhibitor question on the paper.
Common Mistakes
- Saying aspirin "kills the enzyme" or "denatures the enzyme" — both are wrong for a reversible or covalent-site inhibitor.
- Saying aspirin "is a poison" — vague and not the right biology.
- Only stating one of the three points and not reaching the second mark.
- Confusing inhibitor action with that of an allosteric regulator.
Things to Be Careful About
- "Inhibitor" is the technical term — use it, not "blocker" or "stopper".
- The mechanism is about the active site specifically, not the whole enzyme.
- "Fewer enzyme–substrate complexes form" is the precise consequence; "the reaction slows down" is a downstream effect, not the mechanism itself, but is also credit-worthy in many mark schemes.
M1 is a slide of a stained transverse section through a plant structure made up of leaves wrapped around a central area.
Observe the region of the section on M1 indicated by the shaded area in Fig. 2.1.
- Draw a large plan diagram of this region. Use a sharp pencil.
- Include four vascular bundles in your drawing.
- Use one ruled label line and label to identify one vascular bundle.
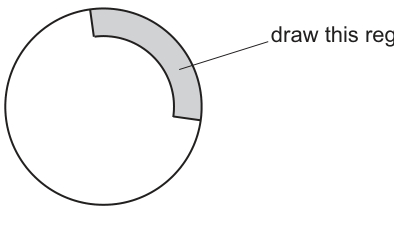
Fig. 2.1
Answer
Draw a large plan diagram of the shaded sector shown in Fig. 2.1, using a sharp pencil and obeying these conventions:
- Use most of the available space; do not shade any region.
- Draw only the tissues present in the shaded sector; no individual cells are to be drawn.
- Include at least four whole vascular bundles, in the correct relative positions seen on M1.
- Draw each epidermis (outer surface of the section) as two clear parallel lines.
- Add one ruled label line and label to identify one vascular bundle.
Plan diagram of the shaded sector with four vascular bundles, double-line epidermis and one labelled vascular bundle.
Background Concept
A plan diagram is a low-power, two-dimensional map of a tissue section. It shows the distribution of tissues (epidermis, ground tissue, vascular bundles, any sclerenchyma/caps, pith) without drawing any individual cells. Conventions reward correct proportions, clean lines and accurate tissue boundaries. Plant organs such as roots, stems, leaves and bulb scales each have characteristic arrangements that a plan diagram reveals at a glance.
The plant on slide M1 is described as "leaves wrapped around a central area" — this is consistent with a bulb (e.g. an onion bulb), where modified leaves (scale leaves) surround a central bud. A transverse section therefore shows concentric arcs of leaf tissue, each with its own upper and lower epidermis bounding a band of mesophyll that contains scattered vascular bundles.
Understanding the Question
You are given M1 (the actual slide — a stained TS through the bulb structure) and Fig. 2.1, which marks out the shaded sector you must draw. The mark scheme expects you to render a large, tidy, conventional plan diagram of just that sector: a curved "slice" with the outer (upper) epidermis as the convex arc and the inner (lower) epidermis as the concave arc. Four vascular bundles must appear, and one must carry a labelled line.
Approach
First, orient the slide so the shaded sector sits centrally on the stage. Use the lowest-power objective that still resolves the vascular bundles. Trace the boundaries you see, ignoring cell-level detail. Decide on a suitable magnification so the drawing fills most of the box but the vascular bundles fit comfortably. Plan the position of the label line before drawing so it does not cross other structures.
Step-by-Step Reasoning
- Most of the available space, no shading: Use a ruler to set a margin, then draw so the diagram occupies the bulk of the answer space. Shading is forbidden on a plan diagram — only lines are allowed.
- Only the shaded region, no cells: Do not extend into the unshaded remainder of Fig. 2.1. Do not draw cell walls or contents; the marks are for tissue boundaries, not for cytology.
- Four whole vascular bundles: Inspect the sector on M1 and place each bundle as a small closed outline in roughly the correct position. The bundles of a bulb-scale leaf typically sit in a single arc within the mesophyll.
- Two lines for each epidermis: Draw the outermost (upper epidermis) and the innermost (lower epidermis) edges as two clean parallel lines each. The intervening mesophyll is left as blank tissue.
- One label and ruled line: Use a single, horizontal, ruler-drawn line ending on the chosen vascular bundle and write "vascular bundle" at its free end.
Key Takeaways
- A plan diagram shows tissue distribution, not cells.
- Conventions (sharp pencil, no shading, double-line epidermis, correct proportions, clean label) carry marks independently of biological accuracy.
- Bulb-scale leaves have an upper and lower epidermis bounding mesophyll in which vascular bundles sit — the diagram must reflect this arrangement.
Common Mistakes
- Drawing cell detail inside the vascular bundles or mesophyll (a plan diagram must not show cells).
- Using a single line for the epidermis instead of two parallel lines.
- Leaving bundles incomplete or showing fewer than four.
- Drawing the label line freehand, or labelling without a ruled line.
Things to Be Careful About
- The diagram must fill most of the space — small, scrappy drawings lose a mark even if otherwise correct.
- The label must end on the structure, not float in space.
- Do not invent bundles: count what is genuinely visible on the slide in the shaded sector.
Observe the cells in the lower epidermis of the region indicated by the shaded area in Fig. 2.1.
Select a line of four adjacent cells.
Each cell must touch at least one of the other cells.
- Make a large drawing of this line of four cells.
- Use one ruled label line and label to identify a cell wall.
Answer
From the lower epidermis inside the shaded region on M1, select one line of four adjacent cells in which each cell touches at least one other, and draw them large using a sharp pencil. Apply these conventions:
- Use most of the available space; lines must be continuous, thin and sharp.
- Draw only the four cells chosen; each cell must touch at least one other.
- Draw two lines around each cell, with three lines where two cells share a wall.
- Each cell must not be taller than it is wide (cells roughly as wide as, or wider than, they are tall).
- Add one ruled label line and label to identify a cell wall.
High-power drawing of four adjacent lower-epidermal cells, with double walls, triple shared walls and one labelled cell wall.
Background Concept
Epidermal cells of vascular plants are tightly packed, often brick-shaped or polygonal in surface view. Under the microscope each cell is bounded by a cell wall made of cellulose, visible as a clear line after staining. Where two cells meet, both contribute a wall, so the shared boundary appears as two lines very close together — drawn as three lines for clarity. These conventions allow an examiner to see that the candidate understands the difference between the wall of one cell and the wall between two cells.
Understanding the Question
You are asked to look at the lower epidermis inside the shaded sector on M1 (Fig. 2.1), pick out a single line of four cells (each touching at least one neighbour), and produce a large, high-power drawing of just those four cells. Marks are for the conventions listed in the mark scheme, not for biological insight — so accurate, sharp double/triple lines matter as much as the cells themselves.
Approach
Use a higher-power objective so individual cell walls are clearly resolved. Trace the outline of four cells in a line (e.g. left-to-right across the field of view) where you can clearly see all walls. Plan the size so the line of four cells fills most of the space. Decide which cell wall to label before drawing the label line, and check that none of the cells is taller than wide.
Step-by-Step Reasoning
- Most of available space; lines continuous, thin, sharp: Make each cell large; never lift the pencil part-way through a wall; press firmly enough to leave a clean, even line.
- Only four cells, each touching another: Draw exactly the four cells. Cell 1 touches cell 2, cell 2 touches cell 3, cell 3 touches cell 4; cells 1 and 4 may or may not touch depending on layout, but the chain must be unbroken.
- Two lines around each cell; three lines where cells share a wall: The outer perimeter of each cell is drawn as two close parallel lines (its wall). Where two cells are neighbours, the common boundary is shown as three parallel lines (each cell's wall plus the middle line indicating they are two separate walls pressed together).
- Cells not taller than wide: Lower-epidermal cells are typically isodiametric or wider than tall. Adjust the drawing so the long axis is horizontal.
- One label and ruled line to a cell wall: Ruler-drawn line ending on any wall, labelled "cell wall".
Key Takeaways
- Double lines = a single cell wall; triple lines = two adjacent walls between neighbouring cells.
- Epidermal cells are usually wider than tall — a drawing taller than wide is biologically wrong.
- Conventions (clean lines, correct number of cells, correct wall count, one label) carry marks independently of the specimen.
Common Mistakes
- Drawing the perimeter of the cells as a single line (loses the double-wall mark).
- Drawing five or more cells, or leaving cells isolated.
- Making cells taller than they are wide.
- Drawing the label as "cell membrane" (incorrect — what is visible in a stained TS/LS of a plant is the wall, not the membrane).
- Freehand label lines that wander across the drawing.
Things to Be Careful About
- The four cells must be adjacent — pick them carefully under the microscope before starting to draw.
- The label line should end on the wall, with no arrowhead or ambiguity.
- Cells may not be perfectly rectangular; preserve their actual shape rather than imposing an idealised brick.
Fig. 2.2 is a photomicrograph of a stained transverse section of a stem from a different plant.
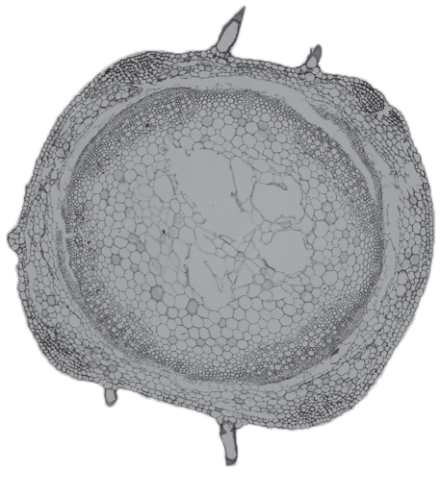
Fig. 2.2
Identify three observable features, other than colour, that are different between the section on M1 and the section in Fig. 2.2.
Record the differences between these three observable features in Table 2.1.
Table 2.1
| feature | slide M1 | Fig. 2.2 |
|---|---|---|
Answer
Observable differences between M1 (bulb scale transverse section) and Fig. 2.2 (stem transverse section):
| feature | slide M1 | Fig. 2.2 |
|---|---|---|
| trichomes (hairs) on epidermis | absent | present |
| number of vascular bundles | many (scattered in mesophyll of each leaf) | fewer (arranged in a single ring) |
| shape / symmetry of section | spiral arrangement of leaves around a central area | single circular stem |
(Any three observable differences earn the marks; alternatives such as "central region small in M1 vs large pith in Fig. 2.2" or "mesophyll bands distinct in M1 vs ring of bundles in Fig. 2.2" are equally acceptable.)
Three observable differences recorded in Table 2.1 (e.g. trichomes absent/present; many vs few vascular bundles; spiral/leaf arrangement vs single circular stem).
Background Concept
Specimens that look superficially similar can differ in many observable ways: the presence of surface hairs (trichomes), the number and arrangement of vascular bundles, the overall shape of the section, the size and nature of the central region, the thickness of the cuticle, the presence of secretory canals, and so on. In a microscope comparison, marks go only to differences that can be seen — not to deductions about function, identity, or habitat.
Understanding the Question
M1 is a TS through a structure of leaves wrapped around a central area (a bulb). Fig. 2.2 is a TS through a stem with trichomes, a pith, and vascular bundles arranged in a ring. You must pick three observable features and record, side by side in Table 2.1, what each specimen shows.
Approach
Systematically scan each specimen: start with the outermost layer (epidermis, cuticle, hairs), then move inwards (cortex / mesophyll, vascular bundles, central region). For each feature, note whether it is present, absent, numerous, sparse, large or small in each specimen.
Step-by-Step Reasoning
- Trichomes: Fig. 2.2 shows clear hair-like projections from the epidermis; M1 does not. This is an observable, single-feature difference worth one mark.
- Number and arrangement of vascular bundles: M1, being a bulb made of wrapped leaves, has many vascular bundles (one per leaf, scattered through the mesophyll). Fig. 2.2 has fewer vascular bundles arranged in a clear ring between cortex and pith.
- Shape / symmetry of the section: The whole section on M1 has a spiral/concentric arrangement of leaf tissues around a central area; Fig. 2.2 is a single circular stem section.
- Alternative features that are also observable: relative size of the central region, thickness of the cuticle, presence/absence of secretory canals, density of stomata, etc. Any three observable, non-colour differences earn the marks.
Key Takeaways
- "Observable" means it can be seen directly; no inference about identity or function.
- Three correct differences, recorded as contrasting statements in the table, is the requirement.
- Always compare like with like — the same feature in both specimens.
Common Mistakes
- Comparing different features in each specimen (e.g. "M1 has leaves; Fig. 2.2 has a pith" — these are not the same feature).
- Stating colour differences (the question explicitly excludes colour).
- Inferring function or identity ("M1 is a bulb", "Fig. 2.2 is a dicot stem") — not observable from a TS alone.
- Listing fewer than three differences or repeating the same feature with different wording.
Things to Be Careful About
- The instruction is to record differences, not similarities.
- Use only the observable features — anything you cannot actually see should not be credited.
Fig. 2.3 is the same photomicrograph as that shown in Fig 2.2, with line X–Y drawn across the section.
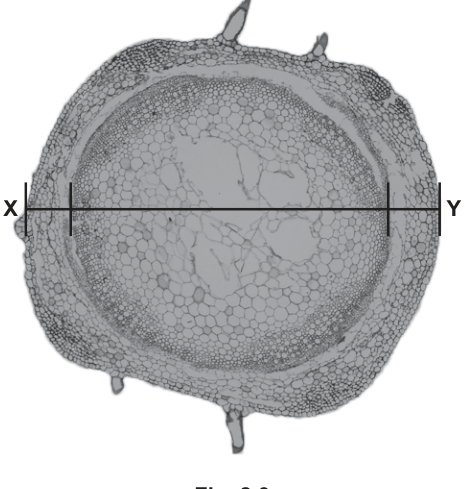
Fig. 2.3
Using the line X–Y, measure the width of the stem section and the width of the central region.
Use appropriate units.
width of stem section = ______ ______
width of central region = ______ ______
Answer
Using the line X–Y drawn across Fig. 2.3:
- width of stem section (whole section, outer edge to outer edge along X–Y) = 75 mm
- width of central region (pith, inner edge of vascular ring to inner edge on the opposite side along X–Y) = 25 mm
(The exact values depend on how the candidate measures on their printed copy; the figures shown are representative. Units must be mm and consistent for both measurements.)
Stem width ≈ 75 mm; central region width ≈ 25 mm (representative values measured along X–Y).
Background Concept
A linear measurement from a printed photomicrograph is taken with a ruler placed along the line provided. The measurement itself is in mm of the printed image, not of the original tissue; absolute tissue size is not required here. Where two structures lie along the same line, both can be measured from a single ruler placement.
Understanding the Question
A horizontal line X–Y has been drawn across Fig. 2.3. You must (1) measure the entire width of the stem section along this line and (2) measure the width of the central region (the pith) along the same line. Both values must carry appropriate units.
Approach
Lay a ruler along the line X–Y. First read off the positions of the two outer edges of the stem — these give the stem width. Then read off the two inner edges of the ring of vascular bundles where the pith begins and ends — these give the central region width. Both readings are in mm to the nearest mm.
Step-by-Step Reasoning
- Place the zero of the ruler at X; read where the left outer epidermis meets the line (essentially X). Read the position of the right outer epidermis at Y. The stem width is the difference.
- Repeat for the pith: the pith begins where the inner edge of the vascular ring crosses X–Y on the left, and ends where it crosses on the right. The pith width is the difference of these two readings.
- Representative values from the photomicrograph shown: stem width ≈ 75 mm; pith width ≈ 25 mm. Acceptable answers will fall within ± a few mm of these.
- Use the same unit (mm) for both values; do not mix units.
Key Takeaways
- One ruler placement along the X–Y line gives both measurements.
- Consistent units (mm here) are required for both.
- Values will vary slightly between candidates depending on the printed copy — the mark scheme accepts a small tolerance.
Common Mistakes
- Mixing units (e.g. mm for one and cm for the other).
- Measuring only the central region and forgetting the whole-stem measurement (or vice versa).
- Including the vascular ring inside the "central region" — the central region is the pith only.
Things to Be Careful About
- The "central region" refers to the pith, not the whole stem and not the vascular ring.
- Record measurements in the answer space provided and use a sensible precision (to the nearest mm).
State the ratio of the width of the stem section to the width of the central region.
ratio = ______
Working
Answer
ratio = 3 : 1
(If the candidate's measurements in (i) differ slightly, the ratio should be the corresponding simplification — e.g. 76 : 24 → 19 : 6, or 78 : 26 → 3 : 1.)
3 : 1
Background Concept
A ratio expresses the relative size of two quantities and is conventionally written in its lowest whole-number form (e.g. 75 : 25 simplifies to 3 : 1). The unit cancels in a ratio — both quantities must be in the same unit before dividing.
Understanding the Question
Using the two measurements from (i), express the stem-section width as a ratio of the central-region width.
Approach
Divide the larger value (stem width) by the smaller (pith width), then simplify the fraction to its lowest whole-number terms.
Step-by-Step Reasoning
- Stem width ≈ 75 mm; central width ≈ 25 mm.
- 75 ÷ 25 = 3.
- Express as 3 : 1.
- If the candidate's measurements are, say, 76 mm and 24 mm, the ratio simplifies by dividing both by 4 to give 19 : 6, which is an acceptable alternative answer.
Key Takeaways
- Always cancel the unit before forming a ratio.
- Always simplify to the smallest whole-number integers.
- Use the candidate's own measured values from (i) — the answer follows from those values (ecf).
Common Mistakes
- Leaving the ratio unsimplified (e.g. writing 75 : 25 instead of 3 : 1).
- Reversing the order (giving 1 : 3) — the question asks "stem to central region".
- Forgetting to cancel the unit.
Things to Be Careful About
- Keep the order specified by the question: width of stem section : width of central region.
- The mark scheme accepts any correctly simplified ratio derived from the candidate's own (i) measurements.
Describe how to determine the mean width of the central region of the stem in Fig. 2.3.
Answer
Take at least two measurements of the width of the central region (e.g. along two or more parallel lines across the section, or repeat the measurement along the same line) and calculate the mean of these measurements.
A typical method:
- Draw several straight lines across the central region of the stem section in Fig. 2.3 (e.g. along X–Y and at one or two other positions parallel to it).
- Measure the width of the central region along each line.
- Add the measurements together and divide by the number of measurements to obtain the mean.
(Carrying forward the candidate's own value from (i) is acceptable — the mark is for the method, not for re-calculating the number.)
Take at least two measurements of the central-region width and calculate the mean.
Background Concept
A single measurement may be unrepresentative. Taking several measurements and calculating a mean reduces the effect of random error and gives a more reliable estimate of the true value. The mean is
where is the sum of the individual measurements and is the number of measurements.
Understanding the Question
The question asks how to determine the mean width of the central region of the stem. The mark is awarded for describing the procedure (take multiple measurements, then average them) — not for a numerical answer.
Approach
Identify what would count as a separate measurement: a different line across the section (e.g. X–Y and one or two parallel lines), or repeating the same measurement several times. Then state that the values are summed and divided by the number of measurements.
Step-by-Step Reasoning
- A mean is only meaningful when more than one value has been measured, so the answer must explicitly say "at least two measurements" (or "several measurements", "repeated measurements").
- Describe what each measurement consists of (e.g. the central-region width along a line drawn across the section).
- State that the measurements are added and divided by the number of measurements.
- The procedural description is what earns the mark; a numerical mean is not required.
Key Takeaways
- "Mean" requires replication.
- The mark scheme explicitly requires "at least two measurements" — one measurement is not enough.
- Means are appropriate for continuous, quantitative data of this kind.
Common Mistakes
- Saying "measure once and write down the value" — that is a single measurement, not a mean.
- Confusing mean with mode or median — the procedure described here is mean.
- Forgetting to specify that the measurements are of the same quantity (the width of the central region).
Things to Be Careful About
- The mark is for the method, not for the calculated mean.
- "At least two" is the minimum; in practice more measurements give a more reliable mean.
- The measurements should be of the same feature (central-region width) using a consistent method.