Biology 9700/33 — May/June 2024
Cambridge AS Level · Advanced Practical Skills · worked solutions for every part, with the mark scheme
Topics Manipulation, Measurement and Observation · Presentation of Data and Observations · Analysis, Conclusions and Evaluation · Use of the Light Microscope
Yeast cells contain enzymes that catalyse the breakdown of sugars, such as glucose and sucrose, to produce ethanol and carbon dioxide.
As the sugars are broken down, the yeast cells in a suspension will sink slowly to the bottom of the container, forming a sediment with a clear liquid above. This process is called sedimentation.
You will investigate the effect of different concentrations of ethanol on the sedimentation of yeast cells.
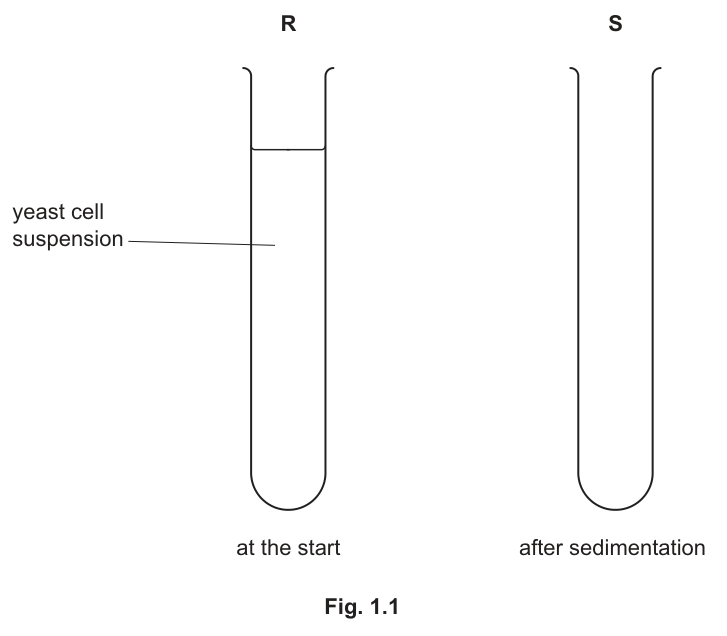
Test-tube R in Fig. 1.1 shows how a test-tube will be set up at the start of the investigation.
Decide what you expect the contents of the test-tube to look like after sedimentation.
On test-tube S in Fig. 1.1, draw:
• lines to show the layers that you expect to see after sedimentation
• a label line and label to identify the sediment.
Answer
Two horizontal lines are drawn on test-tube S:
- the upper line at the same height as the top of the liquid in test-tube R (the total volume of liquid is unchanged during sedimentation);
- a second line part-way up the test-tube, marking the top of the sediment.
A label line is drawn from the lower (denser) region to outside the test-tube, with the word sediment at the end of the line.
Two lines on test-tube S: the upper line at the same height as the top of R, and a lower line marking the top of the sediment, which is labelled.
Background Concept
Sedimentation is the gravitational settling of particles suspended in a liquid. The yeast cells in a suspension are denser than the surrounding medium, so over time they sink to the bottom of the container, leaving clearer liquid above. A key point is that the total volume of liquid is conserved during sedimentation — only the distribution of the cells within it changes.
Understanding the Question
Test-tube R shows the starting condition: a uniform yeast cell suspension filling the lower part of the tube. The question asks you to predict and draw what test-tube S will look like after sedimentation has occurred, and to label the sediment. The two test-tubes are drawn side by side at the same scale, so any height comparison is direct.
Approach
The critical idea is volume conservation. Because the cells and the liquid they sit in occupy the same total volume whether the cells are suspended or settled, the top of the liquid in S must be at exactly the same height as the top of the liquid in R. The cells, however, will no longer be evenly distributed — they will have accumulated at the bottom, leaving clearer liquid above. So you need two lines: one at the top (matching R) and one part-way up marking where the sediment begins.
Step-by-Step Reasoning
- Upper line: the level of liquid in S is the same as in R, so draw a horizontal line at exactly the height of the upper line shown in R.
- Sediment line: the cells have settled to the bottom, forming a sediment layer. Draw a second horizontal line part-way up the tube, marking the top of this sediment.
- Label: draw a label line from the bottom (denser) section to outside the test-tube, and write the word sediment at the end of the line.
- The region between the two lines represents clearer liquid above the sediment; the region below the lower line represents the sediment itself.
Key Takeaways
- The total volume of liquid is conserved during sedimentation.
- A sedimented suspension shows two distinct regions: a sediment layer at the bottom and clearer liquid above.
- The height of the sediment is the dependent variable measured in this experiment.
Common Mistakes
- Drawing the upper line at a different height from R (forgetting that the liquid volume is unchanged).
- Drawing the sediment line too high (leaving little clear liquid) or too low (filling most of the tube with sediment).
- Failing to label the sediment, or labelling the clear liquid above instead.
- Drawing the sediment as a single line at the very bottom rather than as a layer with a defined top.
Things to Be Careful About
- The upper line on S must be at the same height as the top of the liquid in R — this is the key mark.
- The label line should point to the sediment, not to the clear liquid above.
- The label should be the word sediment — not 'yeast', 'cells' or 'pellet'.
You are provided with the materials shown in Table 1.1.
Table 1.1
| labelled | contents | hazard | volume / |
|---|---|---|---|
| E | 100% ethanol | flammable harmful | 50 |
| A | calcium chloride solution | irritant | 15 |
| W | distilled water | none | 150 |
| Y | dried yeast | none |
If any solution comes into contact with your skin, wash off immediately with cold water.
You should wear suitable eye protection.
You will investigate the effect of different concentrations of ethanol on the sedimentation of yeast cells.
You will need to:
• prepare different concentrations of ethanol
• measure the height of the yeast sediment in each concentration of ethanol every four minutes.
You will use proportional dilution to make different concentrations of ethanol.
You will prepare of each concentration, using E and W.
Table 1.2 shows how to prepare two of the concentrations you will use.
Decide which other concentrations of ethanol you will use.
Complete Table 1.2 to show how you will prepare the concentrations of ethanol you will use.
Table 1.2
| percentage concentration of ethanol | volume of E / | volume of W / |
|---|---|---|
| 100 | 10.0 | 0.0 |
| 60 | 6.0 | 4.0 |
Answer
| Percentage concentration of ethanol | Volume of E / cm³ | Volume of W / cm³ |
|---|---|---|
| 100 | 10.0 | 0.0 |
| 90 | 9.0 | 1.0 |
| 80 | 8.0 | 2.0 |
| 70 | 7.0 | 3.0 |
| 60 | 6.0 | 4.0 |
The three additional concentrations of ethanol are 90 %, 80 % and 70 %, each prepared by proportional dilution so that the volumes of E and W sum to 10.0 cm³.
Three additional concentrations: 90% (9.0 cm³ E + 1.0 cm³ W), 80% (8.0 cm³ E + 2.0 cm³ W), 70% (7.0 cm³ E + 3.0 cm³ W).
Background Concept
Proportional dilution is the standard way of preparing a solution of a desired concentration from a more concentrated stock. The principle is:
For a 100 % stock of ethanol, this simplifies to , and the remainder of the final volume is made up with the diluent (here, distilled water W).
Understanding the Question
You must complete Table 1.2 to show how you will prepare the additional concentrations of ethanol you will use in the investigation. The two given rows (100 % and 60 %) demonstrate the proportional-dilution pattern; you must add three more rows in between, giving correct volumes of E and W that total 10 cm³ for each concentration.
Approach
Choose three intermediate concentrations that span the 60–100 % range in useful steps (e.g. 70, 80, 90 %). For each, calculate and . Check that every row sums to 10.0 cm³.
Step-by-Step Reasoning
- 90 %: cm³, so cm³.
- 80 %: cm³, so cm³.
- 70 %: cm³, so cm³.
- Each row sums to 10.0 cm³ ✓.
Key Takeaways
- Proportional dilution uses and .
- The chosen concentrations should give a useful spread across the 60–100 % range so that any trend is detectable.
- The control (C) is set up separately in step 5 and is not entered in this dilution table.
Common Mistakes
- Volumes that do not sum to 10.0 cm³ (e.g. writing 9 cm³ E + 0.5 cm³ W for 90 %).
- Choosing concentrations outside 60–100 % (e.g. 50 % or 0 %).
- Choosing concentrations that are too close together (e.g. 65, 66, 67 %) — too little range to reveal a trend.
- Forgetting the diluent entirely and recording only the volume of ethanol.
Things to Be Careful About
- The question requires three additional concentrations — not two, not four.
- Each row must sum to 10.0 cm³.
- The control tube C is set up in step 5 (water only) and is not part of the dilution table.
Carry out step 1 to step 15.
step 1 In the beakers provided, prepare the concentrations of ethanol as shown in Table 1.2.
step 2 Label one test-tube with the label C.
step 3 Label the other test-tubes with the concentrations of ethanol prepared in step 1.
step 4 Put of A into each of the test-tubes labelled in step 2 and step 3.
step 5 Put of W into the test-tube labelled C.
step 6 Put of the 100% ethanol, E, into the test-tube labelled 100%.
step 7 Repeat step 6 for each of the other concentrations you prepared in step 1.
step 8 Put of W into the beaker labelled Y and stir until all of the dried yeast forms a suspension.
step 9 Stir the yeast cell suspension and put of the yeast cell suspension into the test-tube labelled 100%.
step 10 Repeat step 9 for each of the other labelled test-tubes, including C.
step 11 Put a clean bung into one of the test-tubes and invert the test-tube to mix the contents.
step 12 Repeat step 11 for all the other test-tubes.
step 13 Start timing and immediately measure the height of the sediment in each test-tube. These are the results at the start (0 minutes). Record your results in (a)(iii).
step 14 After 4 minutes, measure the height of the sediment in each test-tube. Record your results in (a)(iii).
step 15 Repeat step 14 so that results are recorded every 4 minutes until the final results are recorded at 20 minutes.
Record your results in an appropriate table.
Working
Representative data (the candidate records their own results; the values below follow the expected trend):
| Percentage concentration of ethanol (%) | Height of sediment / mm | |||||
|---|---|---|---|---|---|---|
| 0 min | 4 min | 8 min | 12 min | 16 min | 20 min | |
| 0 (C) | 0 | 3 | 6 | 9 | 11 | 13 |
| 60 | 0 | 5 | 10 | 14 | 17 | 19 |
| 70 | 0 | 6 | 12 | 16 | 19 | 21 |
| 80 | 0 | 4 | 8 | 11 | 14 | 16 |
| 90 | 0 | 2 | 4 | 6 | 7 | 8 |
| 100 | 0 | 1 | 2 | 2 | 3 | 3 |
Answer
A results table containing:
- a heading for the independent variable: percentage concentration of ethanol (with % as the unit);
- a heading for the dependent variable: height of sediment / mm;
- a row for each concentration prepared in (a)(ii) plus the control C (0 %);
- a height in whole millimetres for every concentration at every 4-minute time point from 0 to 20 min, including the 0-minute and 20-minute readings.
See working — a results table with correct headings and units, recording height of sediment / mm for every concentration (including C) at 0, 4, 8, 12, 16 and 20 min, all to the nearest whole millimetre.
Background Concept
A results table in an experimental write-up must make it unambiguous what was measured, in what units, and at what intervals. Standard conventions include: a heading naming the independent variable (what was changed), a heading naming the dependent variable (what was measured) together with its unit, and a layout that lets the reader read off a value for any combination of conditions. The precision of the recorded values should match the resolution of the measuring instrument — here, a millimetre ruler, so whole millimetres.
Understanding the Question
You have carried out steps 1–15 of the method, measuring the height of the yeast sediment in each test-tube at 0, 4, 8, 12, 16 and 20 minutes. The question asks you to record these results in an appropriate table. The marks are awarded for the table's conventions (headings, units, completeness, precision) rather than for any particular numerical value, since the actual readings are student-dependent.
Approach
Design the table so that:
- the independent variable (concentration of ethanol) labels the rows, with the control C included as 0 %;
- the dependent variable (height of sediment in mm) is the column heading, with the time sub-headings (0, 4, 8, 12, 16, 20 min) underneath;
- every cell contains a height in whole millimetres (because the ruler has 1 mm divisions);
- the value at t = 0 is 0 mm in every tube (sedimentation has not yet started).
Step-by-Step Reasoning
- The independent variable is the concentration of ethanol, so the rows are: 0 (C), 60, 70, 80, 90, 100 %.
- The dependent variable is the height of the sediment; the unit is mm. The time points 0, 4, 8, 12, 16, 20 min are the sub-columns.
- At 0 min the sediment has not yet formed, so the height is 0 mm in every tube.
- At each subsequent time point, read the height of the sediment from the side of the test-tube against the mm ruler, and record the nearest whole millimetre.
- The data in this representative set show a trend: moderate ethanol concentrations (around 70 %) give the greatest sedimentation, and very high concentrations (100 %) give almost none.
Key Takeaways
- Every results table needs headings that name both the quantity and the unit.
- The independent and dependent variables must each be clearly identified.
- All readings (here, one per tube per time point) should be included, and the precision used should be consistent (whole mm here, because of the ruler's resolution).
- A reading of 0 at t = 0 is correct and is expected.
Common Mistakes
- Omitting the control C from the table — the mark scheme requires its height to be recorded.
- Writing heights with decimals (e.g. 5.5 mm) when only whole mm can be read from the ruler.
- Putting the unit only at the top of a column instead of in the heading (the convention is to include the unit in the heading itself, e.g. height of sediment / mm).
- Forgetting to record the value at 0 min (the mark scheme explicitly requires this).
- Laying the table out with time as rows and concentration as columns, making it harder to compare concentrations at a glance.
Things to Be Careful About
- The 0 % row is the control C and must be included.
- Heights must be in whole millimetres; decimals are rejected.
- Headings must specify the quantity and the unit.
- The 0-minute reading is a baseline and should be 0 mm in every tube.
Using your results in (a)(iii), state one conclusion that can be made about the effect of the concentration of ethanol on the sedimentation of yeast cells.
Answer
As the concentration of ethanol increases from 0 % up to about 70 %, the height of the yeast sediment increases; above 70 %, the height of the sediment decreases. (In this data set, sedimentation is greatest at around 70 % ethanol and lowest at 100 %.)
As the concentration of ethanol increases (up to ~70%), the height of the yeast sediment increases; above 70%, the height of the sediment decreases.
Background Concept
A conclusion is a short statement describing the relationship between the independent and dependent variables, based on the candidate's own data. It is not a generic textbook statement — it must reflect the trend actually seen in the recorded results, and it must mention both the variable that was changed (concentration of ethanol) and the variable that was measured (height of the sediment).
Understanding the Question
Having recorded the height of the sediment at each concentration and time point, you must write one conclusion about how the concentration of ethanol affects sedimentation. The mark is for a statement that explicitly mentions both the concentration of ethanol and the height of sedimentation, and that follows the data.
Approach
Look at the column of values at 20 min and describe how the height changes as concentration increases. If the data show a peak at an intermediate concentration, say so; if they show a monotonic increase or decrease, describe the direction of change.
Step-by-Step Reasoning
- Read the heights at 20 min: 0 % → 13 mm, 60 % → 19 mm, 70 % → 21 mm, 80 % → 16 mm, 90 % → 8 mm, 100 % → 3 mm.
- As concentration rises from 0 % to 70 %, the height increases; above 70 %, the height falls.
- The conclusion therefore links concentration to height and reports this non-monotonic trend.
Key Takeaways
- A conclusion must name the independent variable and the dependent variable explicitly.
- A conclusion should be supported by the data, not by textbook generalisations.
- The question asks for one conclusion only.
Common Mistakes
- Saying 'ethanol affects sedimentation' without specifying how (direction, magnitude or any peak).
- Giving a textbook generalisation (e.g. 'high concentrations of ethanol kill yeast cells') rather than a conclusion based on the recorded heights.
- Failing to mention the dependent variable (height of sediment).
Things to Be Careful About
- The statement must mention both the concentration of ethanol and the height of sedimentation (the mark scheme requires this).
- 'Amount of ethanol' is too vague; use 'concentration of ethanol'.
A student suggested the hypothesis:
ethanol is needed for sedimentation of yeast cells to occur.
Using your results in (a)(iii), state whether you support or reject this hypothesis.
Explain how your results provide evidence for this decision.
support or reject ______
explanation
Answer
Reject.
Sedimentation still occurs in test-tube C, which contains no ethanol (only water, calcium chloride and yeast), so ethanol is not needed for sedimentation of yeast cells to occur.
Reject — sedimentation still occurs in the control test-tube C, which contains no ethanol, so ethanol is not needed for sedimentation to occur.
Background Concept
A hypothesis is a testable statement. To evaluate it, the experiment must include a control that differs from the experimental groups only in the variable named in the hypothesis. Here, the hypothesis claims that ethanol is needed for sedimentation — so the control must be a tube without ethanol. That is exactly what test-tube C is: it contains 7 cm³ of water (no ethanol) plus yeast and calcium chloride.
Understanding the Question
The hypothesis is: 'ethanol is needed for sedimentation of yeast cells to occur.' You must decide whether your data support or reject this statement, and explain how the results provide the evidence.
Approach
Look at what happens in the control tube C. If C shows sedimentation, then ethanol cannot be 'needed' (because sedimentation occurs without it). If C shows no sedimentation, then ethanol could indeed be 'needed'. Use the data to decide, then explain using a specific result.
Step-by-Step Reasoning
- Test-tube C contains 0 % ethanol (only water, calcium chloride and yeast).
- In the recorded data, C shows a sediment height of 13 mm at 20 min — that is, sedimentation has occurred in the absence of ethanol.
- Therefore, ethanol is not a requirement for sedimentation. The hypothesis is rejected.
- Explanation: because sedimentation occurs in C (which has no ethanol), ethanol is not needed for sedimentation to take place.
Key Takeaways
- A control without the variable named in the hypothesis is the decisive test of that hypothesis.
- 'Support' or 'reject' must be justified by a specific reference to the data — here, the height recorded for C.
- The word 'needed' is the key: 'needed' means 'without it, the process cannot occur'. If the process occurs without it, the claim is false.
Common Mistakes
- Writing 'support' because 'ethanol increases sedimentation' — that is a different hypothesis from the one stated.
- Failing to mention the control tube in the explanation (the mark scheme requires the evidence to come from the results).
- Saying 'yes' or 'no' without explicitly using the words 'support' or 'reject'.
- Confusing 'rejection' of a hypothesis with rejection of the experimental method — they are different things.
Things to Be Careful About
- The decision must be stated explicitly (support or reject), not implied.
- The explanation must refer to specific results — typically the height in tube C — not to a vague statement that 'sedimentation happened'.
Using the results at 20 minutes, state the concentration, or concentrations, of ethanol that caused the most sedimentation.
Suggest how you could modify this procedure to obtain a more accurate estimate of the concentration that causes the most sedimentation.
modification
Answer
From these results, the greatest height of sediment at 20 min is at 70 % ethanol.
Modification: repeat the experiment using concentrations of ethanol on either side of 70 % (e.g. 65 % and 75 %) and use narrower intervals close to 70 % (e.g. 67 %, 68 %, 69 %, 70 %, 71 %, 72 %, 73 %) to find the concentration that gives the most sedimentation more accurately.
70% caused the most sedimentation. Modify by using concentrations of ethanol either side of 70% (e.g. 65% and 75%) and narrower intervals close to 70%.
Background Concept
A common limitation of an investigation with widely spaced concentrations is that the optimum value can only be located to within the gap between two tested values. To find the optimum more accurately, you can (i) test values on both sides of the apparent optimum and (ii) reduce the spacing of the concentrations near it. Together these approaches 'zoom in' on the true peak.
Understanding the Question
The question has two parts. First, look at the 20-minute column of your table and state the concentration of ethanol that gave the greatest height of sediment. Second, suggest a modification of the procedure that would give a more accurate estimate of the concentration causing the most sedimentation.
Approach
- Part 1: read the 20-min column, find the largest value, and report the corresponding concentration.
- Part 2: think about how to refine the search. The marks are for (a) testing on either side of the stated concentration and (b) using narrower intervals close to it.
Step-by-Step Reasoning
- At 20 min the heights are: 0 % → 13 mm, 60 % → 19 mm, 70 % → 21 mm, 80 % → 16 mm, 90 % → 8 mm, 100 % → 3 mm. The maximum is 21 mm at 70 %.
- Modification 1 — test on either side of 70 %, e.g. additional concentrations at 65 % and 75 % (or any pair bracketing 70 %).
- Modification 2 — use narrower intervals close to 70 % (e.g. 67, 68, 69, 70, 71, 72, 73 %) so the optimum is located more precisely.
- The two modifications together 'home in' on the true optimum, giving a more accurate estimate.
Key Takeaways
- The optimum from a coarse investigation is only an estimate; refining the concentrations gives a more accurate value.
- Improvements should be specific to the limitation: here, the limitation is the gap between tested concentrations.
- Modifications to an investigation should be feasible in a school lab (i.e. achievable dilutions, sensible volumes).
Common Mistakes
- Stating a concentration that did not give the maximum in the student's own data — the mark requires the answer to come from the candidate's results.
- Suggesting only one of the two required modifications (either side, or narrower intervals).
- Suggesting vague improvements such as 'use more concentrations' without specifying that they should bracket the optimum and be closely spaced.
- Suggesting changes that do not address resolution, e.g. using a different type of yeast or a different temperature.
Things to Be Careful About
- The mark scheme requires both modifications: 'use concentrations of ethanol either side' and 'use narrower intervals close to' the optimum.
- The improvement should be a modification of the procedure, not a change of variable (e.g. do not change the yeast or the temperature).
Identify the main source of error in the investigation into the effect of different concentrations of ethanol on the sedimentation of yeast cells.
Answer
The test-tubes were not left for the same length of time before each measurement (because the heights were measured one tube at a time in turn, so the last tube to be measured had stood for longer than the first).
The test-tubes were not left for the same length of time — each tube was measured sequentially, so the later tubes stood for longer than the first.
Background Concept
A source of error in an experiment is anything that makes the recorded result differ from the 'true' value. Sources of error fall into two broad groups: systematic (every reading is shifted in the same direction by the same amount) and random (readings vary unpredictably). A flaw in the method itself — e.g. in timing, sampling or calibration — is also a source of error, and can usually be named and corrected.
Understanding the Question
You are asked to identify the main source of error in the procedure for measuring the height of yeast sediment at 4-minute intervals. The mark is for naming a specific flaw in the method, not a vague comment such as 'human error' or 'parallax'.
Approach
Re-read steps 13–15: the student measures the height of the sediment in each test-tube, one after another, then waits 4 min and repeats. Because the tubes are measured sequentially, they are not all at exactly 4 min, 8 min, etc. when measured — the first tube is measured close to 4 min, the last slightly later. This means the tubes are not being compared at exactly the same time after the start of sedimentation.
Step-by-Step Reasoning
- Step 13 says: 'measure the height of the sediment in each test-tube. These are the results at the start (0 minutes).'
- Step 14 says: 'After 4 minutes, measure the height of the sediment in each test-tube.'
- But measuring each tube takes time, so the first tube is measured close to 4 min, while the last is measured later (perhaps at 4 min + several seconds or more).
- The intervals between measurements are therefore not exactly 4 min in every tube.
- This is the main procedural source of error: the tubes are not left for exactly the same length of time before being measured.
Key Takeaways
- Sources of error should be specific to the procedure and named, not described in general terms.
- Sequential measurement of multiple samples almost always introduces a small timing error.
- Improvements are usually obvious once the error is named: e.g. measure all tubes at exactly the same time using a multi-tube rack and a single ruler, or take a photograph at each time point.
Common Mistakes
- Vague answers such as 'human error', 'parallax error' (parallax when reading a ruler is real but is not the main error here) or 'not accurate' — these do not name a specific flaw in the method.
- Naming an irrelevant error, e.g. 'ethanol is flammable' (a safety issue, not a source of error in the data).
- Confusing 'source of error' with 'improvement': the question asks for the error, not the fix.
Things to Be Careful About
- The mark scheme gives 'the test-tubes were not left for the same length of time' as a model answer; a similarly specific procedural error is needed.
- The error should be the main one — i.e. the flaw that most affects the recorded data, not a minor cosmetic issue.
Another possible source of error, when carrying out step 6 of the investigation, is shown in Table 1.3.
Complete Table 1.3 by stating whether the type of error is systematic or random and the effect the error may have on the trend seen in the results.
Table 1.3
| source of error | systematic error or random error | effect on the trend |
|---|---|---|
| the mark on the syringe used to measure the volume of ethanol actually measured |
Answer
| Source of error | Systematic or random? | Effect on the trend |
|---|---|---|
| The 7 cm³ mark on the syringe used to measure the volume of ethanol actually measured 7.1 cm³ | Systematic | No effect on the trend (every tube receives slightly more ethanol than intended, so all heights are shifted by a similar small amount; the relative differences between concentrations are preserved). |
Systematic error; no effect on the trend.
Background Concept
Systematic errors shift every reading in the same direction by the same amount (or by a consistent proportion). They arise from miscalibrated equipment, a consistent operator technique or a method bias. They do not change the shape of the trend, only the absolute values. Random errors vary unpredictably from reading to reading; they affect the spread (precision) of the data rather than the average. Whether an error affects the trend depends on whether it is consistent across all the readings being compared.
Understanding the Question
You are given a specific error: the 7 cm³ mark on the syringe actually delivers 7.1 cm³ (i.e. it is mis-marked by +0.1 cm³). You must (a) classify the error as systematic or random, and (b) state its effect on the trend in the results.
Approach
Ask two questions:
- Is the error consistent (always +0.1 cm³) or does it vary randomly? If consistent, it is systematic.
- Does the error affect every reading similarly? If yes, the trend — the pattern of how height changes with concentration — is preserved.
Step-by-Step Reasoning
- The 7 cm³ mark on the syringe gives 7.1 cm³ every time it is used — the error is consistent, so it is systematic.
- Every tube measured with this syringe receives 0.1 cm³ more ethanol than the volume stated in the method.
- Because every tube is affected by the same small extra volume, the heights recorded are all shifted by a similar small amount. The differences between concentrations are essentially preserved.
- Therefore, the error has no effect on the trend (the shape of the graph of height against concentration is unchanged); it only changes the absolute values slightly.
Key Takeaways
- A miscalibrated measuring instrument gives a systematic error.
- A systematic error that affects all readings equally does not change the trend — only the absolute values.
- A systematic error that affects some groups more than others would change the trend.
- A random error would increase the spread of readings and could obscure the trend if it were large.
Common Mistakes
- Classifying the error as 'random' because the mark is misaligned by 0.1 cm³ — alignment is irrelevant; what matters is that the error is consistent, which makes it systematic.
- Saying the error 'changes the trend' or 'affects the results' without explaining that it does not change the pattern — only the absolute values.
- Saying the error 'makes the results invalid' — the results are still comparable to one another, they are just slightly biased.
Things to Be Careful About
- The mark scheme requires both: 'systematic' and 'no effect on the trend' (a single linked statement). Missing either loses the mark.
- The error only has no effect on the trend because it is consistent across all tubes — that connection is the reasoning behind the answer.
In fermentation, the action of yeast converts some of the carbohydrates in plants to ethanol and carbon dioxide.
A scientist investigated the production of ethanol during the fermentation of carbohydrates from different sources.
The investigation was carried out at and at pH5, using the yeast Saccharomyces cerevisiae. All other variables were kept constant.
The results are shown in Table 1.4.
Table 1.4
| source of carbohydrate | percentage ethanol produced per of carbohydrate |
|---|---|
| molasses | 3.80 |
| oranges | 1.05 |
| grapes | 2.65 |
| beetroot | 3.35 |
| rice | 4.70 |
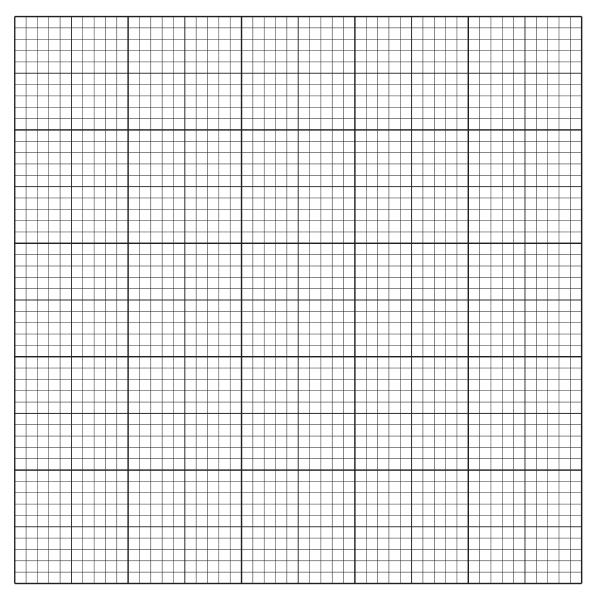
Draw a bar chart of the data in Table 1.4 on the grid in Fig. 1.2.
Use a sharp pencil.
Answer
Bar chart requirements:
- x-axis: source of carbohydrate, with each bar labelled (molasses, oranges, grapes, beetroot, rice).
- y-axis: percentage ethanol produced per 100 g of carbohydrate, scale 0 to 5 (labelled at least every 2 cm, e.g. 0, 1, 2, 3, 4, 5).
- Five bars of equal width and equal spacing, heights: molasses 3.80, oranges 1.05, grapes 2.65, beetroot 3.35, rice 4.70.
- Bars drawn with straight horizontal tops and vertical sides that join exactly to the x-axis.
See diagram — a bar chart of percentage ethanol per 100 g of carbohydrate (y-axis) against source of carbohydrate (x-axis), with five bars at heights 3.80, 1.05, 2.65, 3.35 and 4.70 for molasses, oranges, grapes, beetroot and rice respectively.
Background Concept
A bar chart is used to compare a quantitative variable across a number of discrete categories. The convention is to place the categorical variable on the x-axis and the quantitative variable on the y-axis, with bars of equal width and equal spacing. To use the grid efficiently, the y-axis scale should span at least half the available grid, with sensible intervals (1 or 2 cm), and the bars should be drawn with a sharp pencil and a ruler so that the tops are straight and the sides are vertical.
Understanding the Question
Table 1.4 gives the percentage ethanol produced per 100 g of carbohydrate from five different sources. You are asked to draw a bar chart of these data on the grid in Fig. 1.2. The marks are for the conventions: axes labelled with both quantity and unit, a sensible scale, accurate plotting, and well-drawn bars.
Approach
- Identify the categorical variable (source of carbohydrate) for the x-axis and the quantitative variable (percentage ethanol per 100 g) for the y-axis.
- Choose a y-axis scale that uses at least half the grid and gives round-number intervals (e.g. 0–5 in steps of 1).
- For each category, draw a bar whose top is at the correct value on the y-axis.
- Use a sharp pencil and a ruler: tops straight, sides vertical, edges exactly on the axis.
Step-by-Step Reasoning
- x-axis label: source of carbohydrate, divided into five equal categories, each labelled: molasses, oranges, grapes, beetroot, rice.
- y-axis label: percentage ethanol produced per 100 g of carbohydrate. Choose a scale of 0 to 5 (1 unit per 2 cm), with labels at 0, 1, 2, 3, 4, 5 — this uses the grid efficiently and accommodates the largest value (4.70 for rice).
- Bar heights (from Table 1.4): molasses 3.80, oranges 1.05, grapes 2.65, beetroot 3.35, rice 4.70.
- Drawing the bars: each bar should be the same width, evenly spaced, with a straight horizontal top exactly at the value on the y-axis and vertical sides that meet the x-axis exactly.
- Rice gives the tallest bar (4.70), molasses the next (3.80), then beetroot (3.35), grapes (2.65), and oranges the shortest (1.05).
Key Takeaways
- Axes must each carry a label stating the quantity and the unit.
- The y-axis scale must use at least half the available grid and be labelled at every major line (or at least every 2 cm).
- Bars must be plotted accurately, with straight tops and vertical sides that meet the axis exactly.
- Bar charts are for discrete categories on the x-axis, not for continuous variables (where a histogram or line graph would be used).
Common Mistakes
- Using a scale that is too small (e.g. 0–10) — wastes the grid and reduces plotting accuracy.
- Using awkward intervals (e.g. 0, 3, 5, 7) that are not multiples of 1 or 2.
- Failing to label the axes or omitting the unit on the y-axis.
- Drawing bars with rough or sloping tops, or with sides that do not meet the axis exactly — these lose plotting marks.
- Plotting the bars in the wrong order (any order is acceptable as long as each bar is correctly placed, but mixing up the data and the categories loses marks).
Things to Be Careful About
- The y-axis must extend to at least 5 (the highest value is 4.70) so the tallest bar fits the scale.
- Bars must be the same width and evenly spaced — not all crammed to one side.
- Each bar must be labelled with its category directly under it on the x-axis.
The investigation was repeated using a different yeast, Schizosaccharomyces pombe.
All the variables were kept the same as in the first investigation.
The percentage of ethanol produced using Schizosaccharomyces pombe was found to be lower with all of the sources of carbohydrate.
The results are shown in Table 1.5.
Table 1.5
| source of carbohydrate | percentage ethanol produced per of carbohydrate | |
|---|---|---|
| Saccharomyces cerevisiae | Schizosaccharomyces pombe | |
| molasses | 3.80 | 3.68 |
| oranges | 1.05 | 1.00 |
| grapes | 2.65 | 2.57 |
| beetroot | 3.35 | 3.29 |
| rice | 4.70 | 4.34 |
Suggest why the percentage of ethanol produced by Schizosaccharomyces pombe is lower than the percentage of ethanol produced by Saccharomyces cerevisiae for all sources of carbohydrate.
Answer
Any two of the following:
- The optimum pH for Schizosaccharomyces pombe is not the same as for Saccharomyces cerevisiae; at pH 5, the enzymes of S. pombe work below their optimum rate, so less ethanol is produced.
- The optimum temperature for S. pombe is not the same as for S. cerevisiae; at 30 °C, the enzymes of S. pombe work below their optimum rate.
- S. pombe is unable to ferment all of the sources of carbohydrate (e.g. it lacks the enzymes needed to break down some of the sugars present), so it produces less ethanol from those sources.
Two from: optimum pH of S. pombe differs from S. cerevisiae / optimum temperature of S. pombe differs / S. pombe cannot ferment all the carbohydrate sources.
Background Concept
Different species of yeast have different optimum conditions for fermentation (pH, temperature) and different enzyme complements (so they may be unable to ferment all the same sugars). When an experiment is run at a fixed pH and temperature (here 30 °C and pH 5), species whose optima differ from those values will perform below their best, while species whose optima match will perform well. A species lacking the right enzyme for a given sugar will produce little or no ethanol from that sugar.
Understanding the Question
Table 1.5 shows that for every source of carbohydrate, S. pombe produces less ethanol than S. cerevisiae under identical conditions. The question asks you to suggest why — i.e. to give biological reasons for the consistently lower yield with S. pombe.
Approach
The mark scheme credits any two of three possible reasons. Read each in turn and ask whether it is consistent with the data:
- Different optimum pH — the experiment used pH 5; if S. pombe's optimum pH is not 5, its enzymes work sub-optimally and ethanol yield is lower.
- Different optimum temperature — the experiment used 30 °C; if S. pombe's optimum is not 30 °C, similar reasoning applies.
- Inability to ferment some of the carbohydrate sources — if S. pombe lacks enzymes for some of the sugars, it will produce less ethanol from those sources.
Any two of these earn full marks.
Step-by-Step Reasoning
- The experimental variables kept constant are 30 °C and pH 5. Any species whose optima differ from these values will not work at their best.
- The data show a systematic difference: S. pombe is lower for every source. A difference that applies to every substrate is most easily explained by the conditions (pH, temperature) being wrong for S. pombe, or by a general metabolic difference (e.g. it ferments less efficiently), rather than by the absence of a single specific enzyme.
- A substrate-specific explanation (such as 'cannot ferment beetroot') would not account for the universal difference.
- The two best general explanations are therefore (i) the pH is not optimal for S. pombe and (ii) the temperature is not optimal for S. pombe. A third acceptable answer is that S. pombe is unable to ferment all the sources of carbohydrate used.
Key Takeaways
- A consistent pattern across all data points points to a systematic cause (e.g. sub-optimal conditions for one species), not to a one-off substrate effect.
- Enzymes have specific optima for pH and temperature; running an experiment at the optimum for one species does not make it optimum for another.
- Different yeasts have different enzyme complements and so differ in the range of carbohydrates they can ferment.
Common Mistakes
- Giving vague answers such as 'different yeasts work differently' or 'one yeast is better than the other' — these are not specific biological reasons.
- Giving only one reason when the question is worth 2 marks.
- Saying 'S. pombe cannot ferment carbohydrates' — the data show it can (it produces ethanol from all five sources, just less than S. cerevisiae); the correct phrasing is that it may not be able to ferment all of the carbohydrate components in each source, or that it is less efficient at it.
- Confusing S. pombe's lower yield with a flaw in the method, rather than a biological difference.
Things to Be Careful About
- The mark scheme accepts any two of the three suggested reasons; both must be given.
- Reasons must be biological (about the enzymes, optima or metabolism of S. pombe), not procedural.
L1 is a slide of a stained transverse section through a plant stem.
Draw a large plan diagram of the whole section on L1. Use a sharp pencil.
Use one ruled label line and label to identify the cortex.
Answer
A large plan diagram of the whole transverse section, drawn on L1 with a sharp pencil. The diagram must:
- use most of the available space;
- contain no shading anywhere;
- follow the correct overall shape of the whole section;
- show the correct number of tissue layers (epidermis, cortex, ring of vascular bundles, pith), in the correct proportions;
- draw the epidermis as a continuous double line around the outside;
- include NO individual cells inside any region;
- carry ONE ruled label line, drawn with a ruler, leading from the cortex to a label reading cortex.
See plan diagram on L1.
Background Concept
A plan diagram is a low-magnification outline that records the overall shape of a specimen and the distribution of its different tissues, but shows no cellular detail — it is a tissue map, not a cell picture. CIE examiners use it to test whether you can see the section as a whole and record it accurately.
The non-negotiable conventions for a plan diagram are:
- a sharp HB pencil with clean, continuous lines;
- no shading of any region (shading is reserved for high-power cell drawings);
- no individual cells drawn inside any tissue;
- the epidermis drawn as a double line, because at low power the wall and the cuticle of each epidermal cell appear as two separate lines;
- the relative thickness of each tissue layer true to the specimen;
- a single straight ruled line for each label, ending precisely on the structure, with the name written horizontally.
Understanding the Question
You are asked to produce a plan diagram of the entire transverse section of the plant stem on L1 and to label the cortex. The 5 marks are awarded against five specific criteria (one per marking point), so every feature matters. There is no written explanation to add; the diagram is the answer. Because the candidate observes L1 in person, the exact shape of the section is set by the slide, not by the question paper.
Approach
First, scan the whole section at low power and identify each tissue layer in order from the outside in. Then decide on the proportions — how thick the cortex should be relative to the pith, how large the ring of vascular bundles is, and what the outline of the section looks like. Sketch the outline lightly, then commit to a clean, large, unshaded final diagram. Finish by adding a single label and label line for the cortex.
Step-by-Step Reasoning
Working through the five marking points:
- Most of the available space, no shading — make the diagram as large as the drawing box allows so each tissue layer is visible; do not apply any pencil shading anywhere on the diagram.
- Correct shape of the whole section, no cells — trace the outer boundary of the section accurately; never draw individual cells inside the cortex, pith or vascular tissue.
- Correct number of tissue layers — show every distinct layer present on the slide, in the correct order from outside to inside, with their relative thicknesses matching the specimen.
- Epidermis as two lines — the outermost layer is drawn as two close, continuous, parallel lines, representing the cell wall and cuticle of the epidermal cells together.
- One ruled label line and label 'cortex' — a single straight line drawn with a ruler, going from inside the cortex out to the margin, with the word cortex written neatly in lower case at the end of the line.
Key Takeaways
- A plan diagram is a tissue-level map, not a cellular drawing.
- Conventions (no shading, no cells, double epidermis, ruled labels) carry the marks.
- Proportions and the number of tissue layers must be true to the slide.
Common Mistakes
- Shading any region, which makes the plan look like a cell drawing and loses the relevant marks.
- Drawing individual cells inside the cortex, pith or vascular bundles.
- Using a single line for the epidermis, or making the outline wobbly where the section is smooth.
- Adding several extra labels when only the cortex is required, or omitting the ruler rule on the label line.
Things to Be Careful About
- Keep pencil lines thin and continuous — re-trace any shaky line cleanly rather than leaving a fuzzy line.
- Make sure the cortex label line touches the cortex itself, not the general area or a neighbouring tissue.
- Double-check the number of layers on the slide before drawing; missing or invented layers cost the third mark outright.
Observe the cells in the cortex on the section of the stem on L1.
Select a group of four adjacent cortex cells.
Each cell must touch at least two other cells.
• Make a large drawing of this group of four cortex cells.
• Use one ruled label line and label to identify the cell wall of one cortex cell.
Answer
A large drawing of FOUR adjacent cortex cells, drawn under high power on L1 with a sharp pencil. The drawing must:
- use most of the available space;
- use thin, continuous, sharp lines (no broken or thick lines);
- show exactly four cells;
- have each cell touching at least two of the others;
- show two clear lines around each individual cell;
- show three lines where two cells share a wall;
- record the detailed shapes of the cortex cells as they actually appear;
- carry ONE ruled label line, drawn with a ruler, leading from the cell wall of one cell to a label reading cell wall.
See drawing of four cortex cells on L1.
Background Concept
A high-power cell drawing records the cellular detail of a small group of cells exactly as seen down the microscope. Unlike a plan diagram, a cell drawing DOES show the shape of individual cells, but it is still unshaded, drawn with a sharp pencil in clean, continuous lines. CIE examiners test whether you can see the cells accurately and obey the strict line conventions.
The non-negotiable conventions for a cell drawing are:
- a sharp HB pencil, lines thin and continuous, no sketching/fuzzy lines;
- no shading anywhere (no stippling, no hatching, no coloured pencil);
- two distinct lines around every cell, because the cell wall has two sides and at high power both are visible;
- where two cells share a wall, three lines are visible (one from each cell plus the shared middle wall);
- only structures that are actually visible are drawn — no inferred organelles, nuclei, or contents unless they can be seen;
- labels use a single straight ruled line, ending exactly on the structure, with the name written horizontally.
Understanding the Question
You are asked to select a group of four adjacent cortex cells, where each cell touches at least two of the others, and to make a large high-power drawing of them with the cell wall of one cell labelled. The 5 marks are awarded against five specific criteria (one per marking point), so every feature matters. Because L1 is in front of you, the actual cell shapes come from what you see under the microscope.
Approach
First, look at the cortex under high power and find a clear area where four cells are clustered and each cell touches at least two others. The cells in the cortex are typically roughly polygonal with slightly curved edges and may vary a little in size. Sketch the cluster lightly to get the proportions right, then redraw the final version with clean, thin, continuous double lines. Finally, add one label line and the label for the cell wall.
Step-by-Step Reasoning
Working through the five marking points:
- Most of the available space, lines continuous, thin and sharp — make the four cells as large as the box allows, and draw every line as a single clean stroke, no breaks, no thick doubling, no fuzzy sketching.
- Only four cells, each touching at least two others — exactly four cells in the drawing; the arrangement must allow each cell to be in contact with at least two of the others (a tight cluster, not a row of four isolated cells).
- Two lines around each cell, three lines where cells touch — every cell is bounded by its own two-line wall, and where two cells share a wall you can see all three lines (left cell's inner wall, the shared middle, right cell's inner wall).
- Detailed shapes of the cortex cells — the cells are drawn with their actual shapes: polygonal, with slightly curved or wavy edges, varying a little in size and shape, NOT as identical circles or regular polygons.
- One ruled label line and label 'cell wall' — a single straight line drawn with a ruler, from the cell wall of one cell out to the margin, with the words cell wall written at the end.
Key Takeaways
- Cell drawings obey strict line conventions: two lines per cell, three where cells meet.
- Only four cells in this drawing, in a cluster where each touches at least two others.
- Detail means realistic cell shapes, not invented organelles.
- No shading under any circumstances.
Common Mistakes
- Drawing five or more cells, or arranging them in a chain where end cells only touch one neighbour.
- Using a single line around each cell, which loses the 'double line' mark.
- Drawing identical, regular shapes (squares, hexagons, circles) instead of the slightly irregular polygonal shapes of real cortex cells.
- Adding shading, or inventing a nucleus or vacuole that is not clearly visible.
- Labelling more than the cell wall, or omitting the ruler rule on the label line.
Things to Be Careful About
- Keep each line a single clean stroke — do not go over a line repeatedly or it will appear thick.
- Make sure the cluster of four really is a cluster: each cell must touch at least two others (a line of four cells only earns this mark if the middle two touch two others and the end cells each touch one — which fails).
- The label line must end on the cell wall, not inside the cell or in the middle of three lines.
Fig. 2.1 is a photomicrograph of a stained transverse section through a different plant.
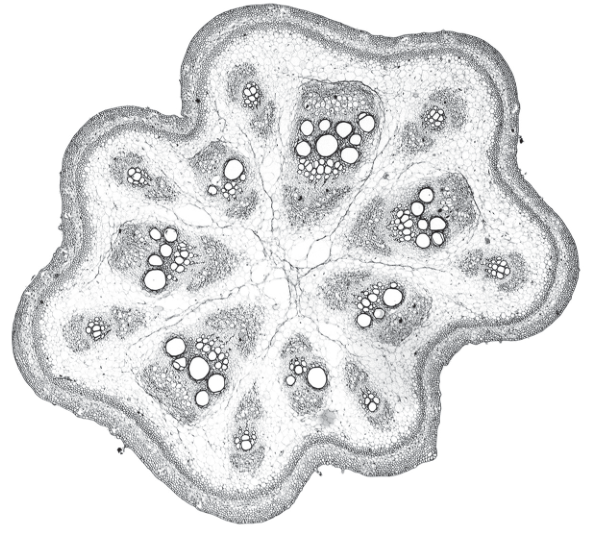
Identify three observable features, other than colour, that are different between the section on L1 and the section in Fig. 2.1.
Record the differences between these three observable features in Table 2.1.
Table 2.1
| feature | L1 | Fig. 2.1 |
|---|---|---|
Answer
Differences between L1 and Fig. 2.1 (the candidate records only what is directly visible under the microscope and in the photomicrograph):
| feature | L1 | Fig. 2.1 |
|---|---|---|
| shape of the section | smooth / oval | wavy / lobed outline |
| position of vascular bundles | arranged in a (regular) ring | not in a regular ring / scattered |
| size of vascular bundles | all vascular bundles similar in size | some vascular bundles large, others small |
(Any three observable, non-colour differences, correctly stated, score the marks; further examples include the number of tissue layers and the prominence of the cortex band.)
Three observable differences recorded in Table 2.1.
Background Concept
When you compare two specimens on a microscope slide, the rules of CIE marking are strict: only features you can actually see may be recorded. Features you cannot see (or that you have to infer, such as 'this stem must be a dicot because of how the bundles are arranged') are NOT credited. Colour is excluded by the question itself.
Observable features for a plant transverse section include: the outline of the whole section; the number and identity of tissue layers; the position, size, number and shape of the vascular bundles; the relative thickness of the cortex, pith and vascular ring; and the prominence of the epidermis.
Understanding the Question
You have to look at L1 down the microscope and at the printed photomicrograph in Fig. 2.1, and write THREE observable differences (other than colour) between them in Table 2.1. There are 4 marks: 1 mark for the rule of observable features only, and 1 mark for each correct difference (up to three).
The most reliable differences, based on what is visible in Fig. 2.1 (lobed outline, irregular bundle arrangement, mixed bundle sizes) and what is typical of a smooth dicot stem on L1, are listed in the table above.
Approach
- First scan L1 at low power and note what you see: shape of the section, number of layers, where the vascular bundles sit, and whether the bundles are uniform or varied in size.
- Then look at Fig. 2.1 and do the same.
- Choose the three most striking, clearly visible differences (NOT colour) and record them, one per row, in Table 2.1.
- Avoid any wording that depends on inference — only write what you can see.
Step-by-Step Reasoning
- Shape of the section: L1 is a smooth oval/circle, Fig. 2.1 has a clear wavy/lobed outer boundary. This is the most obvious visible difference.
- Position of vascular bundles: L1 has them in a regular ring near the perimeter; in Fig. 2.1 the bundles are not in a regular ring (they follow the wavy outline and look scattered).
- Size of vascular bundles: L1 has bundles that are all similar in size; Fig. 2.1 has some large bundles and some noticeably smaller ones.
The 'records only observable differences' mark is earned by avoiding any statement that cannot be directly seen (e.g. 'L1 is a dicot stem' or 'Fig. 2.1 has more support tissue') and by NOT including colour as a difference.
Key Takeaways
- 'Observable' is the key word: only what is visible, no inference.
- Colour is excluded by the question — three DIFFERENT, non-colour features are needed.
- The strongest answers pick features that are unambiguous in both images (shape, bundle position, bundle size).
Common Mistakes
- Writing 'L1 is a dicot, Fig. 2.1 is a monocot' — this is an inference, not an observation; no mark.
- Including 'colour' as a difference — explicitly excluded by the question; loses one mark.
- Vague entries like 'the structure is different' — too vague to score.
- Only writing one or two rows — the table has three rows and all three should be filled.
Things to Be Careful About
- Each row of the table must give a named feature (e.g. 'shape of section', 'position of vascular bundles') — a featureless row loses the rule mark.
- Make the wording as specific as possible (e.g. 'wavy outline' rather than 'different shape').
- Do not write about staining intensity or colour tints — colour is excluded.
Fig. 2.2 is the same photomicrograph as that shown in Fig. 2.1.
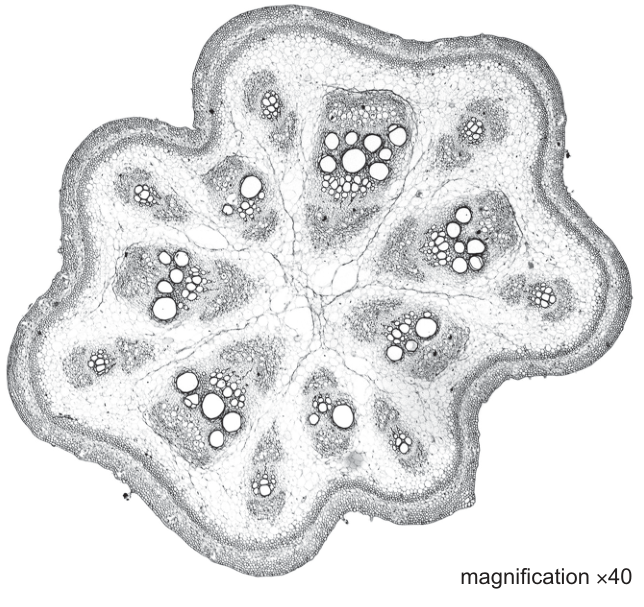
Determine the mean actual diameter of the stem in Fig. 2.2.
Show your working.
mean actual diameter ______
Working
Take at least two measurements of the stem's diameter across Fig. 2.2, in different directions, on the printed image.
Representative example (values depend on the printed page):
Answer
mean actual diameter ≈ 3.1 mm
3.1 mm
Background Concept
The magnification printed on a photomicrograph tells you how many times larger the image is than the actual specimen. The relationship is:
Rearranging, the actual size of the specimen is the image size divided by the magnification:
A mean is a single representative value calculated by adding several measurements and dividing by how many measurements were taken. Taking more than one measurement and averaging them reduces the effect of random error, so the mean is a more reliable estimate than any single measurement.
Understanding the Question
Fig. 2.2 is the same photomicrograph as Fig. 2.1, but with the magnification ×40 printed on it. You are asked to determine the mean ACTUAL diameter of the stem, so you must measure the diameter of the stem on the printed page, calculate a mean, and then divide by the magnification to convert the image measurement into the true size of the stem. The 4 marks are: 1 for taking ≥2 measurements with units, 1 for adding and dividing (the mean), 1 for dividing the mean by ×40, and 1 for the correct final answer with units.
The candidate's measurements depend on the size at which the image is printed, so any pair of measurements in the same ballpark will earn the method marks; the final answer just needs to be a sensible stem diameter in mm (typically a few mm for a young plant stem).
Approach
- Place a ruler across the widest part of the stem in Fig. 2.2 and record the measurement in mm.
- Take a second measurement at right angles (or in a different direction) across the stem, again in mm.
- Add the two measurements, divide by 2 to get the mean image diameter.
- Divide the mean image diameter by 40 to get the mean actual diameter.
- Quote the answer in mm, to 2 or 3 significant figures.
Step-by-Step Reasoning
Using representative values (your own measurements will differ depending on the print size of the image):
- Measurement 1:
- Measurement 2:
- Mean:
- Actual diameter:
This is in the right order of magnitude for the actual diameter of a small plant stem (a few mm) at this magnification, which is a useful sanity check on the answer.
Key Takeaways
- The key formula is actual size = image size ÷ magnification.
- The mean is a more reliable estimate than any single measurement, so two or more measurements are needed.
- Always carry the units (mm) all the way through, and quote units on the final answer.
Common Mistakes
- Measuring only once and calling that the mean — loses the 'at least two measurements' mark.
- Forgetting to divide by the magnification, giving the image size instead of the actual size.
- Multiplying by the magnification instead of dividing, which produces a value larger than the printed image.
- Quoting the final answer without units, or in the wrong unit (e.g. cm without converting).
- Giving too many significant figures (e.g. 3.12500 mm) — 2 or 3 sig figs is appropriate.
Things to Be Careful About
- The units of the printed measurement and the units of the final answer must be consistent; do not mix mm and cm part-way through without a conversion.
- A common error is to take measurements in cm on the page and forget to convert to mm before dividing by 40, or to take measurements in mm and forget to keep them in mm at the end.
- The final answer is the actual size of the stem, NOT the size on the printed page; the magnification step is essential.
- Sanity-check: a small plant stem cross-section at ×40 should be a few mm across, not a fraction of a mm and not many cm.