Biology 9700/13 — May/June 2024
Cambridge AS Level · Multiple Choice (AS Level) · answer key with instant marking and worked solutions
Topics Cell Structure · Biological Molecules · Gas Exchange · Cell Membranes and Transport · Enzymes · The Mitotic Cell Cycle · +5 more
Tap an option under each question to check it — your score builds as you go.
An eyepiece graticule can be calibrated using a stage micrometer.
What is the correct reason why an eyepiece graticule is calibrated?
Options
A An eyepiece graticule can be used to make measurements.
B An eyepiece graticule is magnified by the objective lens.
C An eyepiece graticule magnifies the specimen.
D An eyepiece graticule makes comparisons.
Working
The eyepiece graticule is a small disc with a scale etched onto it that sits inside the eyepiece lens of a light microscope. It is not a magnifying element — it is simply a reference scale superimposed on the image of the specimen.
Because the graticule is viewed together with the specimen, the apparent size of one graticule division (in real micrometres) changes depending on which objective lens is in use. The stage micrometer is a slide with a precisely known scale, and is used to determine how many micrometres each graticule division represents at a given magnification.
Once the graticule has been calibrated at a particular objective, it can be used to take actual (real) measurements of a specimen — that is the entire point of calibrating it.
- A — correct: once calibrated, the graticule enables real measurements to be made.
- B — incorrect statement of purpose: describes an effect, not why calibration is done.
- C — incorrect: the graticule does not magnify the specimen.
- D — too vague: the graticule is used to make measurements, not merely comparisons.
Answer
A
A
Background Concept
A light microscope has two lens systems: the objective lens (close to the specimen) and the eyepiece lens (close to the eye). The total magnification is the product of the two. Inside the eyepiece, just above the objective's image, sits a small glass disc called the eyepiece graticule (or eyepiece reticle), which carries an etched scale — typically 100 equal divisions across its diameter.
The graticule is part of the viewing system, not the specimen. Because the same physical graticule disc is viewed through different objective lenses, the real distance on the slide that one graticule division corresponds to is different at each magnification:
- With a ×10 objective, one graticule division may represent about 10 µm.
- With a ×40 objective, the same division may represent only about 2.5 µm.
To convert "number of graticule divisions" into a real distance in micrometres, the graticule must be calibrated at each magnification. This is done using a stage micrometer, which is a microscope slide on which a precisely known scale (usually 1 mm divided into 100 parts of 10 µm each) has been etched. The two scales are lined up and the number of graticule divisions that spans a known number of stage micrometer divisions is read off, allowing a calibration factor to be calculated.
Understanding the Question
The question asks why the eyepiece graticule is calibrated. The stem simply states that it can be calibrated using a stage micrometer; the candidate must pick the option that correctly states the purpose of doing so.
The command word here is implicit: pick the option that gives the correct reason for calibration. Three of the four options describe properties of a graticule that are either true-but-irrelevant or false.
Approach
Eliminate the options that confuse the role of the graticule (it is a reference scale, not a magnifier), then identify the option that captures its calibrated function — enabling actual, real-unit measurements of specimens.
Step-by-Step Reasoning
- Recall what a graticule is. It is a fixed reference scale inside the eyepiece; it does not itself magnify anything.
- Recall why calibration is needed. Because the real distance represented by one graticule division changes with the objective lens, the value of each division (in µm) must be determined for that specific objective. This converts a visual scale into a measuring scale.
- Evaluate each option:
- A — correct. Once calibrated, the graticule can be used to make real measurements of a specimen (e.g. the length of a cell). This is precisely the reason for calibrating it.
- B — describes a true effect but is not a reason. The fact that the graticule image is altered by the objective is precisely why it must be re-calibrated for each objective, but the purpose of calibration is to obtain a measuring tool, not to observe magnification.
- C — false. The graticule is a passive reference; the lenses magnify the specimen, not the graticule scale on the specimen's behalf.
- D — too vague. A ruler allows comparisons, but its real value is in measurement. A candidate stating this would not be answering why calibration is carried out.
Key Takeaways
- An eyepiece graticule is a fixed scale inside the eyepiece, used as a measuring ruler once calibrated.
- A stage micrometer has a known scale (typically 10 µm per division) and is used to find the value of one graticule division at each objective.
- Calibration must be repeated for each objective lens because the relationship between graticule divisions and real distance changes with magnification.
- The graticule does not magnify the specimen; it is a reference superimposed on the magnified image.
Common Mistakes
- Confusing the graticule with a magnifier. Students often think the graticule itself enlarges the specimen (option C). It does not — the lenses do that.
- Thinking calibration is about the graticule's own size. Option B is true (the graticule image is altered by the objective), but it states an effect rather than the reason for calibrating.
- Treating "comparison" as the main purpose. Option D is too vague; measurement requires an absolute scale, which is what calibration provides.
Things to Be Careful About
- Remember that the graticule sits in the eyepiece, so it is viewed at the same time as the specimen, but it is not part of the specimen.
- Always re-calibrate when the objective lens is changed — using a ×40 calibration at ×10 will give a measurement that is four times too large.
- The stage micrometer is a one-off reference used only for calibration; the specimen itself never sits on a stage micrometer during an actual measurement.
The image is an electron micrograph of a typical eukaryotic cell.
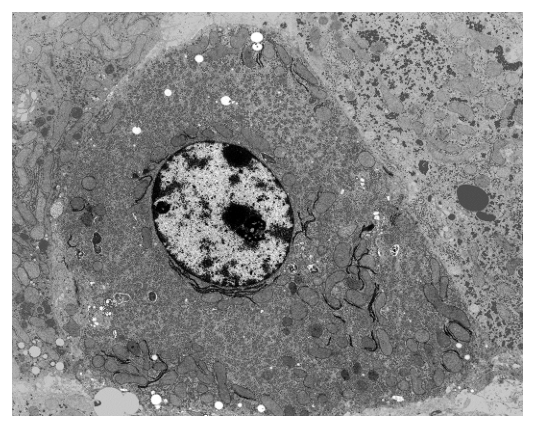
What can be concluded about the eukaryotic cell from the electron micrograph?
Options
A It is an animal cell because it does not have a cell wall.
B It is an animal cell because it contains a permanent vacuole.
C It is a plant cell because it contains many chloroplasts.
D It is a plant cell because it contains many lysosomes.
Working
The electron micrograph shows a cell with a large, dark nucleus (with a nucleolus), mitochondria, and endoplasmic reticulum. There is no thick cell wall around the perimeter, no chloroplasts, and no large permanent (sap) vacuole. The absence of a cell wall is the diagnostic feature identifying this as an animal cell.
Answer
A
A
Background Concept
Eukaryotic cells are divided into two broad categories that can usually be distinguished under the electron microscope by a small number of structural features:
- Plant cells possess a rigid cellulose cell wall on the outside of the plasma membrane, a large permanent (sap) vacuole that often occupies most of the cell volume, and chloroplasts (in photosynthetic tissues).
- Animal cells lack a cell wall, lack chloroplasts, and have only small, temporary vesicles — there is no large permanent vacuole.
Common features of both include a plasma membrane, a nucleus (with nucleolus), mitochondria, endoplasmic reticulum, ribosomes, and a Golgi apparatus. The presence or absence of a cell wall is the single most reliable criterion for telling a plant cell from an animal cell at the EM level.
Understanding the Question
The question asks what can be concluded about the cell from the electron micrograph in Fig. 2.1. The micrograph shows a single cell with a prominent dark nucleus containing a darker nucleolus, surrounded by cytoplasm packed with organelles (mitochondria and rough endoplasmic reticulum are clearly visible). Critically, the cell's outer boundary is a thin plasma membrane — there is no thick electron-dense wall outside it, and no chloroplasts or large central vacuole are visible.
The command word is concluded, meaning a deduction must be supported by something actually visible in the image. The options each pair a cell-type claim with a single supporting reason; the correct option is the one whose claim and reason are both consistent with the micrograph.
Approach
Examine the micrograph for the four diagnostic features (cell wall, chloroplasts, large permanent vacuole, lysosomes) and check each option against what is actually seen. Eliminate options whose claim is biologically inconsistent or whose stated reason contradicts what is visible.
Step-by-Step Reasoning
- Check the outer boundary. The cell's perimeter is a thin membrane; there is no thick, uniform, electron-dense layer outside the plasma membrane that would indicate a cellulose cell wall. This rules out a plant cell.
- Option A — "It is an animal cell because it does not have a cell wall." The absence of a cell wall is directly observable in the micrograph, and absence of a cell wall is a defining feature of animal cells. ✓
- Option B — "It is an animal cell because it contains a permanent vacuole." Animal cells do not contain a permanent (large central) vacuole; that is a plant-cell feature. The reason is biologically incorrect, even though the cell-type claim could be right. ✗
- Option C — "It is a plant cell because it contains many chloroplasts." No chloroplasts are visible in the micrograph (chloroplasts appear as large, membrane-bound organelles with internal thylakoid stacks — none are present). The reason is also false. ✗
- Option D — "It is a plant cell because it contains many lysosomes." Lysosomes are not a plant-cell feature, and they cannot be reliably identified at this magnification anyway. ✗
The only option that is both biologically correct and supported by the image is A.
Key Takeaways
- A cell wall is the defining structural difference between plant and animal cells and is easily recognised on an electron micrograph as a thick, uniform layer outside the plasma membrane.
- A permanent (large central) vacuole and chloroplasts are diagnostic of plant cells; their absence in the micrograph is consistent with an animal cell.
- When evaluating MCQ distractors, check BOTH the claim AND the reason given — a correct conclusion with a wrong reason (as in option B) is still a wrong answer.
Common Mistakes
- Choosing B because the cell "looks like" an animal cell: the reason cited (permanent vacuole) is a plant-cell feature, so the option is wrong even though the conclusion might be right.
- Choosing C or D on the assumption that "many X" must mean plant cell: chloroplasts are not visible in the image, and lysosomes are not plant-specific.
- Confusing lysosomes with other dark, membrane-bound organelles visible in EM images (e.g. peroxisomes, secretory vesicles).
Things to Be Careful About
- In an electron micrograph, look for the electron-dense layer outside the plasma membrane to identify a cell wall; a plasma membrane alone is not a wall.
- Do not infer the presence of an organelle that you cannot see; the question asks what can be concluded from the image.
- "Permanent vacuole" specifically means a large, sap-filled central vacuole — the small, temporary vesicles seen in animal cells are not permanent vacuoles.
Which features are found in typical eukaryotes and also in typical bacteria?
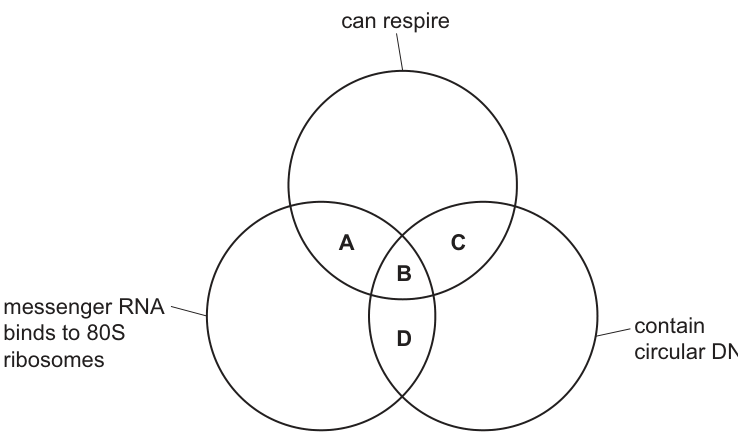
Options
A A
B B
C C
D D
Working
Typical bacteria: can respire; have 70S ribosomes (NOT 80S); have circular DNA.
Typical eukaryotes: can respire; have 80S ribosomes; have linear nuclear DNA but also contain circular DNA in mitochondria and chloroplasts.
Features shared by BOTH groups: respiration and the presence of circular DNA. The 80S-ribosome feature is restricted to eukaryotes and so must be excluded.
In the diagram, the region combining "can respire" with "contain circular DNA" but NOT "mRNA binds to 80S ribosomes" is region C.
Answer
C
C
Background Concept
All living cells carry out respiration to generate ATP, so "can respire" is a feature of every cell type. What separates typical eukaryotes from typical bacteria are mainly two structural features taught at AS Level:
- Ribosome size. Eukaryotic cytoplasmic ribosomes have a sedimentation coefficient of 80S; prokaryotic ribosomes are 70S. (The mitochondria and chloroplasts of eukaryotes actually contain 70S ribosomes, reflecting their endosymbiotic origin from bacteria, but the cell's overall translation machinery is 80S.)
- DNA shape. Bacterial DNA is a single, circular molecule lying free in the cytoplasm. Eukaryotic nuclear DNA is linear, packaged with histones into chromosomes. However, the small genomes inside mitochondria and chloroplasts are circular.
So the three circles in the Venn diagram correspond to:
- "can respire" — true of all cells
- "mRNA binds to 80S ribosomes" — true of typical eukaryotes only
- "contain circular DNA" — true of typical bacteria (whole genome) and of eukaryotes (in their mitochondria/chloroplasts)
Understanding the Question
The stem asks for the combination of features found in BOTH a typical eukaryote and a typical bacterium. The Venn diagram partitions all possible feature combinations into labelled regions A, B, C and D:
- A = can respire ∩ 80S ribosomes (not circular DNA)
- B = can respire ∩ 80S ribosomes ∩ circular DNA
- C = can respire ∩ circular DNA (not 80S ribosomes)
- D = 80S ribosomes ∩ circular DNA (not respire)
The correct region must contain only the features that are common to BOTH cell types, and must exclude any feature that is restricted to one group.
Approach
List which of the three features each cell type possesses, then locate the region of the Venn diagram that matches the intersection of the two lists. Anything present in only one group (such as 80S ribosomes, found only in eukaryotes) must lie OUTSIDE the chosen region.
Step-by-Step Reasoning
-
Bacterial features: can respire ✓, mRNA binds to 80S ribosomes ✗ (it binds to 70S), contain circular DNA ✓.
-
Eukaryotic features: can respire ✓, mRNA binds to 80S ribosomes ✓, contain circular DNA ✓ (in mitochondria/chloroplasts — the cell does contain circular DNA even though the nucleus does not).
-
Intersection (features in BOTH): can respire AND contain circular DNA. The 80S-ribosome feature is in eukaryotes only, so it is NOT part of the shared set and must be excluded from the correct region.
-
Map onto the Venn diagram: the area that contains "can respire" and "contain circular DNA" but lies OUTSIDE the "mRNA binds to 80S ribosomes" circle is region C.
-
Eliminate the other options:
- A (can respire + 80S) — bacteria lack 80S ribosomes, so this combination is eukaryote-only.
- B (all three) — no cell has all three together; 80S and circular DNA belong to different domains.
- D (80S + circular DNA, no respiration) — every living cell respires, so excluding respiration is impossible.
Only C describes a feature combination that fits both groups simultaneously.
Key Takeaways
- Respiration is universal to all cells.
- The classic eukaryote–prokaryote contrast rests on ribosome size (80S vs 70S) and DNA topology (linear vs circular), with the caveat that eukaryotic organelles retain prokaryote-like features.
- A Venn-diagram question of this type asks for the INTERSECTION of two lists of features; any feature unique to one group must lie outside the chosen region.
Common Mistakes
- Choosing A because respiration is shared, without noticing that 80S ribosomes are not a feature of bacteria.
- Choosing B, forgetting that no single cell group has all three features at once.
- Believing eukaryotes have NO circular DNA and so dismissing C — mitochondria and chloroplasts contain circular DNA, so the statement "contain circular DNA" is true of eukaryotes as well as bacteria.
- Confusing 70S with 80S ribosomes (a very common slip).
Things to Be Careful About
- The wording of the ribosome circle is "mRNA binds to 80S ribosomes" — this is the EUKARYOTIC cytoplasmic translation machinery, not the organelle 70S ribosomes. A bacterium lacks 80S ribosomes entirely.
- "Contain circular DNA" is true of both groups: a bacterium contains a circular chromosome, and a eukaryotic cell contains circular DNA inside its mitochondria and chloroplasts.
- Read the Venn diagram carefully: A, B, C and D label specific overlap regions, not the circles themselves.
Which type of cell will have the highest proportion of its volume taken up with cell structures bound by a single membrane?
Options
A ciliated epithelial cell
B goblet cell
C red blood cell
D companion cell
Working
-
Single-membrane-bound organelles include the endoplasmic reticulum (ER), Golgi apparatus, lysosomes and secretory vesicles.
-
Double-membrane-bound organelles include the nucleus, mitochondria and chloroplasts.
-
A goblet cell is specialised for secreting mucin (a glycoprotein). Its cytoplasm is dominated by:
- abundant rough ER (single-membrane-bound), for synthesising the protein core of mucin,
- a large Golgi apparatus (single-membrane-bound), for glycosylating and packaging the mucin,
- and many secretory vesicles (single-membrane-bound) filled with mucin, often occupying much of the apical cytoplasm.
-
This makes the proportion of the cell's volume occupied by single-membrane-bound structures very high.
-
A red blood cell (mammalian) has lost its nucleus and most other organelles, so it has very few membrane-bound structures.
-
A ciliated epithelial cell has many cilia (projections of the plasma membrane) and many mitochondria (double-membrane), not predominantly single-membrane organelles.
-
A companion cell has typical plant-cell organelles (nucleus, mitochondria, etc.) but is not dominated by single-membrane structures.
Answer
B
B
Background Concept
Eukaryotic organelles can be sorted by how many membranes surround them:
- Single-membrane-bound organelles: endoplasmic reticulum (ER), Golgi apparatus, lysosomes, peroxisomes, transport vesicles, secretory vesicles, vacuoles, the plasma membrane itself.
- Double-membrane-bound organelles: nucleus, mitochondria, chloroplasts (in plant cells).
- Non-membrane-bound structures: ribosomes, cytoskeleton, the cell wall (in plants).
Many cells in the body are highly specialised, and that specialisation is reflected in which organelles dominate their cytoplasm. A cell that synthesises and secretes large amounts of protein, for example, will be packed with rough ER and Golgi apparatus — both single-membrane structures — because these are the organelles responsible for protein synthesis, post-translational modification, and packaging for export.
Understanding the Question
The command word is implicit, but the question is essentially asking: which of these four cell types is dominated by organelles that have only one membrane around them? To answer, two things are needed:
- Recognition of which organelles in each cell are single-membrane-bound.
- A judgement about which cell has the highest proportion of its volume occupied by those structures.
Note that the question specifies "proportion of its volume" — not absolute volume. A large cell with many single-membrane organelles might still have a lower proportion than a smaller cell that is essentially stuffed with them.
Approach
- Decide which of the listed organelles are single-membrane in each cell type.
- Estimate what fraction of each cell's volume is taken up by those single-membrane structures.
- The cell with the largest fraction wins.
Step-by-Step Reasoning
Option A — ciliated epithelial cell. These line the airways and are covered with cilia at their apical surface. Cilia are not separate membrane-bound organelles; they are extensions of the plasma membrane supported by a microtubule cytoskeleton (the axoneme, 9+2 arrangement). A ciliated cell also has many mitochondria near the base of the cilia to supply ATP for ciliary beating — but mitochondria are double-membrane bound, so they do not count for this question. The cell also has a normal complement of ER and Golgi, but these are not the dominant feature. Proportion of single-membrane structures: modest.
Option B — goblet cell. Goblet cells are highly specialised secretory cells. Their job is to manufacture and release mucin, the main glycoprotein component of mucus. To do this, they contain:
- A large rough endoplasmic reticulum (single membrane) where the mucin protein is synthesised.
- A prominent Golgi apparatus (single membrane) where the protein is glycosylated and packed into vesicles.
- Numerous mucigen (secretory) vesicles (single membrane) that accumulate in the apical cytoplasm, often making that region appear pale and distended in histological sections.
Together, these single-membrane-bound structures typically dominate the cytoplasm of the cell. Proportion of single-membrane structures: very high.
Option C — red blood cell. A mature mammalian red blood cell is unusual: it ejects its nucleus during development and also lacks mitochondria, ER, Golgi apparatus, and most other organelles. Its interior is essentially filled with haemoglobin. It therefore has almost no membrane-bound organelles at all, single or double. Proportion of single-membrane structures: negligible.
Option D — companion cell. Companion cells are found in phloem tissue alongside sieve tube elements. They have a nucleus, mitochondria, ribosomes, ER, and a few plasmodesmata connecting them to their sieve tube. They are metabolically active, but their organelle complement is typical of a plant cell — not dominated by single-membrane structures. Proportion of single-membrane structures: moderate.
The comparison therefore points firmly to B, the goblet cell, whose very function (massive secretion of a glycoprotein product) requires the cell to be almost entirely built out of ER, Golgi, and secretory vesicles — all single-membrane organelles.
Key Takeaways
- Single-membrane-bound organelles include the ER, Golgi, lysosomes, and secretory vesicles; double-membrane-bound organelles include the nucleus, mitochondria, and chloroplasts.
- A cell's ultrastructure reflects its function. Cells specialised for secretion (goblet cells, plasma cells, pancreatic acinar cells) are packed with single-membrane-bound ER, Golgi, and vesicles.
- Cilia and microvilli are projections of the plasma membrane, not separate membrane-bound organelles, so they do not count as "cell structures bound by a single membrane" in this sense.
- Mature mammalian red blood cells are the extreme opposite case: almost no membrane-bound organelles at all.
Common Mistakes
- Choosing A because ciliated cells look busy under the microscope. Cilia themselves are not membrane-bound organelles (they are membrane extensions around a microtubule core), and the abundant mitochondria are double-membrane-bound, so the proportion of single-membrane structures is not as high as it might seem.
- Choosing D because companion cells "have lots of organelles". They do, but the dominant ones include the nucleus and mitochondria (double-membrane), not single-membrane structures.
- Forgetting that C (red blood cells) lose nearly all their organelles during maturation; the cell is dominated by haemoglobin, not membranes.
- Confusing the plasma membrane (which is a single membrane, but is universal to all cells and not what the question means) with internal single-membrane organelles.
Things to Be Careful About
- Read the question precisely: it asks for the highest proportion of cell structures bound by a single membrane. That is a volume-fraction question, not a "which cell has the most organelles" question.
- Distinguish between single- and double-membrane-bound organelles confidently — this is a recurring theme in Paper 1.
- Cilia, flagella, microvilli and the cell wall do not qualify as "single-membrane-bound cell structures" in the sense the syllabus uses; they are either membrane extensions or non-membrane features.
What causes the phosphate heads of phospholipids to become polar?
Options
A The phosphate heads are joined to water molecules by hydrogen bonds.
B The phosphate heads are insoluble in water.
C The phosphate heads become ionised in water.
D The phosphate heads are joined to water molecules by covalent bonds.
Working
The phosphate group of a phospholipid has ionisable groups (e.g. –OH groups on the phosphate). In water, these groups dissociate to form negatively charged ions (e.g. –O⁻), giving the head a net charge. Charged/polar molecules are attracted to water, so the head becomes hydrophilic. The non-polar fatty acid tails remain hydrophobic.
Answer
C
C
Background Concept
A phospholipid is built from a glycerol backbone, two fatty acid (hydrocarbon) tails, and a phosphate group (often with an additional polar group attached, e.g. choline, serine, or ethanolamine). The fatty acid tails are non-polar and therefore hydrophobic ('water-fearing'), whereas the phosphate head is polar and hydrophilic ('water-loving'). This dual character — amphipathic — is what allows phospholipids to spontaneously form bilayers in aqueous environments, the structural basis of all cell membranes (the fluid mosaic model).
The key question is why the phosphate head is polar. Polarity, in chemical terms, means the presence of regions of unequal electrical charge (a dipole or full charges). For a molecule to interact favourably with water, it must possess such polar or charged groups. In the case of the phosphate head, the phosphate group contains –OH groups that can donate protons (H⁺) to the surrounding water. When this happens:
The head thus becomes ionised (carries a net negative charge), making it strongly polar and therefore hydrophilic.
Understanding the Question
The question is a one-mark multiple-choice item asking for the cause of polarity in the phosphate head of a phospholipid. The four options each propose a different explanation: hydrogen bonding, insolubility, ionisation, or covalent bonding. Only one of these correctly describes the underlying chemistry.
Approach
Recall that 'polar' in a biological context usually means the group carries (full or partial) electrical charges that can interact with the partial charges on water molecules. For the phosphate head, this is achieved through ionisation in water — the head loses protons and becomes negatively charged, attracting the δ⁺ hydrogens of water. This eliminates the other options:
- Hydrogen bonding (A) is a consequence of polarity, not its cause. Polar molecules hydrogen-bond with water because they are already polar, not the other way round.
- Insolubility (B) is a property of the hydrophobic tails, not the polar head.
- Covalent bonding (D) to water would describe hydrolysis, not the source of polarity.
Step-by-Step Reasoning
- The phosphate head must be polar to interact with water and form the bilayer interface.
- Polarity arises from the unequal distribution of charge.
- In the phosphate group, the –OH groups dissociate in water, releasing H⁺ ions.
- The resulting –O⁻ group carries a net negative charge → the head is ionised.
- Ionisation produces the charge that makes the head hydrophilic; this is the correct biological explanation.
- The other options describe effects of polarity (A) or unrelated/inaccurate chemistry (B, D).
Key Takeaways
- The phosphate head of a phospholipid is polar because it ionises in water, forming charged groups.
- Polar/charged groups are hydrophilic; non-polar hydrocarbon tails are hydrophobic.
- The amphipathic nature of phospholipids is what drives bilayer formation in cell membranes.
Common Mistakes
- Choosing A (hydrogen bonding): confusing cause and effect — polarity enables hydrogen bonding, not the other way around.
- Choosing B (insoluble in water): the tails are insoluble; the heads are soluble precisely because they are polar.
- Choosing D (covalent bonds to water): a covalent bond would chemically alter the phospholipid; the actual interaction is electrostatic (ionic/hydrogen bonding) with intact water molecules.
Things to Be Careful About
- 'Polar' in biology frequently equates to 'carries a charge' (full or partial) — it is not the same as 'forms hydrogen bonds'.
- The head is described as hydrophilic because it is attracted to water, not because it is joined to water by bonds (whether H-bonds or covalent).
- The negative charge on the ionised head is also why phospholipid bilayers repel each other and remain as discrete structures rather than fusing indiscriminately — a point that is often tested elsewhere.
Which statements describe features of cellulose that adapt it for its function in plant cells?
1 Three cellulose molecules coil around each other to form a triple helix structure.
2 Many hydrogen bonds form between adjacent cellulose molecules.
3 Covalent bonds form between adjacent cellulose molecules.
Options
A 1, 2 and 3
B 1 and 3 only
C 2 and 3 only
D 2 only
Working
Statement 1 is incorrect — cellulose molecules do not coil to form a triple helix; that description applies to collagen.
Statement 2 is correct — many hydrogen bonds form between adjacent parallel cellulose molecules, holding the microfibrils together and giving cellulose its tensile strength.
Statement 3 is incorrect — adjacent cellulose molecules are linked by hydrogen bonds, not covalent bonds.
Only statement 2 is correct.
Answer
D
D
Background Concept
Cellulose is the main structural polysaccharide of plant cell walls. It is a polymer of -glucose monomers linked by -1,4-glycosidic bonds. A key consequence of the configuration is that every alternate glucose molecule is rotated by 180°, so the polymer chain is straight (rather than helical as in starch). Many straight cellulose chains are laid parallel to one another, and the –OH groups on each chain form large numbers of hydrogen bonds with –OH groups on neighbouring chains. These hydrogen bonds hold the chains together in bundles called microfibrils, giving cellulose its high tensile strength — exactly the property a plant cell wall needs to resist the turgor pressure of the cell and to provide rigid mechanical support.
It is important not to confuse cellulose with collagen. Collagen is a protein whose three polypeptide chains do wind around one another to form a triple helix — but that is unrelated to cellulose.
Understanding the Question
The question is a multiple-choice statement-evaluation item. Three statements about the structure of cellulose are offered, and the candidate must decide which are correct features that suit cellulose to its structural role in plant cells. Only one option (D, “2 only”) is consistent with the actual structure of cellulose.
Approach
Test each statement against the known structure of cellulose:
- Does cellulose form a triple helix? No — collagen does, but cellulose chains are straight.
- Are adjacent cellulose molecules held together by many hydrogen bonds? Yes — this is what gives the microfibril its strength.
- Are adjacent cellulose molecules covalently bonded to each other? No — they are linked only by hydrogen bonds.
Therefore only statement 2 is correct, giving option D.
Step-by-Step Reasoning
-
Statement 1: “Three cellulose molecules coil around each other to form a triple helix structure.” This is a description of the secondary structure of collagen, not cellulose. Cellulose chains are unrotated (straight) and pack side by side; they do not coil around one another. Reject statement 1.
-
Statement 2: “Many hydrogen bonds form between adjacent cellulose molecules.” Correct. The hydroxyl (–OH) groups projecting from one cellulose chain hydrogen-bond to –OH groups on the next chain. Because each chain has many –OH groups, many hydrogen bonds form, producing a strong microfibril. Accept statement 2.
-
Statement 3: “Covalent bonds form between adjacent cellulose molecules.” Incorrect. Within a single cellulose chain, monomers are joined by covalent -1,4-glycosidic bonds, but between chains the linkage is hydrogen bonding only. There are no covalent bonds between adjacent cellulose molecules. Reject statement 3.
Only statement 2 is correct, so the answer is D (2 only).
Key Takeaways
- Cellulose is a straight-chain polymer of -glucose with -1,4-glycosidic bonds; the geometry forces alternate monomers to flip by 180°.
- Cellulose’s strength comes from hydrogen bonding between adjacent parallel chains, forming microfibrils.
- “Triple helix” describes collagen, a protein — not cellulose.
- Covalent bonds (glycosidic) hold the monomers within a cellulose chain; hydrogen bonds hold the chains to one another.
Common Mistakes
- Confusing cellulose with collagen because both are structural molecules. Collagen’s three-polypeptide triple helix is a frequent distractor.
- Assuming structural strength implies covalent cross-linking. In cellulose the strength is purely from hydrogen bonds, which are individually weak but collectively very strong when present in large numbers.
- Confusing inter-chain linkages in cellulose with the covalent glycosidic bonds that join monomers within a chain.
Things to Be Careful About
- Read each statement carefully: only adjacent molecules, not the monomers within a single chain, are being discussed.
- “Many” hydrogen bonds is the key phrase — a single hydrogen bond is weak, but collectively they confer great tensile strength.
- Distractors frequently combine features of different biomolecules (e.g. collagen’s triple helix applied to cellulose); always test each feature against the specific molecule named in the question.
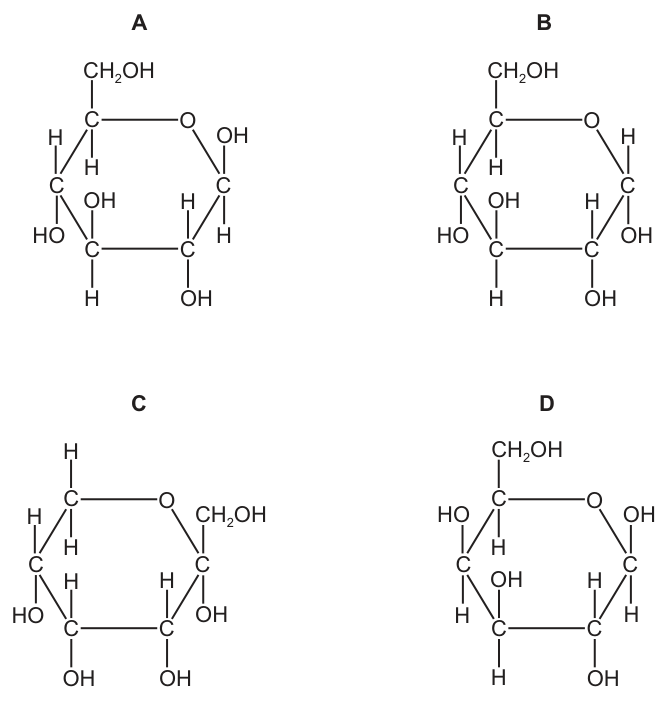
Which structure shows -glucose?
Options
Answer
α-D-glucose has the –OH on C1 (the anomeric carbon) on the opposite side of the ring from the –CH₂OH on C5. In the standard Haworth projection, with the –CH₂OH on C5 pointing up, the –OH on C1 points down for the α-anomer.
Structure B shows the C1 –OH below the ring plane while the C5 –CH₂OH is above the ring plane — this is the α-configuration.
- A: β-D-glucose (C1 –OH above the ring, same side as the C5 –CH₂OH)
- C: not a glucose — the –CH₂OH is on C4, not C5, so the carbon skeleton is wrong
- D: a different sugar isomer — the –OH orientations on C2/C3/C4 do not match D-glucose
B
B
Background Concept
Glucose is a hexose (6-carbon) sugar that, in aqueous solution, cyclises to form a six-membered ring containing five carbons and one oxygen — a pyranose ring. The ring forms when the –OH on C5 attacks the aldehyde carbon (C1), producing a new chiral centre at C1 called the anomeric carbon.
Because C1 is now chiral, two stereoisomers (anomers) are possible:
- α-D-glucose — the –OH on C1 lies on the opposite side of the ring from the –CH₂OH on C5 (trans).
- β-D-glucose — the –OH on C1 lies on the same side of the ring as the –CH₂OH on C5 (cis).
These are drawn as Haworth projections, where the ring is shown flat with substituents either above (up) or below (down) the plane. The convention is that the –CH₂OH on C5 is drawn pointing up for D-sugars. The α- and β-anomers interconvert in solution via the open-chain form — a process called mutarotation.
This distinction matters biologically: α-glucose is the monomer of starch and glycogen (linked by α-1,4-glycosidic bonds), while β-glucose is the monomer of cellulose (linked by β-1,4-glycosidic bonds). Humans can digest α- but not β-linkages, because we lack the enzyme cellulase.
Understanding the Question
The question shows four pyranose-ring structures (A, B, C, D) and asks which one is α-glucose. You must:
- Identify the anomeric carbon (C1, next to the ring oxygen).
- Check the position of the –CH₂OH group to confirm the correct carbon numbering (it should be on C5, adjacent to the ring oxygen on the opposite side from C1).
- Compare the position of the –OH on C1 with the position of the –CH₂OH on C5: opposite sides = α; same side = β.
Approach
Apply the α/β rule: in a Haworth projection of a D-pyranose, the α-anomer has the C1 –OH on the opposite face of the ring from the C5 –CH₂OH. Eliminate any structure with incorrect carbon numbering first, then apply the α/β rule to the remaining candidates.
Step-by-Step Reasoning
- C is eliminated immediately: the –CH₂OH is attached to C4, not C5. This is not a glucose at all — the ring numbering is wrong, so it cannot be α-glucose.
- D is eliminated: although the –CH₂OH is correctly on C5, the orientations of the –OH groups on C2, C3 and C4 do not match D-glucose (e.g., the –OH on C4 is up instead of down). D is a different sugar isomer (e.g., galactose or another epimer), not α-D-glucose.
- A vs B: both have the –CH₂OH on C5 and the correct –OH orientations on C2, C3 and C4 for D-glucose. The only difference is the C1 –OH.
- In A, the C1 –OH is on the same side as the C5 –CH₂OH (both up) → this is the β-anomer.
- In B, the C1 –OH is on the opposite side from the C5 –CH₂OH (C1 –OH down, C5 –CH₂OH up) → this is the α-anomer.
- Therefore, B is α-D-glucose.
Key Takeaways
- The α/β designation refers to the configuration at the anomeric carbon (C1 in glucose).
- In a Haworth projection: α = C1 –OH opposite the C5 –CH₂OH; β = C1 –OH same side as the C5 –CH₂OH.
- α-glucose → starch and glycogen (α-1,4 linkages); β-glucose → cellulose (β-1,4 linkages).
- Always check the carbon numbering first — the –CH₂OH must be on C5 for it to be a glucose.
Common Mistakes
- Confusing α and β: remember that the C1 –OH is below the ring in α-D-glucose when drawn in the standard Haworth projection (CH₂OH up on C5).
- Choosing a structure with the wrong carbon skeleton (e.g., C) without noticing that the –CH₂OH is on the wrong carbon.
- Assuming any pyranose with an –OH down on C1 is automatically α-glucose — the other –OH groups must also match D-glucose, otherwise it is a different sugar (as in D).
Things to Be Careful About
- The Haworth projection is a 2D representation; the ring is not actually flat, but the up/down convention is standard and must be applied consistently.
- The –CH₂OH on C5 and the C1 –OH are the two reference groups for assigning α vs β — ignore the other –OH groups when making this distinction.
- For a sugar to be D-glucose (and not, say, D-galactose or D-mannose), the –OH on C2 must be down, on C3 up, and on C4 down in the Haworth projection.
What cannot occur as a result of a condensation reaction?
Options
A breaking of a glycosidic bond
B formation of a disaccharide
C joining together of two amino acids
D production of a molecule of water
Working
A condensation reaction joins two monomers together with the release of a water molecule, forming a new covalent bond. The reverse — breaking a bond using a water molecule — is a hydrolysis reaction, not a condensation reaction.
- B (formation of a disaccharide): two monosaccharides join via a glycosidic bond, releasing water — this IS a condensation.
- C (joining together of two amino acids): a peptide bond forms between two amino acids, releasing water — this IS a condensation.
- D (production of a molecule of water): water is released every time a condensation bond forms — this IS a consequence of condensation.
- A (breaking of a glycosidic bond): breaking a glycosidic bond requires the addition of a water molecule, so this is a hydrolysis reaction, not a condensation.
Answer
A
A
Background Concept
Biological molecules are built up from smaller subunits (monomers) joined into long chains (polymers). The two opposite reactions that link or separate these subunits are condensation and hydrolysis.
- A condensation reaction joins two molecules together by forming a new covalent bond, with the simultaneous removal (release) of a water molecule (one H comes from one monomer, the OH from the other). Examples include the formation of glycosidic bonds between sugars, peptide bonds between amino acids, phosphodiester bonds between nucleotides, and ester bonds between glycerol and fatty acids.
- A hydrolysis reaction is the exact opposite: a water molecule is added across a covalent bond, breaking that bond and separating the two monomers. The H and OH of water are split, with one going to each product.
Because of this, anything that requires the consumption of water to break a bond cannot be a condensation — it must be hydrolysis.
Understanding the Question
The stem asks which of the four options cannot be a result of a condensation reaction. So the correct answer is the option that describes a hydrolysis process (or something inconsistent with condensation). The command word is implicit: select the option that does NOT fit a condensation.
Approach
Test each option against the definition of condensation: joins molecules + releases water. If an option describes joining with water release, it is consistent with condensation. If it describes water being used to break something apart, it is hydrolysis and is the answer.
Step-by-Step Reasoning
- Option B — formation of a disaccharide. Two monosaccharides (e.g. glucose + glucose) combine, releasing water, and a glycosidic bond forms. This is the textbook example of a condensation reaction. ✓ Consistent.
- Option C — joining together of two amino acids. Two amino acids condense, releasing water, to form a peptide (dipeptide) bond. This is also a condensation. ✓ Consistent.
- Option D — production of a molecule of water. Water is one of the products of every condensation, so this is an inevitable consequence. ✓ Consistent.
- Option A — breaking of a glycosidic bond. Breaking any covalent bond between two monomers requires the addition of water (hydrolysis), not its release. This is the opposite of condensation. ✗ Not a condensation.
Therefore A is the option that cannot occur as a result of a condensation reaction.
Key Takeaways
- Condensation = join monomers + release water.
- Hydrolysis = break bond + consume water (the reverse).
- The same type of bond (glycosidic, peptide, phosphodiester, ester) can be formed by condensation and broken by hydrolysis — remembering the direction is what matters.
- Whenever an option mentions a bond breaking with water added, that is hydrolysis, not condensation.
Common Mistakes
- Choosing D because water "appears" in the reaction. Water is a product of condensation, not a reactant — its production is therefore a defining feature, not a contradiction.
- Choosing B or C because they "sound" like the same type of reaction. Both genuinely are condensations, so they must be ruled out.
- Confusing condensation with hydrolysis. If a question mentions breaking a bond plus water, it is hydrolysis; if it mentions forming a bond plus water, it is condensation.
Things to Be Careful About
- The question is about what cannot be a result of condensation — read the stem carefully before eliminating options.
- "Breaking of a glycosidic bond" is the precise wording of a hydrolytic process; do not let familiar terms like "condensation" or "dehydration" drift your answer.
- All three "wrong" options (B, C, D) are individually correct consequences of a condensation, which is exactly why A stands out as the only impossible one.
Which fact about the quaternary structure of proteins is correct?
Options
A consists of four polypeptides
B depends on the presence of metal ions
C depends on the primary structure of the polypeptides
D is made of and polypeptides
Working
Quaternary structure is the arrangement of two or more polypeptide subunits within a protein. It depends on how each individual polypeptide folds and interacts with the others, and that folding is determined by the amino-acid sequence — i.e. the primary structure of each chain.
- A is wrong: the number of polypeptides varies (insulin has 2, haemoglobin has 4, some proteins have many more). "Four" is not a defining feature.
- B is wrong: metal ions (e.g. Fe²⁺ in haemoglobin) are a feature of some specific proteins but are not required for quaternary structure in general.
- C is correct: the primary structure (amino-acid sequence) of each polypeptide determines how it folds into its tertiary structure, and therefore how the subunits assemble into the quaternary structure.
- D is wrong: α and β are merely the names given to the two types of globin chain in haemoglobin; quaternary structure is not defined as being made of α and β polypeptides.
Answer
C
C
Background Concept
Proteins have four levels of structural organisation, often called the levels of protein structure:
- Primary structure — the linear sequence of amino acids joined by peptide bonds. This sequence is encoded by the gene and determines everything that follows.
- Secondary structure — regular local folding into α-helices and β-pleated sheets, stabilised by hydrogen bonds between the backbone N–H and C=O groups.
- Tertiary structure — the overall 3-D folding of a single polypeptide chain, stabilised by interactions between R-groups (hydrogen bonds, ionic bonds, disulfide bridges and hydrophobic interactions).
- Quaternary structure — the arrangement of two or more polypeptide subunits (each already folded into its tertiary structure) in a multi-subunit protein. Examples include haemoglobin (4 chains), insulin (2 chains), and collagen (3 chains).
The key principle is that each level of structure depends on the previous one. The primary sequence dictates the secondary folding, which dictates the tertiary shape, which in turn dictates how multiple chains pack together in the quaternary structure.
Understanding the Question
This is a multiple-choice question asking which single statement about quaternary structure is true. The candidate must recall what quaternary structure is, what determines it, and the common misconceptions.
Approach
The most reliable test for a "which is correct" MCQ is to apply the strict definition of quaternary structure and the principle that each level of protein structure depends on the previous one. Anything that quantifies the number of subunits (A), names a specific feature of one particular protein (B, D), or breaks the dependency rule, can be ruled out.
Step-by-Step Reasoning
- Define quaternary structure — it is the association of two or more folded polypeptide chains into a functional protein. It is not a separate feature added on top; it emerges from how the individual chains fold and recognise each other.
- Evaluate A — "consists of four polypeptides". Some well-known quaternary proteins do have four chains (e.g. haemoglobin), but many do not: insulin has 2, collagen has 3, many enzymes have 6, 8 or more subunits. "Four" is not a general requirement, so A is wrong.
- Evaluate B — "depends on the presence of metal ions". Some proteins use metal ions as cofactors (haemoglobin uses Fe²⁺ in haem, many enzymes use Mg²⁺, Zn²⁺, etc.), but the quaternary structure itself is held together by the same R-group interactions that stabilise tertiary structure. Metal ions are not a general requirement, so B is wrong.
- Evaluate C — "depends on the primary structure of the polypeptides". This is correct. The primary amino-acid sequence determines the R-groups, which determine the secondary and tertiary folding, which determines how the chains fit together. A single amino-acid substitution in haemoglobin (glutamate → valine at position 6 of the β chain) is enough to cause sickle-cell disease because the quaternary assembly is altered. This is a classic illustration of how the primary sequence underlies the quaternary structure.
- Evaluate D — "is made of α and β polypeptides". In haemoglobin, the four globin chains happen to be called α and β. This terminology describes a specific protein, not a general feature of quaternary structure. Many quaternary proteins do not contain "α" and "β" chains at all (e.g. insulin's A and B chains are named differently, immunoglobulins have heavy and light chains, etc.). D is wrong.
Key Takeaways
- Quaternary structure is the assembly of two or more polypeptide chains, not a fixed number of four.
- Each level of protein structure depends on the previous one: primary → secondary → tertiary → quaternary.
- Common confusions arise from generalising features of well-known proteins (haemoglobin) to all proteins with quaternary structure.
Common Mistakes
- Choosing A because haemoglobin has four chains — this is a textbook example but not a general rule.
- Choosing B because some proteins use metal ions — cofactors are not part of the structural definition.
- Choosing D because the α and β chain labels are memorable from the haemoglobin example — these are protein-specific names, not a structural feature.
- Confusing quaternary with tertiary structure — tertiary is one chain folded; quaternary is many chains assembled.
Things to Be Careful About
- "α and β" in option D refers to the chain names in haemoglobin, not to α-helices and β-sheets (which are secondary structure features).
- A single amino-acid change can disrupt quaternary structure, which is direct evidence that quaternary structure depends on the primary structure — keep this example ready for any "explain why" follow-up.
The diagram shows different molecules in a solution.
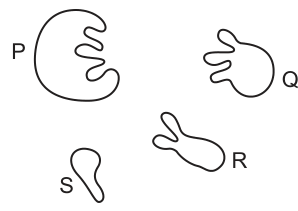
Which statement could explain what happens when some of the molecules are mixed together?
Options
A Molecule P forms an enzyme–substrate complex with the non-competitive inhibitor molecule Q.
B Molecule Q binds to molecule P, increasing the activation energy.
C Molecules R and S bind to the active site of molecule P.
D Molecules S and R are the products of the breakdown of molecule P.
Working
Molecule P is a large molecule with an indentation (the active site). Molecules R and S together have shapes complementary to this indentation, so they fit into the active site — they act as substrates binding to P. Molecule Q has a shape complementary to a different region of P, so Q would be a non-competitive inhibitor, not a substrate.
- A: Q is a non-competitive inhibitor and so does not form an enzyme–substrate complex. ✗
- B: A non-competitive inhibitor does not bind at the active site; it changes the active-site shape rather than simply increasing activation energy. ✗
- C: R and S together fit the active site of P — they are substrates binding at the active site. ✓
- D: P is the enzyme; enzymes are not broken down into products during a reaction. R and S are substrates, not products of P. ✗
Answer
C
C
Background Concept
Enzymes are biological catalysts — usually proteins — that speed up reactions by lowering the activation energy. Each enzyme has an active site, a region with a specific three-dimensional shape into which the substrate binds, forming an enzyme–substrate (ES) complex. The two classical models describe this fit:
- Lock-and-key: substrate and active site are exact complementary shapes.
- Induced-fit: the active site moulds itself around the substrate as it binds.
Inhibitors reduce enzyme activity:
- A competitive inhibitor has a shape similar to the substrate and binds to the active site, blocking substrate entry. It effectively raises the apparent activation energy by reducing productive collisions.
- A non-competitive inhibitor binds to a site other than the active site (an allosteric site), changing the shape of the active site so the substrate can no longer bind effectively.
Enzymes themselves are not consumed or broken down during the reaction — they emerge unchanged and can catalyse further reactions. The molecules produced when the substrate is converted are called products.
Understanding the Question
The diagram shows:
- P: a large molecule with a distinctive indentation (the active site of an enzyme).
- Q: a molecule whose shape fits a different region of P (not the active site).
- R and S: smaller molecules whose combined shapes appear complementary to P's active site.
The question asks which statement correctly describes what happens when some of these molecules interact. We must match each molecule's role (enzyme, substrate, inhibitor) to the visual evidence and to the precise meaning of the four options.
Approach
- Identify P as the enzyme (it has the active site).
- Identify Q from its shape as a potential non-competitive inhibitor (binds away from the active site).
- Identify R and S as substrates — their combined shapes fit the active site, so they bind there to form the ES complex.
- Eliminate options that misassign the role of Q, misuse the term "enzyme–substrate complex", or claim P is broken down.
Step-by-Step Reasoning
Option A — "P forms an enzyme–substrate complex with the non-competitive inhibitor Q."
The term enzyme–substrate complex by definition involves a substrate, not an inhibitor. Q is an inhibitor (it binds to a region of P outside the active site), so calling the P–Q combination an "enzyme–substrate complex" is biologically wrong. Rejected.
Option B — "Q binds to P, increasing the activation energy."
Although Q does bind to P, a non-competitive inhibitor does not primarily work by raising the activation energy in the textbook sense; it works by altering the active-site shape so the substrate cannot bind (or does so poorly). The wording is misleading. Rejected.
Option C — "R and S bind to the active site of P."
R and S together are the right shape to fit the active site of P, so they can occupy it together as the substrate (or as two substrate molecules, one after the other, occupying the active site). This is exactly what substrates do. Correct.
Option D — "S and R are the products of the breakdown of P."
P is the enzyme. Enzymes are not broken down in the reactions they catalyse. R and S, with shapes complementary to the active site, are far more likely to be substrates than products. Rejected.
Key Takeaways
- The active site is a specific shaped region of an enzyme; only molecules with a complementary shape bind there (substrates).
- Molecules that bind elsewhere on the enzyme are non-competitive inhibitors and do not form an enzyme–substrate complex.
- Enzymes are not consumed in the reactions they catalyse; they are released unchanged after converting substrate to product.
- When interpreting a diagram, the location of binding (active site vs elsewhere) is the key to distinguishing substrate from inhibitor.
Common Mistakes
- Calling any molecule that binds the enzyme a "substrate" — inhibitors also bind, but they are not substrates and do not form an ES complex.
- Assuming an inhibitor that fits the enzyme must bind the active site — non-competitive inhibitors specifically bind elsewhere.
- Confusing "activation energy" language: a non-competitive inhibitor is better described as changing the active-site shape, not as raising activation energy (that description fits a competitive inhibitor more closely).
- Thinking enzymes are used up in the reaction — they are catalysts and are recycled.
Things to Be Careful About
- Read the precise wording of each option. A is wrong mainly because of the phrase "enzyme–substrate complex with the inhibitor" — a small but critical error.
- Match the visual: the only molecules whose shape is clearly complementary to P's active site are R and S, not Q.
- Distinguish lock-and-key (fixed shape complementarity) from induced-fit (active site moulds to substrate) — both are compatible with option C.
The effect of substrate concentration on an enzyme-catalysed reaction was measured in three different conditions:
● without an inhibitor
● with a competitive inhibitor
● with a non-competitive inhibitor.
The graph shows the results.
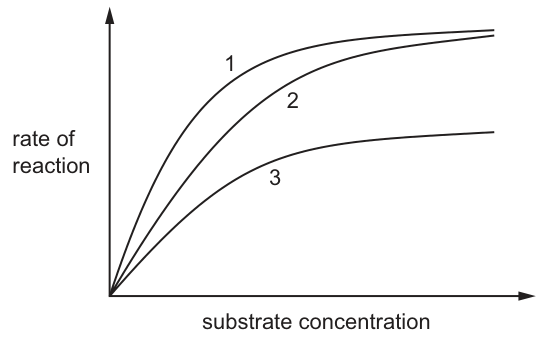
Which row is correct?
Options
| without an inhibitor | with a competitive inhibitor | with a non-competitive inhibitor | |
|---|---|---|---|
| A | 1 | 2 | 3 |
| B | 1 | 3 | 2 |
| C | 3 | 1 | 2 |
| D | 3 | 2 | 1 |
Working
Without inhibitor: rate rises steeply and reaches the highest plateau (normal ). This is curve 1.
With a competitive inhibitor: inhibitor competes with substrate for the active site, so more substrate is needed to reach the same rate, but is unchanged. The curve is shallower at low [S] but approaches the same plateau as curve 1. This is curve 2.
With a non-competitive inhibitor: inhibitor binds to a site other than the active site and effectively reduces the number of functional enzyme molecules, so a lower is reached that cannot be overcome by adding more substrate. This is curve 3 (lowest plateau).
Answer
A
A
Background Concept
Enzyme-catalysed reactions show a characteristic curve when reaction rate is plotted against substrate concentration:
- At low substrate concentration the active sites are not saturated, so rate rises steeply and almost linearly with [S].
- As [S] increases, the active sites become increasingly occupied, and the rate levels off as the enzyme approaches saturation. The maximum rate achievable at high [S] is .
- The substrate concentration giving half is the Michaelis constant , a measure of the enzyme's affinity for its substrate (low = high affinity).
Inhibitors alter this curve in two distinct ways:
- A competitive inhibitor has a shape similar to the substrate and binds reversibly to the active site. It therefore competes with substrate. At low [S] it lowers the rate, but adding enough substrate out-competes the inhibitor, so the same is reached at very high [S]. The curve has a higher but the same plateau.
- A non-competitive inhibitor binds to a different site (an allosteric site) and changes the shape of the active site so that substrate can no longer bind effectively. It reduces the number of functional enzyme molecules. Adding more substrate cannot overcome this, so a lower is reached. The plateau is permanently lower than the uninhibited reaction.
Understanding the Question
The question shows a graph of rate of reaction versus substrate concentration with three curves (1, 2, 3) and asks the candidate to match each curve to one of the three conditions: no inhibitor, competitive inhibitor, non-competitive inhibitor. The command word is "Which row is correct?", and the marks reward selecting the right row of the table.
From the figure description:
- Curve 1: steepest initial rise, highest plateau
- Curve 2: less steep initial rise, approaches the same plateau as curve 1
- Curve 3: least steep initial rise, plateaus at a much lower rate
Approach
The decisive feature is the plateau (Vmax):
- The highest plateau = no inhibitor (curve 1).
- The plateau that meets the uninhibited plateau at high [S] = competitive inhibitor (curve 2).
- The lowest plateau that is never reached no matter how much substrate is added = non-competitive inhibitor (curve 3).
Step-by-Step Reasoning
-
Curve 1 → without inhibitor. Without any inhibitor, the enzyme catalyses the reaction at its full capacity. At very high [S] all active sites are occupied, giving the highest possible shown on the graph. Curve 1 reaches this highest plateau, so it represents the uninhibited reaction.
-
Curve 2 → with a competitive inhibitor. A competitive inhibitor occupies some active sites at low [S], so the rate rises less steeply than curve 1. However, because the inhibitor binds reversibly and the substrate can out-compete it at high [S], the curve eventually catches up to the same as the uninhibited reaction. Curve 2 shows exactly this behaviour: it starts below curve 1 but converges with it at high [S]. This is the hallmark of competitive inhibition.
-
Curve 3 → with a non-competitive inhibitor. A non-competitive inhibitor binds to a different site and inactivates a fraction of the enzyme molecules permanently (for that population of enzyme). Even with saturating substrate, those enzyme molecules cannot work, so the maximum rate achievable is lower than the uninhibited . Curve 3 plateaus well below curves 1 and 2, and adding more substrate does not raise this plateau. This is the signature of non-competitive inhibition.
Matching these assignments to the table:
- Without inhibitor: 1
- With a competitive inhibitor: 2
- With a non-competitive inhibitor: 3
This is row A.
Key Takeaways
- The maximum rate () is the key diagnostic feature: competitive inhibition does not change , while non-competitive inhibition lowers it.
- Competitive inhibitors raise the apparent (curve shifts right at low [S] but catches up); non-competitive inhibitors leave roughly unchanged but lower the ceiling.
- A common exam trap: assuming the curve that looks "least inhibited" must be the competitive one. In fact, the highest plateau is the uninhibited reaction, and the curve that shares the same plateau is the competitive one.
Common Mistakes
- Confusing the order: choosing B (without inhibitor = 1, competitive = 3, non-competitive = 2) because curve 3 "looks most inhibited at low [S]". In reality, at low [S] a competitive inhibitor can produce a much larger drop than a non-competitive one because it blocks the active site directly; the distinguishing feature is what happens at high [S].
- Selecting C or D, which place "without inhibitor" on curve 3. Curve 3 has the lowest plateau, so it cannot be the uninhibited reaction — without any inhibitor the enzyme would achieve its true , which is the highest plateau shown.
- Thinking that a non-competitive inhibitor should reduce the rate at low [S] by the same proportion as a competitive one. Non-competitive inhibition is largely independent of [S] at the high-substrate end, because the inhibition is not relieved by additional substrate.
Things to Be Careful About
- The CIE mark scheme for this style of question accepts the row letter (A) as the final answer; the supporting reasoning should make clear that the discriminator is the plateau height, not the initial slope.
- The wording "with a competitive inhibitor" describes the same molecule regardless of concentration; the curves drawn assume the inhibitor is at a fixed concentration while [S] is varied. This is the standard set-up for showing the two inhibition patterns on a single graph.
- If the question showed a Lineweaver–Burk (double reciprocal) plot instead, the diagnostic would be the y-intercept: competitive and non-competitive inhibitors give different y-intercepts ( unchanged for competitive, increased for non-competitive). On the Michaelis–Menten plot used here, the diagnostic is the plateau.
Which aspect of enzyme activity can be compared by the Michaelis–Menten constant?
Options
A activation energy of a reaction with or without an enzyme
B affinity of different enzymes for their substrates
C affinity of an enzyme at different substrate concentrations
D maximum rate of reaction () at different temperatures
Working
The Michaelis–Menten constant () is the substrate concentration at which the reaction rate is half of . A low indicates high affinity between enzyme and substrate (the enzyme needs very little substrate to reach half its maximum rate), while a high indicates low affinity. therefore allows comparison of the binding strength (affinity) of different enzymes for their substrates.
Answer
B
B
Background Concept
Enzyme kinetics describes how the rate of an enzyme-catalysed reaction depends on substrate concentration. Two key parameters emerge from the Michaelis–Menten model:
- — the maximum rate of reaction, achieved when every active site is saturated with substrate.
- — the substrate concentration at which the reaction rate equals .
is a characteristic constant for a given enzyme acting on a given substrate (under specified conditions of temperature and pH). It is inversely related to the affinity of the enzyme for its substrate:
- A low means the enzyme reaches half its maximum speed at a low substrate concentration → the enzyme binds its substrate tightly (high affinity).
- A high means a high substrate concentration is needed → the enzyme binds its substrate weakly (low affinity).
Because is determined only by the enzyme-substrate pair (not by enzyme concentration), it is the standard parameter used to compare how strongly different enzymes bind to their respective substrates.
Understanding the Question
The question is a multiple-choice item asking which aspect of enzyme activity can be compared using . The command word "can be compared" is the key — must tell us about a comparable, intrinsic property of enzymes.
Approach
Eliminate each option by asking whether actually measures or allows comparison of what is stated:
- Option A — activation energy. does not measure activation energy; this is a thermodynamic property of the reaction, not described by .
- Option B — affinity of different enzymes for their substrates. Yes — a low = high affinity and vice versa, so is the standard tool for comparing enzyme-substrate affinity.
- Option C — affinity of an enzyme at different substrate concentrations. is a single value for one enzyme under fixed conditions; "different substrate concentrations" describes how rate changes with [S], which is the Michaelis–Menten curve itself, not .
- Option D — at different temperatures. is not ; temperature affects both parameters but is used to compare affinity, not maximum rate.
Step-by-Step Reasoning
- Recall the definition of : the substrate concentration at .
- Recognise the inverse relationship between and enzyme-substrate affinity.
- Match this property to option B, which is the only option that refers to comparing affinity across different enzymes.
Key Takeaways
- is the substrate concentration giving half-maximal velocity.
- is inversely proportional to enzyme-substrate affinity.
- is used to compare the binding affinity of different enzymes (each with their own substrate).
- Do not confuse with , activation energy, or substrate concentration itself.
Common Mistakes
- Confusing with : is a rate; is a substrate concentration.
- Thinking a high means high affinity: it is the opposite — a high means low affinity.
- Choosing D because depends on temperature: while does vary with temperature, it is not used to compare ; temperature affects many kinetic parameters.
Things to Be Careful About
- has units of substrate concentration (e.g. ), not units of rate.
- is independent of enzyme concentration — it depends only on the intrinsic affinity of enzyme for substrate.
- The phrase "different substrate concentrations" in option C describes building a rate-vs-[S] curve; is one specific point on that curve, not a comparison across concentrations.
The number of substrate molecules one enzyme molecule can convert to product in a second is called the turnover number. This number is obtained when all conditions are optimum for the specific enzyme-catalysed reaction.
| enzyme | turnover number / |
|---|---|
| catalase | |
| carbonic anhydrase | |
| phosphatase | |
| protease |
How many times faster at converting substrate to product is catalase compared to phosphatase?
Options
A 29
B 288
C 2884
D 28 836
Working
Turnover number = substrate molecules converted to product per enzyme molecule per second.
Ratio of catalase to phosphatase:
Answer
C
C
Background Concept
Enzymes are biological catalysts that speed up reactions without being consumed. A useful way to express how fast an enzyme works is the turnover number (also called the catalytic constant, ), defined as the number of substrate molecules one enzyme molecule can convert into product in one second. Turnover number is measured when conditions are optimum (suitable pH, temperature, and saturating substrate concentration), so it represents the maximum rate at which a single enzyme molecule can work.
Different enzymes have very different turnover numbers. Catalase, which breaks down hydrogen peroxide into water and oxygen, is among the fastest enzymes known, while enzymes such as proteases and phosphatases work much more slowly because their catalytic mechanisms involve more steps or larger conformational changes.
Understanding the Question
The table gives the turnover numbers of four enzymes. The question asks: how many times faster is catalase than phosphatase at converting substrate to product?
This is a direct comparison of the two turnover numbers — essentially, how many times the catalase rate fits into the phosphatase rate. Both are quoted in the same units (), so the units cancel when we form the ratio, leaving a dimensionless number.
The command word is "How many times faster…?" — we are being asked for a ratio, not a difference.
Approach
To compare rates of the same process (substrate → product) for two enzymes, divide the faster rate by the slower rate. Because both rates are in the same units, the ratio itself is the answer the question wants.
Step-by-Step Reasoning
- From the table:
- Catalase turnover number =
- Phosphatase turnover number =
- Form the ratio:
- Carry out the division. and , so the true value lies between 2883 and 2884, much closer to 2884:
-
Rounded to the nearest whole number this gives , matching option C.
-
Options A (29) and B (288) correspond to common student errors (forgetting one or two zeros), and option D (28 836) comes from mis-placing the decimal point. Only C matches the correct ratio.
Key Takeaways
- Turnover number quantifies the catalytic speed of a single enzyme molecule under optimum conditions, in molecules per second.
- To compare two rates of the same reaction type, divide the larger by the smaller; the result is a pure number (units cancel).
- Catalase is one of the fastest enzymes known because its mechanism is simple and the products (water and oxygen) leave the active site very rapidly.
Common Mistakes
- Subtracting rather than dividing: would give a meaningless number. The question asks "how many times faster", which is a ratio, not a difference.
- Dropping zeros when typing the number into a calculator, giving answers like 29 or 288 — these correspond to the distractors A and B.
- Mis-placing the decimal to give 28 836 (option D).
- Forgetting to round the answer to a whole number, so writing 2883.6 — the mark scheme requires the value that matches the offered options, which is 2884.
Things to Be Careful About
- Check that you are using the catalase and phosphatase rows, not catalase and carbonic anhydrase (which would give ≈ 4.7, not in the options).
- Both turnover numbers must be in the same units before dividing — here they are both in , so this is fine.
- The question wording says "optimum conditions", reminding you that turnover number is itself a maximum rate; no temperature or pH correction is needed.
A red indicator solution was mixed with agar, and the resulting solid was cut into small cuboid blocks. The blocks were placed in an acid which turns the indicator yellow, and all other variables were kept constant. The dimensions of the three blocks used are shown.
block 1:
block 2:
block 3:
Which row shows the correct surface area (SA) to volume (V) ratio for each block, and the time taken for the block to turn yellow?
Options
| block 1 SA to V ratio | block 1 time to turn yellow / mins | block 2 SA to V ratio | block 2 time to turn yellow / mins | block 3 SA to V ratio | block 3 time to turn yellow / mins | |
|---|---|---|---|---|---|---|
| A | 4 | 11 | 13 | |||
| B | 13 | 11 | 4 | |||
| C | 4 | 11 | 13 | |||
| D | 13 | 11 | 4 |
Working
For a cube of side : and , so .
Block 1 (): — highest ratio, so acid diffuses in fastest → shortest time (4 min).
Block 2 (): — intermediate.
Block 3 (): — lowest ratio, so acid diffuses in slowest → longest time (13 min).
Answer
C
C
Background Concept
For any regular solid, the surface area to volume (SA:V) ratio describes how much surface is available relative to the volume that has to be supplied. For a cube of side length :
The crucial idea is that as a cube gets bigger, its volume grows as the cube of the side length while its surface area grows only as the square — so SA:V decreases as the block gets larger. Smaller blocks therefore expose a greater proportion of their interior to the surrounding medium.
This matters biologically because exchange of materials (oxygen, nutrients, waste) between a cell/tissue and its environment happens across the surface. Diffusion is efficient only over short distances, so a high SA:V ratio keeps every interior point close to the surface and allows fast exchange — the principle that limits cell size and forces large organisms to develop specialised exchange surfaces.
Understanding the Question
An agar cube containing a red pH indicator is dropped into acid. The acid diffuses in from the outside, lowering the pH and turning the indicator yellow. The rate at which the colour front reaches the centre of the cube depends on how quickly acid can penetrate — and that depends on the SA:V ratio.
- A large SA:V → short distance from surface to centre → fast colour change.
- A small SA:V → long distance from surface to centre → slow colour change.
We are given three cubes with sides 3 mm, 8 mm and 11 mm and asked to match (i) each SA:V ratio and (ii) the relative time for the cube to turn yellow. All other variables (acid concentration, temperature, agar composition) are kept constant.
Approach
- Use to compute each ratio.
- Rank the ratios (highest → lowest = 3 mm → 8 mm → 11 mm).
- Rank the times in the opposite order: the cube with the highest SA:V turns yellow fastest (shortest time); the cube with the lowest SA:V turns yellow slowest (longest time).
- Pick the row whose SA:V values and times both follow the same pattern.
Step-by-Step Reasoning
- Block 1 (): . With the shortest diffusion path, acid reaches the centre in only 4 min.
- Block 2 (): . Diffusion path is longer, so the time is intermediate, 11 min.
- Block 3 (): . The longest diffusion path and the smallest relative surface gives the slowest colour change, 13 min.
The row that matches is C (2.0:1, 4 min; 0.75:1, 11 min; 0.55:1, 13 min). Option A reverses the times and uses wrong ratios; option B reverses only the times with the wrong ratios; option D reverses the times again with the right ratios.
Key Takeaways
- For similar shapes, SA:V falls as size increases — formula for a cube is .
- Diffusion-limited processes (heat, gas, solute exchange) speed up with higher SA:V.
- Practical implication: large, compact structures cannot rely on diffusion alone for internal exchange, so organisms develop flat exchange surfaces, branching, or internal transport systems.
Common Mistakes
- Confusing SA:V ratio direction: students often put the biggest block as having the biggest SA:V (it doesn't — surface area grows more slowly than volume).
- Reversing the time order: a low SA:V means a longer diffusion distance, hence a longer time to turn yellow, not a shorter one.
- Using the wrong formula (e.g. treating SA:V as and forgetting the 6 faces).
Things to Be Careful About
- The numerical values in the options are deliberately close (0.55 vs 0.5) — round only at the end.
- The question uses cuboid blocks, but the ratio depends only on side length for cubes, so the same relationship holds.
- Read the table carefully: the times must match the same column as the corresponding SA:V — options A, B and D pair up the values inconsistently.
The statements describe some events in the process of exocytosis of glycoprotein molecules.
1 Membrane of the Golgi body folds around glycoprotein molecules.
2 Vesicle binds to and fuses with the cell surface membrane.
3 Vesicle attached to microtubules moves through the cytoplasm.
4 Secretory vesicle forms.
What is the correct order of events for exocytosis?
Options
A
B
C
D
Answer
The correct sequence is 1 → 4 → 3 → 2.
- Membrane of the Golgi body folds around glycoprotein molecules.
- Secretory vesicle forms.
- Vesicle attached to microtubules moves through the cytoplasm.
- Vesicle binds to and fuses with the cell surface membrane.
B
B
Background Concept
Exocytosis is the process by which cells export materials packaged in membrane-bound vesicles to the outside of the cell. It is one half of the vesicular transport system that operates between the endoplasmic reticulum, Golgi body and the cell surface membrane.
Key components:
- Golgi body: a stack of flattened membrane cisternae that modifies proteins (e.g. by adding carbohydrate groups to make glycoproteins) and packages them for export.
- Secretory vesicle: a small, membrane-bound sac budded off from the Golgi body, carrying the finished product.
- Microtubules: cytoskeletal tracks along which motor proteins (kinesins/dyneins) carry vesicles through the cytoplasm.
- Cell surface membrane: the phospholipid bilayer that the vesicle eventually fuses with so its contents are released to the exterior.
Understanding the Question
Four numbered statements describe events in the export of glycoprotein molecules from a cell. The task is to arrange them in the correct biological sequence. This is a "What is the correct order…?" question, so the entire mark is awarded for picking the option (A, B, C or D) whose numbered chain matches the real pathway.
Approach
Mentally run through exocytosis from the inside of the Golgi outwards:
- The glycoprotein is inside the Golgi body, and the Golgi membrane has to pinch off around it.
- Once pinched off, you have a vesicle — so vesicle formation must come next.
- The vesicle has to travel from the Golgi (which sits near the nucleus) to the cell surface, and it uses microtubules as rails.
- On reaching the plasma membrane, the vesicle fuses and releases its contents.
Matching these stages to the numbered statements:
- "Membrane of the Golgi body folds around glycoprotein molecules" → step 1.
- "Secretory vesicle forms" → step 2 (must follow directly after step 1).
- "Vesicle attached to microtubules moves through the cytoplasm" → step 3.
- "Vesicle binds to and fuses with the cell surface membrane" → step 4.
So the chain is 1 → 4 → 3 → 2.
Step-by-Step Reasoning
- Step 1 (statement 1): The Golgi body receives finished glycoproteins from the rough ER. To export them, regions of the Golgi membrane bud inwards around the glycoproteins, forming a vesicle.
- Step 2 (statement 4): Once budding is complete and the vesicle has pinched off, it is a discrete secretory vesicle. This must follow step 1 — you cannot have a vesicle without the membrane folding around its contents first.
- Step 3 (statement 3): Vesicles do not diffuse freely through the dense cytoplasm. They are loaded onto microtubules by motor proteins (kinesins for outward movement), which carry them along these cytoskeletal "tracks" to the cell periphery.
- Step 4 (statement 2): At the plasma membrane, SNARE proteins on the vesicle and on the cell surface membrane recognise each other, the vesicle docks, and the two bilayers fuse. The contents are then released to the extracellular space.
Rejecting the distractors:
- A (1 → 4 → 2 → 3): puts fusion with the cell membrane before transport — the vesicle cannot fuse at the membrane before it has been transported there.
- C (2 → 3 → 1 → 4): starts with membrane fusion, which is impossible without a vesicle having been formed first.
- D (4 → 1 → 3 → 2): has the vesicle forming before the membrane folds around the contents — the vesicle is the result of that folding, not its cause.
Only B (1 → 4 → 3 → 2) gives the biologically correct order.
Key Takeaways
- Exocytosis is a four-stage process: fold → form → transport → fuse.
- The Golgi body produces secretory vesicles by membrane budding.
- Microtubules provide the transport network that delivers vesicles to the cell surface.
- Vesicle–membrane fusion is the final, regulated event that releases the cargo.
Common Mistakes
- Reversing the formation order — saying the vesicle forms first and the membrane then folds around it. The vesicle is the product of the membrane folding.
- Forgetting that vesicles travel on microtubules rather than simply diffusing, leading to incorrect placements of statement 3.
- Confusing endocytosis and exocytosis: in endocytosis the cell surface membrane folds inwards first; in exocytosis the Golgi (or other internal) membrane folds first.
Things to Be Careful About
- Keep the direction of vesicular traffic clear: it flows from the Golgi body outward to the plasma membrane, not the reverse.
- Remember that microtubules and microfilaments serve different roles — long-distance transport (Golgi to membrane) uses microtubules, while short-range movement near the membrane uses actin microfilaments. CIE typically refers to microtubules for this step.
- When a question uses a sequence like "1 → 4 → 3 → 2", always double-check that each arrow is biologically possible — A is the most tempting trap here because the first three steps are correct.
Four cylinders that were identical in size, A, B, C and D, were cut from potatoes that had been stored for different lengths of time.
The cylinders were weighed, immersed in 10% salt solution for 45 minutes and then reweighed.
The percentage change in mass was then calculated.
Which cylinder had a water potential similar to the 10% salt solution?
Options
| percentage change in mass | |
|---|---|
| A | |
| B | |
| C | |
| D |
Working
When a potato cylinder is placed in a solution:
- If the cylinder's water potential is less negative (higher) than the solution, water leaves the cells by osmosis and the mass decreases (negative % change).
- If the cylinder's water potential is more negative (lower) than the solution, water enters the cells by osmosis and the mass increases (positive % change).
- If the water potentials are equal, there is no net movement of water and the mass change is approximately 0%.
A cylinder with a water potential similar to the 10% salt solution must therefore show a percentage change in mass closest to zero. Of the four options, C (−0.9%) is closest to zero, indicating that this cylinder was in approximate equilibrium with the 10% salt solution.
Answer
C
C
Background Concept
Water potential (Ψ) is the measure of the tendency of water to move from one region to another. Pure water has the highest water potential (Ψ = 0 kPa) and all other aqueous solutions have a more negative water potential because dissolved solutes lower the free energy of water.
When plant tissue is placed in a solution, water moves across the partially permeable cell-surface membrane by osmosis, from a region of higher (less negative) water potential to a region of lower (more negative) water potential.
- If tissue Ψ > solution Ψ → net water enters the cells → tissue gains mass.
- If tissue Ψ < solution Ψ → net water leaves the cells → tissue loses mass.
- If tissue Ψ = solution Ψ → no net movement of water → mass is unchanged.
The mass change of a tissue sample is therefore a simple, indirect measure of whether its water potential is higher, lower, or equal to that of the surrounding solution.
Understanding the Question
Four identical potato cylinders (A, B, C, D) — cut from potatoes that had been stored for different times, so their cell sap concentrations (and therefore water potentials) differ — were weighed, immersed in the same 10% salt solution for 45 minutes, then reweighed. The percentage change in mass was calculated for each. The question asks which cylinder had a water potential most similar to the 10% salt solution.
The key signal is the sign and magnitude of the percentage change in mass.
Approach
The cylinder whose water potential matches the 10% salt solution will experience no net osmotic water movement, so its mass will barely change. Among the four values given (−7.2%, −2.5%, −0.9%, +3.4%), the one closest to zero identifies that cylinder.
Step-by-Step Reasoning
- Cylinder A (−7.2%): a sizeable loss of mass. Water has left the cells, so this cylinder's water potential was noticeably less negative (higher) than the 10% salt solution. Reject.
- Cylinder B (−2.5%): a small but definite loss of mass. The water potential was slightly less negative than the solution — close, but not equal. Reject.
- Cylinder C (−0.9%): almost no change in mass. The water potential of this cylinder was essentially the same as that of the 10% salt solution. This is the answer.
- Cylinder D (+3.4%): a gain in mass. Water has entered the cells, so this cylinder's water potential was more negative (lower) than the 10% salt solution. Reject.
The negative sign in C reflects a tiny experimental imbalance (perhaps slight evaporation or a small difference in water potential); the value is small enough to represent near-equilibrium.
Key Takeaways
- Osmosis moves water from higher (less negative) to lower (more negative) water potential.
- A tissue placed in a solution of equal water potential shows no net change in mass.
- The sign of the percentage change in mass tells you whether the tissue is more or less concentrated than the bathing solution; the magnitude tells you how far apart the two water potentials are.
Common Mistakes
- Choosing B (−2.5%) because it is "the smallest decrease" — students forget that C is smaller still and that the criterion is being closest to zero, not just "a small change".
- Choosing A (−7.2%) by misreading negative as "no change". A negative percentage change always means a loss of mass.
- Choosing D (+3.4%) by confusing the direction of osmosis — water moves into cells only if the cell water potential is more negative than the surrounding solution.
- Not considering that storage time alters a potato's solute concentration: a longer-stored potato loses water, its cell sap becomes more concentrated, and its water potential becomes more negative, so it would tend to gain mass in the same salt solution.
Things to Be Careful About
- Always read the sign of the percentage change before interpreting it: negative = mass loss, positive = mass gain.
- "Similar water potential" means approximately equal, not "more negative than" or "less negative than" — the test for equality is a mass change of essentially zero.
- The four cylinders are cut from potatoes stored for different times, which is precisely why their water potentials differ; this variation in the independent variable is what makes the comparison possible.
- Do not confuse this with the idea that the salt solution's water potential is fixed; it is the tissues that differ, while the 10% salt solution is held constant.
The contents of a daughter cell are compared to the parent cell after one cell cycle.
Which row is correct?
Options
| number of chromosomes | volume of cytoplasm | length of telomeres | |
|---|---|---|---|
| A | increases | remains the same | decreases |
| B | increases | decreases | remains the same |
| C | remains the same | remains the same | remains the same |
| D | remains the same | decreases | decreases |
Working
After one mitotic cell cycle, the parent cell divides into two daughter cells.
- Number of chromosomes: Mitosis is an equational division. Each daughter cell receives an identical set of chromosomes, so the number remains the same.
- Volume of cytoplasm: During cytokinesis the cytoplasm of the parent is shared between the two daughter cells, so each daughter cell has roughly half the cytoplasm. The volume decreases.
- Length of telomeres: Because DNA polymerase cannot fully replicate the lagging strand to its very end, telomeres shorten at every S phase. After one cell cycle the telomeres decrease in length.
The only row that matches is D.
Answer
D
D
Background Concept
Mitosis is a form of nuclear division that produces two genetically identical daughter nuclei, each with the same number of chromosomes as the parent nucleus. It is followed by cytokinesis, in which the cytoplasm (and its organelles) is partitioned between the two daughter cells. The full sequence — interphase (G1, S, G2) → mitosis (prophase, metaphase, anaphase, telophase) → cytokinesis — is what is meant by one cell cycle.
Two further concepts are needed:
- Chromosome number in mitosis is conserved. During S phase the DNA is replicated, producing two sister chromatids per chromosome; at anaphase the sister chromatids separate, so each new nucleus ends up with the original chromosome number.
- Telomeres are repetitive non-coding DNA sequences (in humans, the TTAGGG repeat) at the ends of linear chromosomes, associated with protective proteins such as shelterin. Because DNA polymerase can only synthesise DNA in the 5′→3′ direction and requires an RNA primer, the very last few nucleotides of the lagging strand are not copied — the "end-replication problem". As a result, telomeres shorten by roughly 50–200 base pairs with every somatic cell division.
Understanding the Question
The stem sets up a comparison between a parent cell and one of its daughter cells after a single, complete cell cycle. The table asks which combination of changes correctly describes what has happened to three quantities:
- the number of chromosomes in the daughter cell,
- the volume of cytoplasm in the daughter cell,
- the length of the telomeres in the daughter cell.
The command word is implicit "which row is correct" — a single best answer must be selected.
Approach
Work through each of the three properties in turn, applying the relevant piece of cell-cycle biology, then match the resulting trio of changes to the options. The expected outcome is:
- chromosome number: unchanged (equational division),
- cytoplasmic volume: roughly halved (cytokinesis),
- telomere length: slightly shorter (end-replication problem).
Step-by-Step Reasoning
1. Number of chromosomes.
During S phase of interphase each chromosome is replicated to form two sister chromatids held at the centromere, but the chromosome is still counted as one (two chromatids = one chromosome). At anaphase the sister chromatids are pulled apart, and a complete set goes into each new nucleus. Therefore the daughter cell has the same number of chromosomes as the parent. Any option stating "increases" (A and B) can be eliminated.
2. Volume of cytoplasm.
Mitosis itself only divides the nucleus. The actual splitting of the cell body is cytokinesis — a cleavage furrow forms in animal cells, a cell plate forms in plant cells. The original cytoplasm, with its dissolved solutes and organelles, is shared roughly equally between the two daughters, so each daughter has approximately half the cytoplasmic volume of the parent. So the volume decreases.
3. Length of telomeres.
Because the lagging strand cannot be replicated all the way to its 5′ end, a small piece of the telomere is lost at each round of DNA replication. Telomerase (active in germ cells, stem cells and most cancer cells) can re-extend telomeres, but in a typical somatic cell cycle the telomeres are net shorter after one cell cycle. (Note: the shortening is small, but the mark scheme only needs the direction of the change.)
Putting the three together: same number of chromosomes, decreased cytoplasm, shorter telomeres. That matches row D.
Key Takeaways
- Mitosis is an equational division — chromosome number is unchanged in daughter cells.
- Cytokinesis halves the cytoplasm, so each daughter cell is smaller than the parent and then grows back during the next interphase.
- The end-replication problem causes telomeres to shorten at every S phase in cells lacking sufficient telomerase; this is one of the molecular hallmarks of ageing.
Common Mistakes
- Confusing mitosis with meiosis. Meiosis is a reductional division (chromosome number halves), so picking an option with "increases" or a vague idea that "the chromosome number changes" suggests this confusion.
- Thinking cytokinesis does not occur in one cell cycle, and therefore that cytoplasmic volume stays the same. Cytokinesis is, by convention, the final stage of the cell cycle.
- Assuming telomeres stay the same length. The end-replication problem applies to every S phase in normal somatic cells; only cells with active telomerase (germ cells, stem cells, ~90% of cancer cells) maintain telomere length.
- Forgetting the direction of the changes. Even if a student knows each fact, they may match them to the wrong row — option C is a common trap because it says "remains the same" for everything.
Things to Be Careful About
- "Number of chromosomes" refers to the count in the nucleus, not the number of chromatids. After S phase but before anaphase, a chromosome has two chromatids but is still one chromosome — so the daughter cell inherits the same chromosome number, not double.
- The slight telomere shortening is not detectable by eye or by any experiment the candidate is expected to perform; the question is testing the direction of the change, which is sufficient to identify row D.
- "Remains the same" is too strong a statement for telomere length in normal somatic cells; this is what makes option C incorrect.
A high-power photomicrograph shows a cell in a stage of mitosis.
The chromosomes are visible and lined up along the cell equator but there is no nuclear envelope.
Which stage of mitosis is shown by the photomicrograph?
Options
A prophase
B metaphase
C anaphase
D telophase
Working
During mitosis, chromosomes condense in prophase and the nuclear envelope breaks down at the end of prophase. In metaphase, the chromosomes (held by spindle fibres attached at their centromeres) are aligned along the equator of the cell — this is the diagnostic feature. The nuclear envelope is absent, which rules out telophase (where it reforms) and prophase (where it is still breaking down). In anaphase the chromosomes have already separated and are moving to opposite poles, so they are no longer lined up at the equator.
Answer
B
B
Background Concept
Mitosis is a continuous process but is divided into four named stages, each defined by the appearance and position of the chromosomes and the state of the nuclear envelope:
- Prophase: chromosomes condense and become visible; the nuclear envelope is still present but is beginning to break down; the nucleolus disappears; spindle fibres start to form.
- Metaphase: the nuclear envelope has completely broken down; chromosomes (each consisting of two sister chromatids joined at the centromere) are moved by spindle fibres to the cell equator and line up on the metaphase plate.
- Anaphase: the centromeres split and sister chromatids are pulled apart towards opposite poles of the cell by the shortening spindle fibres.
- Telophase: chromatids arrive at the poles and decondense; a new nuclear envelope reforms around each set; the nucleoli reappear; cytokinesis usually follows.
Two diagnostic features are emphasised in this question: the position of the chromosomes (equator vs scattered vs at poles) and the state of the nuclear envelope (present, absent, reforming).
Understanding the Question
The question describes a photomicrograph with two given features:
- The chromosomes are visible and lined up along the cell equator.
- There is no nuclear envelope.
We must match this description to one of the four stages of mitosis offered (A–D).
Approach
Compare each of the four options against the two diagnostic features described. The correct stage must satisfy both: chromosomes at the equator AND nuclear envelope absent.
Step-by-Step Reasoning
- A — Prophase: chromosomes are condensing but are scattered within the nuclear area, and the nuclear envelope is still present (or only just beginning to break down). Does not match.
- B — Metaphase: chromosomes are aligned at the equator by spindle fibres, and the nuclear envelope has fully disintegrated. Matches both features.
- C — Anaphase: the chromatids have separated and are moving towards opposite poles; they are no longer lined up at the equator. Does not match.
- D — Telophase: chromatids are at the poles and a new nuclear envelope is reforming around each set. Does not match.
Therefore the description corresponds to metaphase (B).
Key Takeaways
- The two quickest diagnostic features for identifying a mitotic stage on a micrograph are: where the chromosomes are (scattered, equatorial, separating to poles, or at poles) and whether a nuclear envelope is present.
- Metaphase = chromosomes on the equator + no nuclear envelope.
- Anaphase is the stage most commonly confused with metaphase; remember that in anaphase the chromatids have already split and are actively moving, so the line at the equator is lost.
Common Mistakes
- Choosing A (prophase) because the chromosomes are visible — but prophase chromosomes are scattered, not aligned at an equator, and the nuclear envelope is still present (or only fragmenting).
- Choosing C (anaphase) because the chromosomes are seen without a nuclear envelope — but anaphase chromosomes are split into two groups moving towards the poles, not lined up together at the equator.
- Choosing D (telophase) because two clusters of chromosomes might look like a line — telophase has the nuclear envelope reforming, which contradicts the description.
Things to Be Careful About
- "Lined up along the cell equator" is the single most important phrase in the question — only metaphase satisfies this.
- The absence of the nuclear envelope alone is not sufficient to identify metaphase; anaphase also has no nuclear envelope, so the chromosome position must be used as the deciding feature.
Which statements about the cell cycle are correct?
1 The cell cycle includes interphase and mitosis.
2 DNA replication takes place in interphase.
3 A cell can remain in interphase for several months.
Options
A 1, 2 and 3
B 1 and 2 only
C 1 and 3 only
D 2 and 3 only
Working
- Statement 1: The cell cycle consists of interphase and mitosis (M phase, which includes mitosis and cytokinesis). ✔
- Statement 2: DNA replication occurs during the S (synthesis) phase of interphase. ✔
- Statement 3: Many differentiated cells exit the active cycle and remain in interphase (G0) for long periods — for example, liver cells may stay in interphase for months, and neurons for a lifetime. ✔
All three statements are correct.
Answer
A
A
Background Concept
The cell cycle is the ordered series of events by which a cell duplicates its contents and divides into two daughter cells. It is divided into two major phases:
- Interphase — a long growth/preparation phase comprising three sub-phases: G1 (cell growth and synthesis of proteins/organelles), S (DNA synthesis, i.e. replication of the genome) and G2 (further growth, synthesis of microtubule proteins and checking of replicated DNA). Some texts also include a quiescent state called G0, in which non-dividing cells are said to have 'left' the cycle but are still considered to be in a prolonged interphase-like state.
- M phase (mitosis) — nuclear division (prophase, metaphase, anaphase, telophase) followed by cytokinesis (division of the cytoplasm).
A common misconception is that mitosis alone is the cell cycle; in reality, interphase typically occupies about 90% of the cycle duration.
Understanding the Question
This is a multiple-choice question (Paper 1 style) asking which of three statements about the cell cycle are correct. The candidate must judge each statement independently and then choose the option that lists all and only the correct ones.
Approach
Test each statement against the definition of the cell cycle:
- Does the cell cycle include both interphase and mitosis? — Yes.
- Does DNA replication occur in interphase? — Yes, specifically in the S phase.
- Can a cell remain in interphase for several months? — Yes; non-dividing (G0) cells such as hepatocytes, neurons and many others persist in an interphase-like state for very long periods.
Step-by-Step Reasoning
- Statement 1: The cell cycle is defined as interphase + mitosis (with cytokinesis). Mitosis without its preceding interphase would have no replicated DNA to separate. ✔
- Statement 2: During the S phase of interphase, each chromosome is replicated to form two sister chromatids, joined at the centromere. This must happen before mitosis can begin. ✔
- Statement 3: Many differentiated cells withdraw from the active cycle into G0, an extended interphase in which the cell performs its normal functions but does not divide. Liver cells, for example, typically remain in interphase for many months between divisions; neurons may remain there for a lifetime. ✔
All three statements are correct, so the answer is A (1, 2 and 3).
Key Takeaways
- The cell cycle = interphase (G1 → S → G2) + M phase (mitosis + cytokinesis).
- DNA replication is confined to the S phase of interphase.
- G0 is a quiescent extension of interphase; many cells spend the vast majority of their lifespan in interphase.
Common Mistakes
- Thinking the cell cycle is just mitosis — it is not; interphase is by far the longest part.
- Believing DNA is replicated during mitosis — it is replicated in S phase, well before mitosis begins.
- Assuming every cell divides continuously — many cells (e.g. neurons, mature red blood cells, most hepatocytes at rest) stay in interphase/G0 for very long periods.
Things to Be Careful About
- The mark scheme accepts G0 cells as still being in 'interphase' for the purpose of this question; do not argue that G0 is technically 'outside' the cycle unless the question is asking specifically about that distinction.
- 'Mitosis' in CIE marking sometimes includes cytokinesis, and sometimes excludes it — read the question's wording carefully.
A scientist stains the chromosomes of a plant cell with a fluorescent dye to observe the telomeres.
This cell has 38 chromosomes.
How many telomeres will the scientist observe in one of the nuclei during telophase of mitosis?
Options
A 38
B 76
C 114
D 152
Working
- During telophase of mitosis, the sister chromatids have already separated at anaphase and a full set of 38 chromosomes is present in each reforming nucleus.
- Each chromosome has 2 telomeres (one at each end of the DNA molecule).
- Telomeres in one nucleus = 38 × 2 = 76.
Answer
B
B
Background Concept
A chromosome is a single, continuous DNA molecule packaged with histone proteins. Because the DNA molecule has two ends, every chromosome carries two telomeres — specialised repetitive DNA–protein caps that protect the ends from degradation and from being recognised as DNA damage. Telomeres do not code for genes and shorten slightly with each round of replication in somatic cells.
During mitosis the cell passes through prophase, metaphase, anaphase and telophase. At anaphase, the sister chromatids of every chromosome are pulled apart, so each "chromosome" that arrives at a pole is now a single chromatid (one DNA molecule, two telomeres). At telophase, a new nuclear envelope forms around each set, and the cell is essentially two nuclei back-to-back just before cytokinesis.
Understanding the Question
The stem tells us:
- The plant cell has 38 chromosomes (so 2n = 38).
- We are asked for the number of telomeres the scientist would see in one of the nuclei during telophase of mitosis.
The command word is implicit: this is a multiple-choice calculation. The key idea is that, although we usually think of "38 chromosomes" as a count, each one carries two telomeres, and we only want the telomeres in a single reforming nucleus (not both).
Approach
Two facts combine to give the answer:
- Telophase of mitosis — each pole has received a complete set of 38 chromosomes. So one nucleus contains 38 chromosomes, not 76.
- Telomeres per chromosome — each linear chromosome has 2 telomeres.
Multiply chromosomes per nucleus by telomeres per chromosome.
Step-by-Step Reasoning
- 2n = 38 (given).
- During telophase, sister chromatids have already separated; each reforming nucleus contains 38 single-chromatid chromosomes.
- Each chromosome has 2 telomeres (one at each end of the DNA molecule).
- Therefore the answer is B: 76.
Key Takeaways
- A chromosome = one DNA molecule = 2 telomeres.
- During telophase, a complete diploid set (here 38) is present in each of the two reforming nuclei; the chromatids are now single, but each still has 2 ends.
- A common trap is to count all telomeres in the whole cell (which would be 152) instead of in one nucleus.
Common Mistakes
- Choosing D (152): counting telomeres in both nuclei of the dividing cell, not just one. The question specifies one of the nuclei.
- Choosing A (38): assuming one telomere per chromosome — every linear chromosome has two ends.
- Choosing C (114): arises from miscounting; no sound biological reason.
- Confusing chromatids with chromosomes: in early mitosis (prophase/metaphase) each chromosome is made of two sister chromatids, but in telophase the chromatids have separated, so 38 chromosomes = 38 DNA molecules = 76 telomeres, not 152.
Things to Be Careful About
- Read the question carefully: one nucleus, not both.
- Remember the stage: at telophase the chromatids have already separated at anaphase, so each pole has 38 single-chromatid chromosomes, not 19 double-chromatid ones.
- "Chromosome" in this context = the unit of counting; it is the same before and after anaphase (38), only its structure (one vs two chromatids) changes.
During the semi-conservative replication of DNA, the double helix is unwound by an enzyme.
Which diagram shows how the strands are copied?
Options
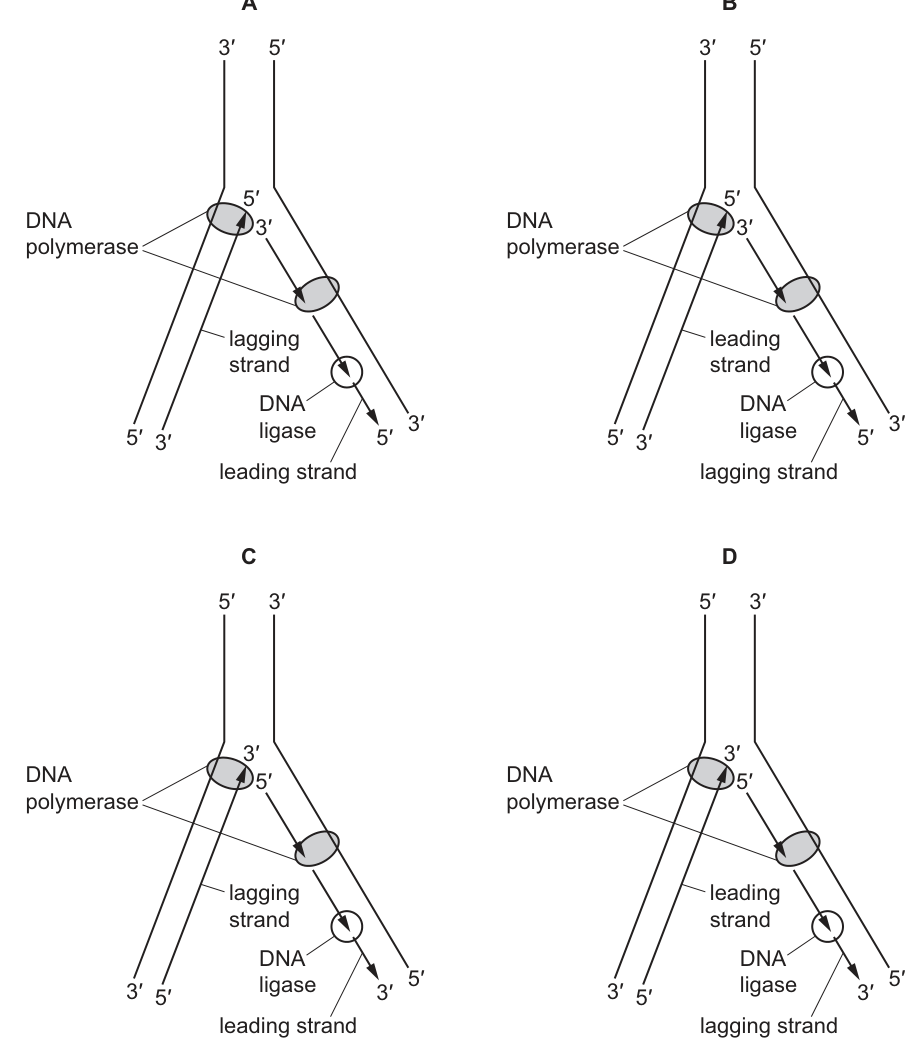
Working
During semi-conservative replication the two parent strands are antiparallel. DNA polymerase can only add nucleotides to the 3′ end of a growing strand, so each new daughter strand is built in the 5′ → 3′ direction.
Consequences at a replication fork:
- On the template that runs 3′ (top) → 5′ (bottom), the polymerase reads the template 3′ → 5′ (top → bottom) and the new strand grows 5′ → 3′ away from the fork → this is the lagging strand (made as Okazaki fragments, later sealed by DNA ligase).
- On the template that runs 5′ (top) → 3′ (bottom), the polymerase reads the template 3′ → 5′ (bottom → top) and the new strand grows 5′ → 3′ towards the fork → this is the leading strand (synthesised continuously).
In diagram D, the parent strand on the left has its 5′ end at the top of the fork and 3′ end at the bottom, so the daughter on the left is built 5′ → 3′ towards the fork (leading strand). The parent strand on the right has its 3′ end at the top of the fork and 5′ end at the bottom, so the daughter on the right is built 5′ → 3′ away from the fork in short fragments (lagging strand), with DNA ligase joining the Okazaki fragments. The polymerase arrows and the 3′/5′ labels at the bottom of both daughter strands are consistent with 5′ → 3′ synthesis.
Diagrams A and C have the wrong assignment of leading/lagging strands to the parent-strand orientations, and B has the leading and lagging strands swapped relative to A.
Answer
D
D
Background Concept
DNA is a double helix made of two antiparallel strands. Each strand has a free 5′ end (with a phosphate on carbon 5 of the deoxyribose) and a free 3′ end (with a hydroxyl on carbon 3). The two strands run in opposite directions: if one strand is written 5′ → 3′, its partner is written 3′ → 5′. Complementary bases pair A–T and G–C across the two backbones.
DNA replication is semi-conservative: each daughter molecule contains one original (parental) strand and one newly synthesised strand. The double helix is unwound by helicase at the replication fork, exposing the two parent strands as templates.
The enzyme that builds the new strands is DNA polymerase, which has a strict directionality: it can only add nucleotides to the 3′-OH end of a growing strand, so the new strand is always synthesised 5′ → 3′.
Because the parent strands are antiparallel and DNA polymerase can only work 5′ → 3′, the fork has two different modes of synthesis:
- On the template that runs 3′ → 5′ away from the fork, polymerase can follow the fork continuously, building the leading strand as one long piece in the direction the fork is opening.
- On the template that runs 5′ → 3′ towards the fork, polymerase has to work backwards (away from the fork) and restart every time the fork opens a new section. This produces short Okazaki fragments, which together form the lagging strand. The gaps between fragments are sealed by DNA ligase.
Understanding the Question
We are shown four replication-fork diagrams (A–D), each with the parent DNA at the top of an inverted-Y shape, helicase opening the fork, and DNA polymerase (grey oval) plus DNA ligase acting on the daughter strands. Each diagram labels:
- the 5′/3′ ends of the parent strands at the top of the Y;
- which daughter is the "leading strand" and which is the "lagging strand";
- the 5′/3′ ends of the daughter strands at the bottom of the Y;
- where DNA ligase is acting.
The task is to identify which diagram correctly represents semi-conservative replication.
Approach
Apply four rules to each diagram and reject any that break one:
- Antiparallel parents: the two parent strands at the top must run in opposite directions (one 3′ → 5′, the other 5′ → 3′).
- 5′ → 3′ daughter synthesis: each new strand must be synthesised 5′ → 3′, so its 5′ end is closer to the fork at the start of synthesis.
- Leading vs lagging: the daughter that runs 5′ → 3′ towards the fork is the leading strand; the one that runs 5′ → 3′ away from the fork is the lagging strand.
- Ligase position: DNA ligase is needed only on the lagging strand, to join Okazaki fragments.
Step-by-Step Reasoning
Reading the top labels of each diagram and applying rule 1:
- A: top = 3′ (left) and 5′ (right). So the left parent runs 3′ (top) → 5′ (bottom) and the right parent runs 5′ (top) → 3′ (bottom). For 5′ → 3′ daughter synthesis:
- Left daughter: 5′ (top) → 3′ (bottom). Polymerase moves away from the fork → must be lagging, with ligase on the left. A does label left as lagging, but the polymerase arrows drawn on the lagging strand point towards the fork (i.e. they show synthesis in the wrong direction), which contradicts 5′ → 3′ synthesis. ❌
- B: same parent labels as A (top = 3′ left, 5′ right), but leading/lagging are swapped (leading on left, lagging on right). With left parent running 3′ top → 5′ bottom, the left daughter would have to be synthesised 5′ (top) → 3′ (bottom), i.e. away from the fork → that is the lagging strand, not the leading. ❌
- C: top = 5′ (left) and 3′ (right). The left parent now runs 5′ top → 3′ bottom, so the left daughter would be 3′ top → 5′ bottom, built by polymerase moving towards the fork → the left should be the leading strand. C labels the left as lagging, so the leading/lagging assignment is wrong. ❌
- D: top = 5′ (left) and 3′ (right).
- Left parent 5′ (top) → 3′ (bottom); left daughter 3′ (top) → 5′ (bottom); polymerase reads template 3′ → 5′ (bottom → top), so polymerase moves towards the fork → leading strand. D correctly labels the left as leading.
- Right parent 3′ (top) → 5′ (bottom); right daughter 5′ (top) → 3′ (bottom); polymerase moves away from the fork → lagging strand, with Okazaki fragments joined by DNA ligase. D correctly labels the right as lagging and shows ligase there.
- The 3′/5′ labels at the bottom of both daughter strands match these antiparallel orientations, and the polymerase arrows on each daughter point in the 5′ → 3′ direction of synthesis. ✓
Only D is fully consistent with all four rules.
Key Takeaways
- DNA's two strands are antiparallel; this single structural fact forces DNA replication to be asymmetric at each fork.
- DNA polymerase works only 5′ → 3′, so on one template it follows the fork (leading) and on the other it works backwards in fragments (lagging).
- The lagging strand needs DNA ligase to join Okazaki fragments; the leading strand does not.
- When you read a fork diagram, check four things in this order: parent-strand polarity, daughter-strand polarity, leading/lagging assignment, and ligase position.
Common Mistakes
- Forgetting the antiparallel rule and treating the two parent strands as if they ran in the same direction. This is the root of every error in diagrams A–C.
- Swapping leading and lagging strands because the diagram looks "mirror-image" of what you expected; mirror-flipping a fork also flips which template is read 3′ → 5′ towards the fork, so leading and lagging must flip too.
- Placing DNA ligase on the leading strand by mistake — ligase is only needed where Okazaki fragments are produced, i.e. on the lagging strand.
- Reading the polymerase arrow as "direction polymerase travels on the daughter strand" in the wrong sense — the arrow shows the 5′ → 3′ direction of synthesis, which is away from the fork on the lagging strand and towards the fork on the leading strand.
Things to Be Careful About
- Always read the 5′ and 3′ ends at the top of the fork first to deduce the orientation of the parent templates; this determines where polymerase can move.
- The bottom labels of the daughter strands must be antiparallel to the parent strand directly above them; if they aren't, the diagram is wrong even if the leading/lagging labels look plausible.
- A correct diagram must satisfy all four rules simultaneously — one error anywhere (parent polarity, daughter polarity, leading/lagging, ligase) is enough to make it incorrect.
A transcription error results in the deletion of one nucleotide from the middle of a primary transcript. mRNA forms from the primary transcript.
Which statement describes one possible effect of this deletion on the protein translated from this mRNA?
Options
A The protein will be unchanged as the same amino acids can be coded by another codon formed by the deletion.
B The tertiary structure of the protein is not affected as only one amino acid has been changed by the deletion.
C Only one amino acid has been changed by the deletion but this changes the quaternary structure of the protein.
D The sequence of amino acids in the protein will be different as all the codons from the deletion onwards are changed.
Working
A deletion of one nucleotide from the middle of an mRNA shifts the reading frame of every codon downstream of the deletion. Because codons are read in non-overlapping triplets from a fixed start, removing one base means the ribosome re-groups the remaining bases into new triplets from that point on. This changes every amino acid coded from the deletion onwards (and often introduces a premature stop codon).
Option A is wrong: the deletion changes the reading frame, so the new codons do not simply re-code the same amino acids.
Option B is wrong: a frameshift does not change only one amino acid, and even a single substitution that changes one amino acid can affect tertiary structure.
Option C is wrong: the premise is incorrect — a frameshift alters many amino acids, not just one; and a single amino acid change would not typically alter quaternary structure.
Option D is correct: the sequence of amino acids from the deletion point onwards is changed because all subsequent codons are read in a different frame.
Answer
D
D
Background Concept
The genetic code is read by the ribosome in non-overlapping groups of three bases (triplets/codons), starting from a fixed initiation codon (AUG). Each codon specifies one amino acid, and the ribosome moves along the mRNA three bases at a time. This fixed triplet grouping is called the reading frame.
A substitution mutation swaps one base for another and alters only the single codon in which that base sits; downstream codons are unaffected (one amino acid may change, or none if the substitution is synonymous).
A deletion (or insertion) of nucleotides in numbers that are not multiples of three shifts the reading frame for every codon downstream — a frameshift mutation. Because the ribosome continues to read in triplets from a new starting position, every subsequent codon is re-grouped and almost every amino acid from that point on is changed. Frameshifts also frequently create a premature stop codon, truncating the protein.
Understanding the Question
The stem states that a transcription error deletes one nucleotide from the middle of a primary transcript, from which mRNA is then formed. The question asks for one possible effect of this deletion on the translated protein. We are to choose the statement that correctly describes what such a deletion can do.
The command word is implicit: identify the correct description among four options, recognising the consequence of a single-nucleotide deletion in protein-coding sequence.
Approach
The key idea is that removing one nucleotide from the coding sequence of an mRNA shifts the reading frame for everything that follows. Translate this principle into the consequence for the polypeptide: many amino acids downstream of the deletion are changed (and a premature stop codon may appear), so the overall amino acid sequence of the protein is different from the deletion point onwards.
Then test each option against this principle.
Step-by-Step Reasoning
- Removing a single nucleotide is not a multiple of three, so it shifts the triplet reading frame downstream of the deletion site.
- All codons from the deletion point onwards are read in a new frame, so the amino acid sequence from that point is different from the original — a different primary structure, and very likely a different tertiary structure as well.
- A frameshift typically also introduces a premature stop codon, often producing a truncated, non-functional protein.
- Option A is wrong: the codons downstream of the deletion are not the original codons; they are new triplets read in a shifted frame, so the same amino acids are not re-coded.
- Option B is wrong on two counts: (1) the premise — a frameshift changes many amino acids, not just one; and (2) even a single amino acid change can affect tertiary structure, so the assertion that tertiary structure is not affected is unjustified.
- Option C is wrong because the premise is false: a frameshift alters many amino acids, not only one. In addition, a single amino acid change would not be expected to alter quaternary structure (which depends on the association of multiple polypeptide subunits).
- Option D correctly describes the consequence of a frameshift: the amino acid sequence from the deletion onwards is changed because every downstream codon is re-grouped in a different frame.
Key Takeaways
- A deletion (or insertion) of nucleotides whose number is not a multiple of three causes a frameshift.
- A frameshift changes every amino acid from the mutation point onwards and frequently introduces a premature stop codon.
- A single-base substitution, by contrast, alters at most one amino acid.
- Mutations are typically described in terms of their effect on primary structure (amino acid sequence); any effects on tertiary or quaternary structure flow from that change.
Common Mistakes
- Treating a deletion like a substitution and assuming only one amino acid is affected.
- Believing the ribosome can "re-set" to the original reading frame downstream of a deletion — it cannot.
- Confusing tertiary and quaternary structure when reasoning about mutation effects.
- Assuming a single amino acid change never affects protein function — it can, for example, in an active site or binding pocket.
Things to Be Careful About
- The question specifies the deletion is in the middle of the transcript, not at the very start or end — this rules out answers that depend on the start codon being unaffected.
- The phrase "one possible effect" is satisfied by D, since a frameshift can in principle change every downstream codon.
- Read each option's premise as well as its conclusion: a wrong premise (e.g. "only one amino acid has been changed") makes the whole statement wrong, even if the conclusion about structure happens to be plausible.
Which statements correctly describe the process of translation?
1 The nucleotide sequence on an mRNA molecule is used to produce a specific amino acid chain.
2 A section of DNA is copied into an mRNA molecule by RNA polymerase.
3 A polypeptide is produced because anticodons on tRNA molecules attach to mRNA codons through peptide bonds.
Options
A 1 and 2
B 1 and 3
C 1 only
D 2 and 3
Working
- Statement 1: Describes the codon-by-codon reading of mRNA to build an amino acid chain. This is translation. ✓
- Statement 2: Describes the synthesis of mRNA from a DNA template by RNA polymerase. This is transcription, not translation. ✗
- Statement 3: Anticodons on tRNA pair with mRNA codons through hydrogen bonds (between complementary bases), not peptide bonds. Peptide bonds form between amino acids carried by successive tRNAs. ✗
Only statement 1 is correct.
Answer
C
C
Background Concept
Protein synthesis has two stages:
- Transcription (in the nucleus, for eukaryotes): a section of DNA is unwound and one strand (the template / antisense strand) is used by RNA polymerase to synthesise a complementary mRNA molecule. The mRNA then leaves the nucleus via a nuclear pore.
- Translation (at ribosomes in the cytoplasm / on the rough endoplasmic reticulum): the ribosome reads the mRNA codon by codon. Each codon (three bases) is recognised by a complementary anticodon on a transfer RNA (tRNA), which carries the corresponding amino acid. The ribosome catalyses peptide bond formation between successive amino acids, producing a polypeptide chain.
Key bonding facts for translation:
- Anticodon–codon pairing on the ribosome: hydrogen bonds between complementary bases (A–U, G–C).
- Between amino acids of the growing chain: peptide bonds (catalysed by peptidyl transferase activity of the ribosome, itself an rRNA ribozyme).
Understanding the Question
This is a "select the correct combination" MCQ. The question asks which of three statements correctly describe the process of translation. A statement is wrong if it (a) describes the wrong stage of protein synthesis, or (b) gets the chemistry / mechanism wrong. We must judge each one independently and then pick the answer that lists every true statement and no false one.
The three statements are:
- mRNA nucleotide sequence → amino acid chain. (Defines the purpose of translation.)
- DNA section copied into mRNA by RNA polymerase. (This is transcription.)
- Anticodons on tRNA attach to mRNA codons through peptide bonds. (Anticodons attach by hydrogen bonds; peptide bonds join amino acids.)
Approach
Apply two filters to each statement:
- Process filter: is the statement describing translation specifically?
- Mechanism/chemistry filter: is the chemistry correct?
A statement passes only if both filters are satisfied.
Step-by-Step Reasoning
Statement 1 — TRUE.
Translation uses the linear nucleotide sequence of an mRNA (read in non-overlapping triplets / codons) to specify the linear sequence of amino acids in a polypeptide. This is the central dogma definition of translation and is the whole point of the process.
Statement 2 — FALSE (wrong process).
The synthesis of an mRNA molecule from a DNA template, catalysed by RNA polymerase, is the definition of transcription, which precedes translation. It is therefore not a description of translation. This is a common distractor designed to test whether the student can keep the two stages separate.
Statement 3 — FALSE (wrong chemistry).
The statement is half-right and half-wrong. tRNA anticodons do base-pair with mRNA codons, and a polypeptide is produced, but the bond that holds an anticodon to its codon is a set of hydrogen bonds between complementary nitrogenous bases — not a peptide bond. Peptide bonds are formed between the amino acids carried by successive tRNAs, catalysed by the ribosome. Conflating the two is a classic error in CIE mark schemes and is explicitly rejected here.
Only statement 1 is correct, so the correct option is C (1 only).
Key Takeaways
- Translation = reading mRNA codons with tRNA anticodons to build a polypeptide.
- Transcription = making mRNA from DNA using RNA polymerase. Do not confuse the two.
- Codon–anticodon interaction: hydrogen bonds between bases.
- Amino-acid-to-amino-acid linkage: peptide bonds.
- In "which statements describe X" questions, every false word (wrong process, wrong bond, wrong organelle) is enough to make a whole statement false.
Common Mistakes
- Choosing A (1 and 2) because statement 2 is true of protein synthesis overall — forgetting that the question asks specifically about translation.
- Choosing B (1 and 3) because the statement mentions tRNA, anticodons, mRNA, codons, polypeptide and sounds plausible. The trap is the word "peptide bonds" in the wrong place.
- Saying "anticodons pair with codons by complementary base pairing" without naming hydrogen bonds — on a written answer this would not be credited; here the mark scheme rejects "peptide bonds" outright.
- Confusing which bond forms where: ribosome makes peptide bonds between amino acids; the mRNA–tRNA recognition is by hydrogen bonding between bases.
Things to Be Careful About
- The command word is "describe the process of translation" — anything describing transcription is automatically wrong, no matter how biologically correct it is in isolation.
- Bond terminology is precise in CIE marking: hydrogen bonds for base pairing, peptide bonds for amino-acid linkage. Mixing them is a guaranteed zero for the affected point.
- Statement 1's wording ("specific amino acid chain") is a cue: it is the one statement that is both correctly scoped to translation and correctly mechanistic.
A molecule of mRNA was used in translation. Part of its sequence is shown.
GAU CUG UAA CGG
There were no introns present in the section of DNA that was transcribed to make this mRNA.
What is the sequence of the non-transcribed DNA strand for this section?
Options
A CTA GAC ATT GCC
B CUA GAC AUU GCC
C GAT CTG TAA CGG
D GAU CUG UAA CGG
Working
- mRNA sequence given: GAU CUG UAA CGG
- The transcribed (template) DNA strand is complementary and antiparallel to the mRNA, with T replacing U:
- G → C, A → T, U → A, C → G
- Template DNA: CTA GAC ATT GCC
- The non-transcribed DNA strand is the other strand of the double helix, complementary to the template strand. It has the same base sequence as the mRNA except that T replaces U:
- Non-transcribed DNA: GAT CTG TAA CGG
- Options B and D still contain U, so they cannot be DNA. Option A is the template strand. Option C matches the non-transcribed strand.
Answer
C
C
Background Concept
In a DNA double helix, two antiparallel polynucleotide strands are held together by complementary base pairing: adenine (A) pairs with thymine (T) via two hydrogen bonds, and guanine (G) pairs with cytosine (C) via three hydrogen bonds. During transcription, only one of the two DNA strands — the template (transcribed) strand (also called the antisense strand) — is used as the pattern for synthesising a complementary mRNA molecule. RNA uses uracil (U) instead of thymine, so in the RNA–DNA pairing, A in mRNA pairs with T in DNA, and U in mRNA pairs with A in DNA.
The other DNA strand is the non-transcribed (coding/sense) strand. Its base sequence is the same as the mRNA (read in the same direction), except that every U in the mRNA is replaced by T in the DNA. It is called the 'coding' strand because, like the mRNA, it carries the same codon information — although it is never itself translated.
Understanding the Question
You are given a short mRNA sequence — GAU CUG UAA CGG — and asked to identify the sequence of the non-transcribed DNA strand that corresponds to it. The hint that 'there were no introns' simply tells you that no post-transcriptional editing (splicing) has altered the mRNA, so its sequence directly reflects the DNA template.
This is a multiple-choice question with four options; the correct answer must satisfy two conditions:
- It must be a DNA sequence (so it must contain T, not U).
- It must be the non-transcribed (coding) strand, not the transcribed (template) strand.
Approach
Work in two complementary-base-pairing steps:
- Step 1: mRNA → template DNA (one base substitution and one base pairing)
- Step 2: template DNA → non-transcribed DNA (standard DNA–DNA base pairing)
Equivalently, since the non-transcribed strand has the same sequence as the mRNA with T replacing U, you can simply rewrite the mRNA replacing every U with T.
Step-by-Step Reasoning
-
Apply the mRNA → template DNA pairing. The transcribed strand is complementary and antiparallel to the mRNA, with T replacing U:
- mRNA: G A U C U G U A A C G G
- Template: C T A G A C A T T G C C
-
Apply the DNA–DNA base pairing to get the non-transcribed strand. The non-transcribed strand is the complement of the template strand:
- Template: C T A G A C A T T G C C
- Non-transcribed: G A T C T G T A A C G G
-
Compare with the options:
- A: CTA GAC ATT GCC — this is the template (transcribed) strand, not the non-transcribed strand.
- B: CUA GAC AUU GCC — contains U, so this is mRNA, not DNA.
- C: GAT CTG TAA CGG — contains T (not U) and matches the non-transcribed DNA sequence.
- D: GAU CUG UAA CGG — contains U, so this is the original mRNA, not DNA.
-
Confirm the answer: Only option C is a DNA sequence (T, not U) AND represents the non-transcribed strand (same sequence as the mRNA with T substituted for U).
Key Takeaways
- DNA uses T; RNA uses U. Any option containing U cannot be a DNA strand.
- The mRNA sequence mirrors the non-transcribed (coding/sense) DNA strand, with U → T.
- The mRNA is complementary to the transcribed (template/antisense) DNA strand.
Common Mistakes
- Choosing A because you correctly found the DNA strand complementary to the mRNA but stopped at the template strand instead of taking the other (non-transcribed) strand.
- Choosing B or D because you forgot that DNA contains T, not U — these options are essentially mRNA-style sequences.
- Confusing 'transcribed' with 'non-transcribed': the transcribed strand is the one used as the template during transcription; the non-transcribed strand is its complement on the other side of the double helix.
Things to Be Careful About
- Always replace U with T when converting from an RNA sequence to a DNA sequence.
- A pure substitution of U → T on the mRNA is a quick shortcut for finding the non-transcribed (sense) DNA strand — useful for fast elimination in MCQs.
- Remember the direction of complementarity: C pairs with G, A with T (in DNA) or A with U (in mRNA).
Which properties of water are dependent on hydrogen bonding between water molecules?
Options
| cohesion | high latent heat of vaporisation | solvent action | high specific heat capacity | |
|---|---|---|---|---|
| A | ✓ | ✓ | ✓ | ✗ |
| B | ✓ | ✓ | ✗ | ✓ |
| C | ✓ | ✗ | ✓ | ✓ |
| D | ✗ | ✓ | ✓ | ✓ |
key
✓ = dependent
✗ = not dependent
Working
Hydrogen bonding BETWEEN water molecules (intermolecular) is responsible for:
- Cohesion ✓ — water molecules attract each other due to H-bonds, producing surface tension and allowing columns of water to be pulled up xylem vessels.
- High latent heat of vaporisation ✓ — breaking the H-bonds between molecules when water evaporates requires a large input of energy.
- High specific heat capacity ✓ — energy is absorbed in breaking and re-forming H-bonds before the kinetic energy (and therefore temperature) of the molecules rises significantly.
Solvent action is NOT dependent on hydrogen bonding between water molecules. It depends on water being a polar molecule — the polar covalent O–H bonds within a single water molecule allow it to surround and separate ions and other polar solutes. The intermolecular hydrogen bonds are not the cause.
Therefore the correct combination is: cohesion ✓, high latent heat of vaporisation ✓, solvent action ✗, high specific heat capacity ✓.
Answer
B
B
Background Concept
A water molecule (H₂O) has two polar covalent O–H bonds: oxygen is more electronegative than hydrogen, so each O–H bond carries a permanent dipole (δ⁻ on O, δ⁺ on H). The polar covalent bonds within a single molecule give water its polarity, and this polarity is what allows water to act as a solvent.
Between water molecules, the δ⁺ hydrogen of one molecule is electrostatically attracted to the δ⁻ oxygen (which carries two lone pairs) of an adjacent molecule. This attraction is a hydrogen bond — an intermolecular force, much weaker than a covalent bond but strong enough in aggregate to give water its unusual properties.
It is essential to keep two ideas separate:
- Polar covalent bonds within a water molecule → polarity → solvent action.
- Hydrogen bonds between water molecules → cohesion, high latent heat of vaporisation, high specific heat capacity, high surface tension.
Understanding the Question
This is a tick-box classification MCQ. The candidate must decide, for each of four properties, whether it is caused by hydrogen bonding between water molecules (✓) or not (✗). The correct row is then matched to one of four options.
Approach
Take each of the four properties in turn and ask: "is the cause of this property the hydrogen bonds between water molecules, or something else?"
Step-by-Step Reasoning
- Cohesion — water molecules stick to other water molecules. The only way this happens is via the hydrogen bonds between them. ✓
- High latent heat of vaporisation — for water to evaporate, molecules must separate completely from their neighbours, breaking the H-bonds. A lot of energy is needed, hence a high latent heat. ✓
- Solvent action — water dissolves ionic and polar substances because its own polar O–H bonds attract ions and other polar molecules. The cause is the polarity of the water molecule itself, not the hydrogen bonds between molecules. ✗
- High specific heat capacity — when water is heated, much of the energy goes into breaking and re-forming hydrogen bonds between molecules rather than increasing the kinetic energy of the molecules. Hence water warms up slowly. ✓
The combination ✓ ✓ ✗ ✓ matches option B.
Key Takeaways
- Hydrogen bonding between water molecules explains cohesion, high latent heat of vaporisation, high specific heat capacity, high surface tension and (relevant elsewhere) ice being less dense than liquid water.
- Water's solvent action is due to the polar covalent bonds within a water molecule — it is the polarity of a single H₂O molecule that makes water a "universal solvent", not H-bonding between molecules.
- This distinction (intra- vs intermolecular) is a classic MCQ trap.
Common Mistakes
- Marking solvent action as dependent on hydrogen bonding — this is the distractor in option A and a common error. Solvent action is polar-covalent-bond dependent, not H-bond dependent.
- Confusing latent heat of vaporisation with latent heat of fusion; both involve breaking H-bonds but the former also requires molecules to escape the liquid entirely.
- Thinking that "water is a good solvent because it has hydrogen bonds" — water is a good solvent because it is polar.
Things to Be Careful About
- The wording "dependent on hydrogen bonding between water molecules" — solvent action is excluded by this precise wording.
- Don't confuse "high specific heat capacity" with "high latent heat of vaporisation"; both rely on H-bonds but they describe different thermal behaviours.
Which substances in xylem tissue are impermeable to water and prevent the collapse of the vessels?
Options
| impermeable to water | prevent collapse | |
|---|---|---|
| A | cellulose | cellulose only |
| B | cellulose | lignin only |
| C | lignin | cellulose only |
| D | lignin | cellulose and lignin |
Working
Xylem vessel walls contain both cellulose and lignin, each with distinct roles:
- Lignin is deposited in the secondary cell wall and is impermeable to water, so it waterproofs the wall and prevents water leaking out of the vessel lumen into surrounding tissues.
- The wall's mechanical strength that prevents the vessel from collapsing under the negative pressure (tension) generated during transpiration comes from both the cellulose microfibrils (which provide tensile strength) and the lignin (which provides compressive strength and rigidity). Together they keep the vessel open as a continuous tube.
Option D correctly states that lignin is the impermeable component and that both cellulose and lignin together prevent collapse.
Answer
D
D
Background Concept
Mature xylem vessels are dead, empty tubes formed from cells whose end walls and cytoplasm have broken down, leaving a continuous lumen for water transport. Their walls are thickened and strengthened to cope with very low (negative) pressures generated by the transpiration pull, and to be waterproof so water does not leak sideways into surrounding tissues. Two biopolymers dominate these thickened walls:
- Cellulose — a polysaccharide of β-glucose units linked by β-1,4 glycosidic bonds, forming long, straight microfibrils embedded in the wall. The microfibrils give the wall high tensile strength (resistance to being pulled apart).
- Lignin — a complex, hydrophobic, cross-linked phenolic polymer deposited in the secondary cell wall. It is largely impermeable to water, hard, and rigid, giving the wall compressive strength and resistance to compression and collapse.
In xylem, lignin is laid down in the secondary wall inside the cellulose framework, waterproofing the wall and providing the rigidity that holds the vessel open under tension.
Understanding the Question
The question presents a small table with two columns — "impermeable to water" and "prevent collapse" — and four candidate pairings. The candidate must decide (i) which cell-wall component is the water-impermeable one, and (ii) which component(s) stop the vessel from collapsing. Each column is being asked independently, so the answer must satisfy both columns correctly.
Approach
- Step 1: Decide which substance in xylem walls is impermeable to water — recall that lignin is the hydrophobic, waterproofing polymer; cellulose is hydrophilic and water passes through it readily.
- Step 2: Decide which substance(s) prevent the vessel from collapsing under the tension of the transpiration stream — both contribute: cellulose microfibrils give tensile strength and lignin gives compressive strength and rigidity. Either alone would be insufficient: pure cellulose walls (as in young, unlignified cells) are not strong enough to resist the negative pressure; once lignified, the wall becomes rigid enough to remain open.
- Step 3: Match this to the table — the correct answer must say lignin is impermeable AND cellulose and lignin together prevent collapse.
Step-by-Step Reasoning
- The four options pair "lignin or cellulose" against "cellulose only / lignin only / cellulose and lignin".
- Eliminate any option that says cellulose is impermeable to water (A, B): cellulose is hydrophilic, so this is wrong.
- Between C and D: C says only cellulose prevents collapse. This is wrong because cellulose microfibrils alone cannot withstand the strong tension in the xylem — lignin is what makes the wall rigid enough to keep the vessel open.
- D correctly identifies lignin as the impermeable component and both cellulose and lignin as the substances that prevent collapse, matching the known structure–function relationship of xylem walls.
Key Takeaways
- Lignin waterproofs xylem walls; cellulose does not.
- Both cellulose and lignin together prevent the xylem vessel from collapsing under the negative pressure of the transpiration stream.
- This is a classic structure–function pairing: hydrophobic, rigid lignin (waterproofing + compression resistance) plus strong cellulose microfibrils (tensile strength).
Common Mistakes
- Choosing B because lignin "feels" like the only structural component: it is the main structural one, but cellulose still contributes tensile strength, so "cellulose and lignin" is the better answer for the collapse-prevention column.
- Choosing A or C because cellulose is the main wall material: cellulose is hydrophilic (so it is not the impermeable substance) and is not the only structural component.
- Confusing the role of lignin (waterproofing + rigidity) with that of suberin in the Casparian strip of endodermal cells — both are waterproofing biopolymers, but only lignin is relevant in mature xylem vessels.
Things to Be Careful About
- Read both columns of the table independently; the right answer must be correct in both columns.
- "Impermeable to water" describes a chemical property (hydrophobicity) and is specific to lignin in xylem.
- "Prevent collapse" describes a mechanical property and is shared by cellulose and lignin working together — the cellulose scaffold resists tension and the lignin matrix resists compression, so neither alone is sufficient for a xylem vessel under full transpirational pull.
The electron micrograph shows a longitudinal section through phloem tissue.
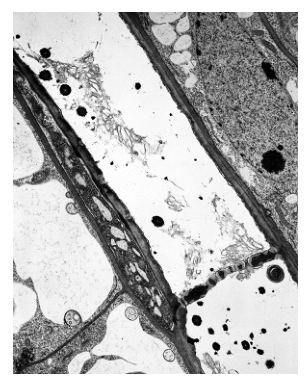
Which student’s drawing of a sieve tube element is correctly drawn and labelled?
Options
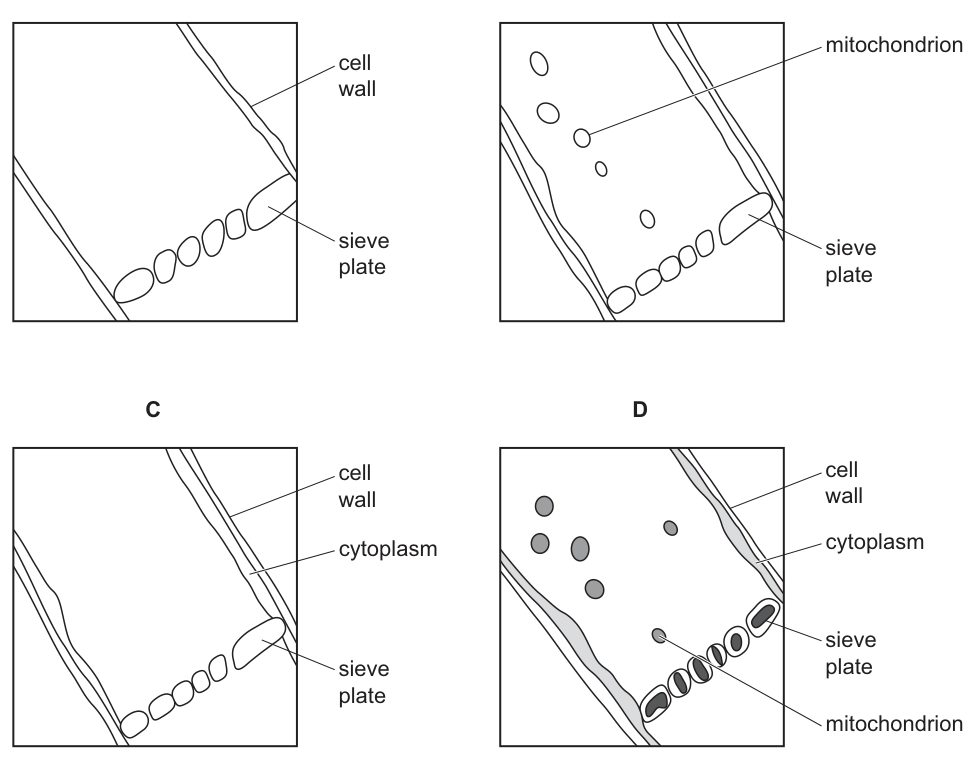
Working
A mature sieve tube element has the following observable features in a longitudinal electron micrograph:
- A cell wall of cellulose, present along the length of the element.
- A sieve plate at the end wall, perforated by pores.
- A thin layer of cytoplasm pressed against the cell wall (the lumen appears mostly empty because the cytoplasm is parietal).
- No nucleus (lost at maturity).
- A few small mitochondria may be present, but only if they are clearly visible in the micrograph.
Evaluating each drawing against these features and against Fig. 27.1:
- A – Shows cell wall and sieve plate only; cytoplasm is missing, so the drawing is incomplete.
- B – Shows a mitochondrion but no cytoplasm; an organelle cannot be correctly labelled as floating free in the lumen, so this is incorrect.
- C – Shows cell wall, sieve plate, and cytoplasm labelled at the periphery of the cell — this matches the appearance in Fig. 27.1 and is biologically accurate.
- D – Shows cell wall, sieve plate, cytoplasm, and mitochondria drawn as large solid filled ovals; these mitochondria are not clearly identifiable in the micrograph and are over-drawn, so this is not a correct observational drawing.
Answer
C
C
Background Concept
Phloem is the plant tissue that translocates organic solutes (mainly sucrose) from sources (e.g. photosynthesising leaves) to sinks (e.g. roots, fruits, growing tips). Its conducting cells are the sieve tube elements (also called sieve tube members), which are joined end-to-end. Where two sieve tube elements meet, the end walls are modified into sieve plates — walls perforated by pores through which phloem sap flows from one element to the next.
A mature sieve tube element is highly specialised:
- It lacks a nucleus (and at full maturity also lacks ribosomes, a Golgi apparatus, and a vacuole/tonoplast).
- It retains a thin, parietal layer of cytoplasm pressed against the cell wall, leaving the central lumen appearing largely empty in electron micrographs.
- It contains a few mitochondria and smooth ER, and P-protein (phloem protein) that helps seal damaged sieve plates.
- Each sieve tube element is closely associated with one or more companion cells, which carry out the metabolic work that the sieve tube element itself cannot perform (the companion cell is nucleate and full of organelles).
The combination of cell wall + sieve plate + reduced (parietal) cytoplasm, with no nucleus, is the diagnostic appearance of a sieve tube element in a longitudinal section.
Understanding the Question
The question shows an electron micrograph (Fig. 27.1) of phloem in longitudinal section, and four student drawings (A–D) of a single sieve tube element. The command word is correctly drawn and labelled, which means two things must both be right:
- The drawing must be biologically accurate — the structures drawn must be the ones a sieve tube element actually has, and they must be drawn in a recognisable way (correct shape, position, and proportions).
- The drawing must match what is observable in the micrograph — anything drawn but not visible in the section is an error of observation.
The labels must also be attached to the correct structure.
Approach
The strategy is to recall the definitive list of features of a mature sieve tube element and then check each drawing against that list and against the micrograph:
- Check that cell wall is present and labelled correctly.
- Check that sieve plate is present and labelled correctly.
- Check whether cytoplasm is shown and correctly labelled (in a sieve tube element, the cytoplasm is reduced and lies against the cell wall).
- Check that no nucleus is drawn (mature sieve tube elements have no nucleus).
- Check that any extra structures (e.g. mitochondria) are actually visible in the micrograph and drawn in a realistic way.
Step-by-Step Reasoning
Drawing A – Cell wall and sieve plate are present, but no cytoplasm is shown or labelled. A sieve tube element does have cytoplasm, however reduced, and Fig. 27.1 shows material lining the walls. The drawing is therefore incomplete and not correct.
Drawing B – Cell wall, sieve plate, and a mitochondrion are shown, but no cytoplasm is labelled or shown lining the cell. An organelle cannot correctly be drawn floating freely inside the lumen of a sieve tube element; the cytoplasm is what lines the wall, and organelles are embedded in it. The drawing is therefore biologically inaccurate even though it contains a real structure (the mitochondrion).
Drawing C – Cell wall, sieve plate, and cytoplasm are shown. The cytoplasm is correctly drawn as a thin layer pressed against the cell wall, and the label points to the right place. This matches the appearance in Fig. 27.1 and is biologically accurate. No nucleus is drawn (correct — mature sieve tube elements lack a nucleus), and no extra unobservable structures are added.
Drawing D – Cell wall, sieve plate, cytoplasm, and mitochondria are shown. While sieve tube elements do possess some mitochondria, the mitochondria in drawing D are drawn as large solid filled ovals, which is not how mitochondria appear in an electron micrograph (they have a double membrane and cristae and are small relative to the cell). They also do not correspond clearly to structures visible in Fig. 27.1. The drawing therefore over-interprets the micrograph and is not correctly drawn.
The drawing that is both biologically accurate and faithfully represents what is observable in the micrograph is C.
Key Takeaways
- A mature sieve tube element has: a cell wall, a sieve plate, a thin parietal layer of cytoplasm, and no nucleus.
- Sieve tube elements are the only nucleate-cell-derived plant cells that lack a nucleus at maturity; this is a defining feature.
- Drawings from electron micrographs must reflect what is actually visible — adding structures that cannot be seen in the section is not creditworthy.
- Companion cells (not sieve tube elements) carry the nucleus and most organelles; the two cell types are functionally a unit.
Common Mistakes
- Drawing a nucleus inside a sieve tube element. Mature sieve tube elements do not have a nucleus; this is a common and serious error.
- Confusing the sieve plate with a normal end wall, or omitting the sieve plate entirely.
- Labelling the lumen of a sieve tube element as a vacuole — mature sieve tube elements lose their tonoplast and have no central vacuole.
- Drawing large, heavily shaded mitochondria; mitochondria in TEMs show a double membrane and cristae, not a solid fill.
- Forgetting the cytoplasm: a sieve tube element still has cytoplasm, just reduced to a thin parietal layer.
Things to Be Careful About
- The question asks for a drawing that is both correct and labelled; a perfectly drawn cell with the wrong label, or the right label on the wrong structure, does not score.
- Sieve tube elements are distinct from xylem vessels (which are dead, have no cytoplasm, and have lignified walls with pits rather than sieve plates) and from companion cells (which are nucleate and packed with organelles). Make sure the drawing depicts the sieve tube element, not one of the adjacent cell types.
- "Correctly drawn" includes correct proportions: the cytoplasm should be a thin layer against the wall, not filling the lumen (which would make it look more like a normal living cell).
Carrier proteins in the cell surface membranes of companion cells are involved in the transfer of assimilates to phloem sieve tubes. The diagram represents the use of two types of carrier protein in this process.
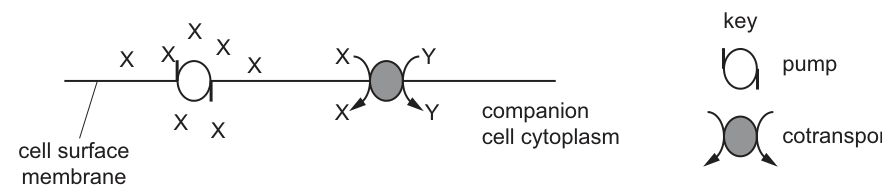
What are the substances labelled X and Y?
Options
| X | Y | |
|---|---|---|
| A | ions | sucrose |
| B | ions | glucose |
| C | sucrose | ions |
| D | glucose | ions |
Working
The pump uses ATP to move X out of the companion cell cytoplasm. The cotransporter then brings X back into the cytoplasm together with Y, indicating that X and Y are co-transported.
In phloem loading:
- A proton pump (H⁺-ATPase) actively pumps H⁺ ions out of the companion cell, using ATP.
- The resulting electrochemical gradient of H⁺ is then exploited by a H⁺/sucrose cotransporter, which allows H⁺ to flow back into the cell down its gradient while simultaneously bringing sucrose into the cell against its concentration gradient.
So X (the substance pumped out and then re-entering via the cotransporter) is H⁺ ions, and Y (the substance entering the cytoplasm along with X) is sucrose.
Answer
A
A
Background Concept
Sucrose produced in photosynthetic cells (sources) must be loaded into phloem sieve tubes for transport to non-photosynthetic tissues (sinks). Loading is an active process because sucrose is moved against its concentration gradient into the companion cell–sieve tube complex. It depends on two carrier proteins working together:
- Proton pump (H⁺-ATPase): uses ATP to actively transport H⁺ ions from the cytoplasm of the companion cell into the surrounding cell wall / apoplast. This creates a steep electrochemical gradient of H⁺ (high H⁺ outside, low inside) and a membrane potential (inside negative).
- H⁺/sucrose cotransporter (symporter): located in the same companion-cell membrane, it allows H⁺ to flow back down its electrochemical gradient INTO the cell. The energy released by H⁺ re-entry is coupled to the simultaneous transport of sucrose INTO the cell, against sucrose's concentration gradient.
Once inside the companion cell, sucrose moves into the sieve tube via plasmodesmata, raising the solute potential inside the sieve tube and drawing water in by osmosis. The resulting turgor pressure drives mass flow of sap towards sinks (the pressure-flow / mass-flow hypothesis).
Understanding the Question
Fig. 28.1 shows a section of the companion-cell plasma membrane. Two carrier proteins are embedded in it:
- An open "pump" symbol with an arrow showing X being moved from inside the cytoplasm to outside (against a gradient, because it is a pump).
- A "cotransporter" symbol with two arrows showing X re-entering the cytoplasm while Y simultaneously moves into the cytoplasm in the same direction.
The question asks which substances are X and Y. X is the substrate common to both carriers — it leaves via the pump and returns via the cotransporter. Y is the additional substance that piggy-backs with X on the cotransporter.
Approach
Identify which ions are pumped out of companion cells using ATP, and which substrate is co-transported with them back in. The classic answer is the H⁺/sucrose symport: H⁺ is pumped out, then re-enters carrying sucrose with it.
Step-by-Step Reasoning
- The pump is described as a carrier protein moving X out of the cytoplasm. P-type ATPases in companion cells pump H⁺ ions out, so X = H⁺. This rules out options C and D, in which X would be a sugar.
- The cotransporter carries X (H⁺) back into the cytoplasm together with Y. The substrate co-transported with H⁺ in phloem loading is sucrose, not glucose (glucose is rarely the transported assimilate in higher plants).
- Therefore Y = sucrose, giving the combination X = H⁺, Y = sucrose, which is option A.
Key Takeaways
- Phloem loading of sucrose depends on an H⁺ gradient established by an ATP-driven proton pump.
- The H⁺ gradient is exploited by an H⁺/sucrose cotransporter (symport), an example of secondary active transport because the energy ultimately comes from ATP used by the pump, not directly by the cotransporter.
- The transported assimilate in flowering plants is overwhelmingly sucrose; glucose is not the major phloem-translocated sugar.
Common Mistakes
- Choosing B (X = H⁺, Y = glucose): confuses the phloem-transported sugar. Glucose is not the main assimilate carried in the phloem of most plants.
- Choosing C (X = sucrose): reverses the role of the pump — sucrose is not actively pumped out; H⁺ is.
- Choosing D (X = glucose): same error as C, with glucose instead of sucrose.
Things to Be Careful About
- Track the direction of each arrow carefully: X leaves via the pump and returns via the cotransporter, so X must be the substance that is recycled (H⁺).
- Remember that the term "cotransporter" implies two different substances move in the same direction (symport) — Y is therefore a different molecule from X, and in companion cells that molecule is sucrose.
- The pump requires ATP (active transport), while the cotransporter is passive and merely exploits the H⁺ gradient the pump creates (secondary active transport overall).
The diagram shows pressure changes during two cardiac cycles.
Which arrow indicates atrial systole?
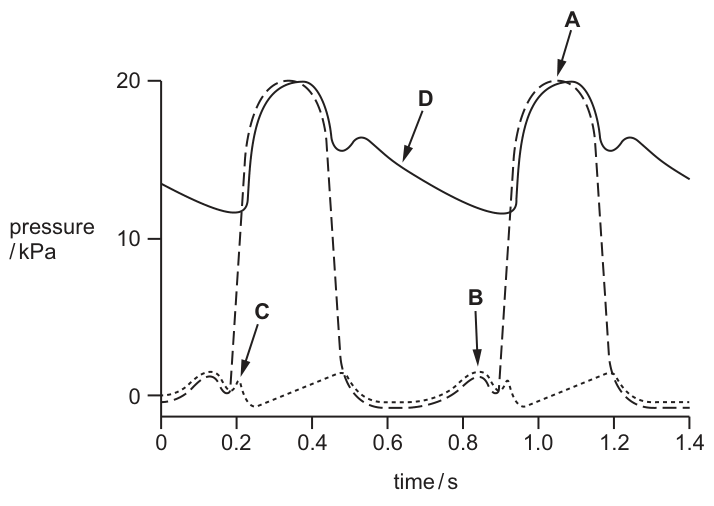
Options
A A
B B
C C
D D
Working
The cardiac cycle consists of atrial systole, ventricular systole, then diastole. Atrial systole is the brief contraction of the atria that tops up the ventricles with blood; it produces a small, short-lived rise in atrial pressure just before the much larger rise in ventricular pressure.
Reading Fig. 29.1:
- Arrow A → peak of the ventricular pressure curve (ventricular systole, ejection phase).
- Arrow B → small rise in atrial pressure immediately before the steep rise in ventricular pressure → atrial systole.
- Arrow C → start of the steep rise in ventricular pressure (start of ventricular systole / isovolumetric contraction).
- Arrow D → the dicrotic notch, caused by closure of the aortic valve at the start of ventricular diastole.
Only arrow B marks the small atrial pressure rise that occurs before the main ventricular contraction, which is the signature of atrial systole.
Answer
B
B
Background Concept
The cardiac cycle is the sequence of pressure and volume changes that occurs during one heartbeat. It is divided into three main phases:
- Atrial systole – the atria contract, pushing the remaining blood into the ventricles. Because atrial walls are thin, the pressure rise is small (only a few kPa).
- Ventricular systole – the ventricles contract powerfully, raising ventricular pressure sharply. When ventricular pressure exceeds aortic pressure, the aortic/pulmonary valves open and blood is ejected. This produces the tall peak seen on the trace.
- Diastole – the whole heart relaxes, the semilunar valves close (producing the dicrotic notch on the aortic trace) and the atrioventricular valves open to refill the ventricles.
The order is always: atrial systole → ventricular systole → diastole. So on a pressure–time graph, the atrial pressure 'blip' must occur just before the large ventricular pressure rise.
Understanding the Question
Fig. 29.1 shows two pressure traces during two cardiac cycles: a solid line for ventricular (and aortic) pressure and a dashed/dotted line for atrial pressure. Four arrows (A, B, C, D) point to different features and you must select the one that shows atrial systole.
The command word is 'indicates', so you need to identify which feature represents atrial contraction.
Approach
Recall the pressure profile of each phase of the cardiac cycle and match each arrow:
- A small, brief pressure rise in the atrial trace occurring immediately before the steep rise in ventricular pressure → atrial systole.
- The peak of the ventricular trace → ventricular systole (peak ejection).
- The start of the steep rise in ventricular pressure → beginning of ventricular systole (isovolumetric contraction, when AV valves close).
- The notch on the descending part of the ventricular pressure curve → closure of the aortic valve at the start of diastole (the dicrotic notch).
Step-by-Step Reasoning
- Arrow A points to the top of the tall ventricular peak (~20 kPa). This is the maximum ventricular pressure during ejection — ventricular systole, not atrial systole.
- Arrow B points to a small bump in the dashed atrial pressure curve that occurs just before the steep rise in ventricular pressure. Because the atria contract first and only briefly, this small pressure rise is exactly where atrial systole appears on the trace.
- Arrow C points to the start of the steep rise in ventricular pressure. This is the moment the ventricle begins to contract (isovolumetric contraction), the start of ventricular systole.
- Arrow D points to a small dip/notch on the way down from the ventricular peak. This is the dicrotic notch, caused by the rebound of blood when the aortic valve snaps shut at the start of diastole.
Only arrow B is the atrial pressure rise that precedes ventricular contraction, so it indicates atrial systole.
Key Takeaways
- Atrial systole produces a small pressure rise in the atrial trace because the atrial walls are thin.
- It occurs just before ventricular systole, so look for a small bump on the atrial trace preceding the large ventricular pressure rise.
- Other landmarks you should be able to identify on a cardiac pressure trace: the ventricular peak (peak ejection), the start of the steep rise (start of ventricular systole) and the dicrotic notch (closure of the aortic valve).
Common Mistakes
- Choosing A because it is the most prominent feature on the graph — but this is ventricular systole, not atrial.
- Choosing C because it is at the start of a big pressure change — but this is the start of ventricular systole.
- Choosing D because it is on the ventricular trace — but this is the aortic-valve closure notch during diastole.
Things to Be Careful About
- The atrial pressure trace is the dashed line near the bottom of the graph; ignore the much larger ventricular/aortic trace when looking for atrial systole.
- The atrial bump is small — do not overlook it in favour of the more obvious ventricular events.
An irregular heartbeat may be the result of ineffective electrical stimulation of the atria.
Which area of the heart could be damaged, causing this irregular heartbeat?
Options
A atrioventricular node
B septum
C Purkyne tissue
D sinoatrial node
Working
The sinoatrial node (SAN), located in the wall of the right atrium, is the heart's pacemaker. It generates the electrical impulses that spread across both atria, causing them to contract. Damage to the SAN disrupts this initial wave of depolarisation across the atria, leading to an irregular atrial rhythm.
- A — atrioventricular node: delays impulse transmission to the ventricles; damage affects ventricular, not atrial, rhythm.
- B — septum: a wall separating the heart's sides; not part of the electrical conduction system.
- C — Purkyne tissue: carries the impulse through the ventricular walls; damage affects ventricular contraction.
- D — sinoatrial node: pacemaker; damage causes an irregular atrial heartbeat.
Answer
D
D
Background Concept
The heart is myogenic — it generates its own electrical impulses rather than relying on nerve stimulation. The rhythmic beating is initiated and coordinated by a specialised conduction system consisting of three main components:
- Sinoatrial node (SAN) — located in the wall of the right atrium. It sets the basic rate of contraction and is therefore called the pacemaker. It generates waves of electrical activity (depolarisation) that spread across the atria, causing atrial contraction.
- Atrioventricular node (AVN) — located between the atria and ventricles. It delays the impulse briefly to ensure the atria finish contracting and emptying before the ventricles contract.
- Bundle of His / Purkyne tissue — carries the impulse from the AVN down through the septum and into the ventricular walls, triggering ventricular contraction from the apex upwards.
A normal heartbeat therefore depends on a wave of depolarisation that begins in the SAN, sweeps over the atria, is delayed at the AVN, and is then distributed through the Purkyne fibres to the ventricles.
Understanding the Question
The question describes an irregular heartbeat specifically linked to ineffective electrical stimulation of the atria. The command word implied is "identify which area could be damaged". We are looking for the structure responsible for initiating electrical activity in the atria.
Approach
Match each option to its function in the conduction system and decide which one, if damaged, would most directly cause faulty atrial electrical stimulation. The atria are stimulated first, so the structure at the start of the conduction pathway — the SAN — is the one whose damage would cause an irregular atrial rhythm.
Step-by-Step Reasoning
- Option D (sinoatrial node) is the pacemaker. It initiates every normal heartbeat. If the SAN is damaged, the atria no longer receive their regular, coordinated wave of depolarisation, and the atrial rhythm becomes irregular. This matches the description in the question precisely.
- Option A (atrioventricular node) sits between the atria and ventricles. It delays the impulse to allow atrial emptying before ventricular contraction. Damage here affects the timing of ventricular contraction (e.g. heart block) — it does not initiate atrial contraction.
- Option B (septum) is the muscular wall separating the left and right sides of the heart. It is not part of the electrical conduction system; damage here relates to structural defects (e.g. septal defects) rather than rhythm.
- Option C (Purkyne tissue) carries the impulse through the ventricular myocardium. Damage would affect the speed and coordination of ventricular contraction, not the atria.
Only the SAN is responsible for generating the electrical activity that stimulates the atria, so D is the correct answer.
Key Takeaways
- The SAN is the heart's natural pacemaker and the source of the electrical impulse that first stimulates the atria.
- The conduction pathway runs: SAN → atria → AVN → Bundle of His → Purkyne fibres → ventricles.
- A damaged SAN leads to an irregular atrial rhythm; a damaged AVN leads to delayed ventricular contraction; damaged Purkyne tissue affects ventricular contraction.
Common Mistakes
- Choosing A (AVN) because it is the most familiar "node" — but the AVN is a delay structure, not the initiator of atrial contraction.
- Choosing C (Purkyne tissue) because it sounds important — but it only distributes the impulse through the ventricles, not the atria.
- Confusing the sinoatrial node with the atrioventricular node: remember "SAN = Starts AN atrial wave".
Things to Be Careful About
- Read the question carefully: it specifies atrial stimulation, so the structure that initiates atrial depolarisation (SAN) is the answer.
- A "regular" heart rhythm in a healthy person is set by the SAN at about 60–100 beats per minute at rest.
- If the SAN is damaged, another part of the conduction system (often the AVN) can take over as a subsidiary pacemaker, but at a slower, less regular rate — this is why a damaged SAN produces an irregular heartbeat.
The diagram shows the effect of three different concentrations of carbon dioxide on the oxygen dissociation curve for human haemoglobin.
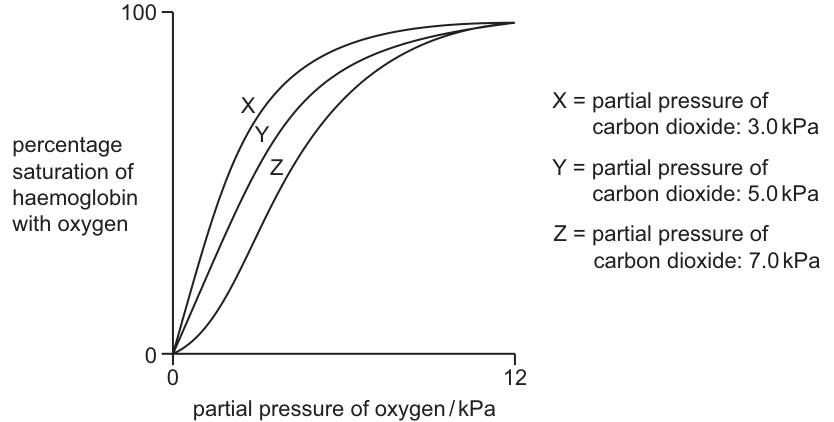
Which effect does increasing carbon dioxide concentration have on haemoglobin?
Options
A It makes haemoglobin less efficient at taking up oxygen and less efficient at releasing oxygen.
B It makes haemoglobin less efficient at taking up oxygen and more efficient at releasing oxygen.
C It makes haemoglobin more efficient at taking up oxygen and less efficient at releasing oxygen.
D It makes haemoglobin more efficient at taking up oxygen and more efficient at releasing oxygen.
Working
Increasing the partial pressure of CO2 shifts the oxygen dissociation curve to the right (the Bohr effect).
- Curve X (CO2 = 3.0 kPa) is furthest left: haemoglobin has the highest affinity for O2 and is the most saturated at any given .
- Curve Z (CO2 = 7.0 kPa) is furthest right: haemoglobin has the lowest affinity for O2 and is the least saturated at any given .
A rightward shift means that, at the low found in respiring tissues, haemoglobin releases more O2 (more efficient at releasing O2). At the high in the lungs, the same rightward shift means a slightly lower percentage saturation, so haemoglobin is less efficient at taking up O2.
Answer
B
B
Background Concept
The oxygen dissociation curve plots the percentage saturation of haemoglobin with O2 (y-axis) against the partial pressure of oxygen, , in the surrounding fluid (x-axis). For human haemoglobin the curve is sigmoid because each of the four haem groups binds O2 cooperatively: once the first O2 is bound, the next sites bind more readily.
The position of this curve is not fixed. Several factors shift it to the left (higher O2 affinity) or to the right (lower O2 affinity):
- Increased CO2 shifts the curve to the right (the Bohr effect).
- Increased temperature shifts it to the right.
- Increased 2,3-BPG (in red cells) shifts it to the right.
- Decreased pH (more H+, produced as CO2 dissolves to form carbonic acid) shifts it to the right.
- Fetal haemoglobin (HbF) lies to the left of adult HbA.
- Myoglobin lies far to the left of any haemoglobin curve.
Mechanistically, CO2 and H+ bind to specific sites on the globin chains and stabilise the deoxygenated (T / tense) form, lowering the protein's affinity for O2.
Understanding the Question
Fig. 31.1 shows three dissociation curves for human haemoglobin at three different CO2 partial pressures:
- X — (leftmost, highest O2 affinity)
- Y — (intermediate)
- Z — (rightmost, lowest O2 affinity)
The command word here is "effect", and the question asks specifically about TWO things: the efficiency of oxygen uptake and the efficiency of oxygen release. The candidate must read the direction of the shift and apply it to two physiological scenarios:
- O2 uptake happens at the lungs, where is high (~12 kPa).
- O2 release happens in respiring tissues, where is low (around 3–5 kPa) and CO2 is high.
Approach
- Identify which direction increasing CO2 moves the curve: it moves it to the right.
- Translate "rightward shift" into behaviour at high (lungs): a slightly lower percentage saturation at the same → LESS efficient at taking up O2.
- Translate "rightward shift" into behaviour at low (tissues): a much lower percentage saturation at the same → haemoglobin unloads more O2 → MORE efficient at releasing O2.
- Match this combination ("less efficient at uptake, more efficient at release") to the options.
Step-by-Step Reasoning
Reading the graph carefully:
- The leftmost curve X (lowest CO2) sits highest at every value, so at the alveolar of ~12 kPa it is essentially 100% saturated. With high CO2 (curve Z), saturation at the same is slightly below 100% — so uptake is slightly less efficient.
- In the tissues, where is around 3–5 kPa, curve X still leaves haemoglobin quite highly saturated (e.g. maybe 50–70%), meaning it holds on to its O2. Curve Z at the same low gives a much lower saturation (e.g. 20–40%), meaning far more O2 has dissociated from the haemoglobin and is available for the respiring cells.
- So increasing CO2 makes haemoglobin LESS efficient at loading O2 in the lungs but MORE efficient at unloading O2 in the tissues.
This combination matches option B exactly.
Key Takeaways
- The Bohr effect: increasing CO2 (or H+ or temperature) shifts the oxygen dissociation curve to the right.
- A rightward shift means a LOWER O2 affinity, which is physiologically beneficial in respiring tissues (where CO2 is being produced) because it promotes O2 release exactly where it is needed.
- Always read the curve at the relevant (high in the lungs, low in tissues) — a curve shift has different consequences at the top and the bottom of the graph.
- A common exam trick: option A sounds plausible because both "less efficient" clauses sound like the same effect, but release and uptake operate at different points on the curve.
Common Mistakes
- Choosing A (both less efficient) — confusing "lower affinity" with overall poorer performance; the lowered affinity is exactly what makes release in the tissues easier.
- Choosing C (more efficient at uptake, less efficient at release) — a leftward shift, the opposite of the Bohr effect, which would be produced by decreasing CO2 (or by fetal haemoglobin).
- Choosing D (both more efficient) — mixing up increased saturation with increased delivery; you cannot have higher saturation AND more O2 released at the same time.
- Reading the graph upside down — note the y-axis starts at 0 at the origin and the leftmost curve is the highest, not the lowest.
Things to Be Careful About
- "More efficient at releasing oxygen" refers to the tissues (low ); "more efficient at taking up oxygen" refers to the lungs (high ). Keep these two physiological contexts separate when you read the curve.
- The rightward shift due to CO2 is a feature, not a bug: it is a finely tuned mechanism to deliver more O2 exactly where CO2 is being produced (i.e. where cells are respiring most actively).
- Examiners reward the precise term "Bohr effect" if a follow-up question asks for the named phenomenon; here they only need the right combination of efficiency statements.
- Always state direction explicitly ("shifts the curve to the right") rather than saying vaguely "alters the curve".
Which reactions will be taking place in blood in a capillary that is next to an alveolus?
1
2
3
key
Hb = haemoglobin
Options
A 1 and 2
B 1 only
C 2 and 3
D 2 only
Working
At a pulmonary capillary next to an alveolus:
- O₂ diffuses from the alveolus into the blood and binds to haemoglobin, so reaction 1 (Hb + 4O₂ → HbO₈) occurs in the forward direction. ✓
- CO₂ diffuses from the blood into the alveolus, so the equilibria for reactions 2 and 3 are driven in the reverse direction. Reaction 2 is running backwards (H₂CO₃ → H₂O + CO₂) and reaction 3 is also running backwards (H⁺ + HCO₃⁻ → H₂CO₃) as HCO₃⁻ re-enters red blood cells, recombines with H⁺, and the H₂CO₃ produced is dehydrated to release CO₂.
Therefore only reaction 1, as written, is taking place in the forward direction.
Answer
B
B
Background Concept
In the lungs, a pulmonary capillary lies alongside an alveolus across a very thin respiratory surface. The two key gases move in opposite directions:
- Oxygen diffuses from the alveolar air (high ) into the blood (low ) and rapidly combines with haemoglobin inside red blood cells to form oxyhaemoglobin.
- Carbon dioxide diffuses from the blood (high ) into the alveolar air (low ) to be breathed out.
In the blood, CO₂ is mainly carried as hydrogencarbonate ions (HCO₃⁻). The conversion of CO₂ to HCO₃⁻ is catalysed by the enzyme carbonic anhydrase inside red blood cells:
This is a reversible pair of reactions. In respiring tissues, where CO₂ is being produced, the equilibria lie to the right (CO₂ is hydrated and dissociated). In the lungs, where CO₂ is being removed, the equilibria are driven to the left (H⁺ and HCO₃⁻ recombine to release CO₂). This is the basis of the chloride shift, in which HCO₃⁻ leaves the red blood cell in exchange for Cl⁻ in the tissues, then re-enters the red blood cell in the lungs.
Understanding the Question
The question gives three reactions and asks which are taking place (in the forward direction as written) in blood in a capillary next to an alveolus. The options combine the reactions in pairs, so the candidate must decide, for each reaction, whether it is proceeding to the right as written or being pushed to the left by the conditions at the alveolar surface.
The single key idea is the direction of CO₂ movement: in a pulmonary capillary, CO₂ is leaving the blood, so any reaction that would consume CO₂ (reaction 2) or release HCO₃⁻ (reaction 3) cannot be proceeding in the forward direction; if anything, they are running backwards.
Approach
Take each reaction in turn and ask: are its reactants being supplied and products being removed at the pulmonary capillary?
- Reaction 1 uses O₂ and produces HbO₈: O₂ is arriving from the alveolus and oxyhaemoglobin is being formed. This proceeds to the right.
- Reaction 2 uses CO₂ to make H₂CO₃: CO₂ is being removed from the blood at the alveolus, so this reaction cannot be running in the forward direction. The reverse (H₂CO₃ → H₂O + CO₂) is what allows CO₂ to be released.
- Reaction 3 uses H₂CO₃ to make H⁺ and HCO₃⁻: in the lungs, HCO₃⁻ is re-entering the red blood cell and combining with H⁺ to re-form H₂CO₃, which is then dehydrated to give CO₂. Reaction 3 is therefore running in reverse.
Step-by-Step Reasoning
- Reaction 1 (Hb + 4O₂ → HbO₈): O₂ is diffusing from alveolus into blood and binding to haemoglobin. This is exactly what happens in the lungs and oxyhaemoglobin is produced. Reaction 1 IS taking place as written. ✓
- Reaction 2 (H₂O + CO₂ → H₂CO₃): The reactant CO₂ is being lost from the blood to the alveolar air, so the equilibrium is driven in the reverse direction. H₂CO₃ (which is being carried to the lungs) is split back into H₂O and CO₂ by carbonic anhydrase. Reaction 2 is NOT taking place as written. ✗
- Reaction 3 (H₂CO₃ → H⁺ + HCO₃⁻): For the same reason, HCO₃⁻ in plasma re-enters the red blood cell, combines with H⁺ (which had been buffered by haemoglobin), and the H₂CO₃ produced then breaks down. The dissociation written in reaction 3 is therefore running in reverse. Reaction 3 is NOT taking place as written. ✗
Only reaction 1 is happening in the forward direction, so the answer is B (1 only).
Key Takeaways
- At gas exchange surfaces, identify the direction in which each gas is moving and decide which way each reversible reaction is driven.
- In a pulmonary capillary, O₂ enters blood (HbO₈ forms) while CO₂ leaves blood (the H₂CO₃/HCO₃⁻ equilibrium runs in reverse).
- The same pair of reactions written forwards describes events at respiring tissues; in the lungs, they run backwards. Many students lose this mark by writing "B and C" or "all of them" because they have memorised the equations without linking their direction to the local / gradient.
Common Mistakes
- Choosing C (2 and 3): common if the student remembers that carbonic anhydrase and the HCO₃⁻/H₂CO₃ system operate in the blood but forgets that in the lungs CO₂ is being released, not absorbed, so the reactions are running in reverse.
- Choosing A (1 and 2): assumes CO₂ is being added to the blood at the alveolus, confusing the lung with a respiring tissue.
- Choosing D (2 only): recognises CO₂ release at the alveolus but overlooks that oxyhaemoglobin formation is the principal event in a pulmonary capillary.
Things to Be Careful About
- "Taking place" means in the forward direction as written. If a reaction is reversible, the candidate must decide which way the equilibrium is being driven locally — at the alveolus, that means to the left for both reactions 2 and 3.
- Reaction 1 is sometimes written as Hb + 4O₂ → Hb(O₂)₄. The equation given (HbO₈) is non-standard but the meaning is the same: haemoglobin is being oxygenated.
- The reactions in the H₂CO₃/HCO₃⁻ system occur inside red blood cells, where carbonic anhydrase is located, not in the plasma; the chloride shift moves HCO₃⁻ in and out of the red cell to keep the system operating in both tissues and lungs.
Which structure of the gas exchange system always contains cartilage?
Options
A alveoli
B bronchiole
C capillary
D bronchus
Working
Cartilage in the gas exchange system holds airways open and prevents collapse during breathing. The trachea, bronchi and smaller branches of the bronchi contain cartilage (as C-shaped rings or irregular plates). Bronchioles, by definition, do not contain cartilage — they have only smooth muscle in their walls. Alveoli are thin-walled gas exchange surfaces and contain no cartilage. Capillaries are blood vessels with a single endothelial layer and no cartilage.
The structure among the options that always contains cartilage is the bronchus.
Answer
D
D
Background Concept
The human gas exchange system is a branching network of tubes that conducts air from the outside to the gas exchange surface (alveoli) and back. Each level of branching has a characteristic wall composition that suits its function:
- Trachea — supported by C-shaped rings of hyaline cartilage (open at the back, where the oesophagus lies). Also contains ciliated epithelium, goblet cells, smooth muscle and elastic fibres.
- Bronchi — the two main airways branching from the trachea into each lung. Their walls also contain cartilage (as irregular plates rather than complete rings), along with ciliated epithelium, goblet cells, smooth muscle and elastic fibres. The cartilage keeps the airway permanently open against the pressure changes of breathing.
- Bronchioles — the smaller branches (diameter < 1 mm) that lead to the alveoli. They have NO cartilage in their walls; instead, they have a relatively thick layer of smooth muscle that can constrict or dilate the airway. They also lack goblet cells (the ciliated epithelium continues briefly but thins out).
- Alveoli — tiny thin-walled sacs where gas exchange occurs. Their walls are a single layer of squamous epithelial cells supported by elastic fibres, with no cartilage.
- Capillaries — the smallest blood vessels; their wall is a single layer of endothelial cells, again with no cartilage.
The key idea: cartilage appears in the larger conducting airways (trachea and bronchi) to keep them patent, but is absent from bronchioles and beyond. The transition where cartilage disappears marks the boundary between bronchi and bronchioles.
Understanding the Question
The command word "always contains" requires the candidate to pick a structure in which cartilage is a permanent, defining feature of the wall — not one where it is sometimes present, nor one where it is found only in nearby larger airways.
The options test exactly that boundary:
- A — alveoli (no cartilage)
- B — bronchiole (no cartilage — this is the textbook distinction from bronchi)
- C — capillary (no cartilage — not even an airway)
- D — bronchus (yes — cartilage plates in the wall)
Approach
Recall the standard distribution of cartilage in the gas exchange system: cartilage is present in the trachea and bronchi but is absent from bronchioles onwards. Match this to the four options to find the one that fits.
Step-by-Step Reasoning
- Cartilage is a rigid supporting tissue. In the gas exchange system it is needed where the airway must remain open against the pressure changes of breathing in and out — i.e. in the larger conducting passages.
- The trachea and the two main bronchi contain cartilage. In the bronchi the cartilage is arranged as irregular plates embedded in the wall, with smooth muscle and elastic fibres completing the wall.
- Bronchioles are defined as the branches that have no cartilage. Their walls contain smooth muscle (which can constrict the lumen, as in asthma) and elastic fibres, but no cartilage. Therefore option B is wrong.
- Alveoli are the blind-ending sacs where gas exchange occurs. Their walls are extremely thin (a single squamous epithelial layer) and contain no cartilage — option A is wrong.
- Capillaries are the smallest blood vessels with a one-cell-thick endothelium. Cartilage is never present in a capillary wall — option C is wrong.
- By elimination and by direct recall, the bronchus (option D) is the only structure in the list that always contains cartilage.
Key Takeaways
- Cartilage is present in the trachea and bronchi but absent from bronchioles onwards — this transition is a defining feature of bronchioles.
- Bronchi contain cartilage as irregular plates, not complete rings (the trachea has C-shaped rings).
- Bronchioles compensate for the lack of cartilage with a relatively thick layer of smooth muscle, which is why they can constrict in conditions like asthma.
- Don't confuse bronchi (with cartilage) and bronchioles (without cartilage) — they are a common MCQ trap.
Common Mistakes
- Choosing B (bronchiole) because the student remembers that "small airways have muscle" but forgets that bronchioles, by definition, lack cartilage.
- Choosing A (alveoli) because alveoli are the "important" gas exchange structures, and students assume important structures have supporting tissue. In fact, gas exchange requires the thinnest possible wall, so cartilage is absent.
- Confusing cartilage with elastic fibres — elastic fibres are present all the way down to the alveoli and allow the lungs to recoil; cartilage is restricted to the larger conducting airways.
Things to Be Careful About
- "Always contains" is the key phrase. Cartilage is a permanent, defining feature of the bronchus wall.
- The bronchus also contains smooth muscle, ciliated epithelium, goblet cells and elastic fibres — but the question asks specifically about cartilage, which is unique to it among the four options.
- Spelling distinction: bronchus (with cartilage) vs bronchiole (without cartilage). Do not let the similarity of the words trick you into choosing B.
Exchange of carbon dioxide and oxygen occurs between air in the alveoli and blood in the capillaries of the lung.
Which partial pressures of the gases will allow gaseous exchange to occur?
Options
| in alveolar air / kPa | in blood / kPa | in alveolar air / kPa | in blood / kPa | |
|---|---|---|---|---|
| A | 5.3 | 6.0 | 13.3 | 13.9 |
| B | 5.3 | 6.0 | 13.9 | 5.3 |
| C | 6.0 | 5.3 | 13.9 | 5.3 |
| D | 6.0 | 5.3 | 13.3 | 13.9 |
Working
Gaseous exchange requires each gas to diffuse down its own partial pressure gradient:
- must move from alveoli (high ) into blood (low ).
- must move from blood (high ) into alveoli (low ).
Checking the options:
- A — in alveoli (13.3) is less than in blood (13.9): O₂ would flow the wrong way. ✗
- B — : 5.3 (alv) < 6.0 (blood) ✓ ; : 13.9 (alv) > 5.3 (blood) ✓
- C — : 6.0 (alv) > 5.3 (blood): CO₂ would flow the wrong way. ✗
- D — both gradients are reversed. ✗
Answer
B
B
Background Concept
Gaseous exchange across the respiratory surface (the alveolar wall) follows Fick's law of diffusion: net movement of a gas occurs down its own partial pressure gradient, from the region of higher partial pressure to the region of lower partial pressure. For two-way exchange at the alveolus:
- Inspired air gives the alveoli a high and a low .
- Deoxygenated blood arriving at the pulmonary capillary has a low and a high (because respiring tissues have consumed O₂ and produced CO₂).
Therefore, in the lung:
- diffuses alveolus → blood
- diffuses blood → alveolus
For gaseous exchange to occur, both gradients must be oriented correctly at the same time.
Understanding the Question
The table gives four candidate sets of partial pressures. The task is to pick the set in which both gases would diffuse in the correct physiological direction across the alveolar–capillary barrier. This is a single-step application of the partial pressure gradient idea to numerical data.
Approach
For each option, check two things:
- Is in the alveolus lower than in the blood? (required for CO₂ to leave the blood)
- Is in the alveolus higher than in the blood? (required for O₂ to enter the blood)
Both must be true.
Step-by-Step Reasoning
| Option | : alv vs blood | Correct? | : alv vs blood | Correct? | Verdict |
|---|---|---|---|---|---|
| A | 5.3 < 6.0 ✓ | CO₂ OK | 13.3 < 13.9 ✗ | O₂ wrong way | reject |
| B | 5.3 < 6.0 ✓ | CO₂ OK | 13.9 > 5.3 ✓ | O₂ OK | accept |
| C | 6.0 > 5.3 ✗ | CO₂ wrong way | 13.9 > 5.3 ✓ | O₂ OK | reject |
| D | 6.0 > 5.3 ✗ | CO₂ wrong way | 13.3 < 13.9 ✗ | O₂ wrong way | reject |
Only option B has the alveoli-air richer in O₂ (13.9 kPa) and poorer in CO₂ (5.3 kPa) than the capillary blood, which is exactly the situation in a real lung.
(For reference, atmospheric / alveolar values are roughly kPa and kPa; the 13.9 kPa figure in option B represents freshly inspired air that has not yet fully equilibrated with the residual volume — close enough to test the principle.)
Key Takeaways
- Gases diffuse independently, each down its own partial pressure gradient.
- In the lung: is higher in alveolar air than in blood; is lower in alveolar air than in blood.
- In respiring tissues the gradients are reversed: higher in blood, higher in tissue.
- A question on gaseous exchange always requires checking both gradients, not just one.
Common Mistakes
- Assuming that as long as "one gas is moving", exchange is happening — both O₂ uptake and CO₂ elimination must occur simultaneously.
- Confusing the partial pressure in the alveolus with that in the blood. A common error is to read the row left-to-right as a simple comparison without checking each pair.
- Forgetting that partial pressure gradients, not concentration gradients, drive gas movement in this context.
Things to Be Careful About
- Always compare the alveolar value with the blood value for the same gas.
- Partial pressure is measured in kPa (or mmHg); do not confuse it with percentage concentration, though they follow the same direction.
- The numbers in the question are typical physiological values — but you do not need to memorise them; the logic of the gradient is enough to answer.
The plan diagram shows a cross-section of a trachea.
Which labelled tissue prevents the trachea from collapsing?
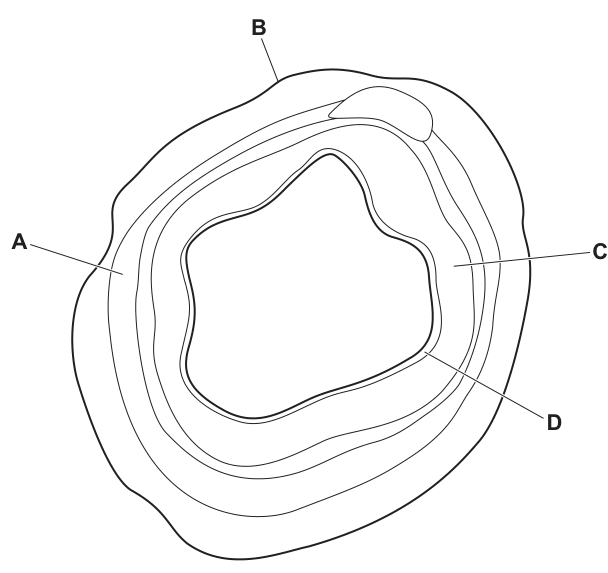
Options
A A
B B
C C
D D
Working
The trachea is held open by rings of cartilage that provide rigid support and prevent the airway from collapsing when the pressure inside the lumen drops during breathing. In the diagram, the cartilage is labelled A.
Answer
A
A
Background Concept
The trachea is the main airway leading from the larynx to the bronchi. To remain patent at all times — particularly during inspiration when intraluminal pressure falls below atmospheric pressure — the tracheal wall contains C-shaped rings of hyaline cartilage. The cartilage is rigid but flexible, providing structural support that prevents the trachea from collapsing when the pressure inside the lumen drops. The open (posterior) part of each C is bridged by the trachealis muscle (smooth muscle) and elastic connective tissue, which allow the trachea to adjust its diameter slightly during swallowing and coughing.
The full wall of the trachea (from lumen outward) consists of:
- Pseudostratified ciliated columnar epithelium with goblet cells lining the lumen, which traps inhaled particles in mucus and sweeps them upward.
- Submucosa containing blood vessels, nerves and seromucous glands.
- C-shaped hyaline cartilage rings providing rigid support.
- Adventitia — outer connective tissue binding the trachea to surrounding structures.
Understanding the Question
The question shows a plan diagram of a cross-section through the trachea with four labels (A, B, C, D) pointing to different tissues in the wall. The candidate must identify which of the four labelled structures is the cartilage that prevents the trachea from collapsing — a structure–function identification task.
Approach
The key biological principle is structure–function: the tissue that prevents the trachea from collapsing is the cartilage, because it is a rigid supporting tissue. In a plan diagram the cartilage appears as a thick, continuous layer forming an open C-shape (with the gap at the back, where the trachealis muscle sits). Once you know what cartilage looks like in a plan, simply match that layer to the corresponding label.
Step-by-Step Reasoning
- Recall the function of each tracheal tissue.
- Cartilage: rigid support, prevents collapse.
- Epithelium: lining, traps and removes particles.
- Smooth muscle (trachealis): alters lumen diameter.
- Connective tissue (adventitia): binds trachea in place.
Only the cartilage prevents collapse.
- Identify the cartilage in the diagram. The thick continuous C-shaped layer in the wall of the trachea is the cartilage. In Fig. 35.1, the label pointing to this cartilage is A.
- Select the answer. A is therefore the correct option.
Why the other options are wrong:
- B — points to a different layer of the tracheal wall that does not provide rigid support; it cannot hold the airway open against a pressure drop.
- C — points to the smooth muscle/connective tissue at the back of the trachea, which alters lumen diameter but does not prevent collapse.
- D — points to the outer connective tissue (adventitia), which binds the trachea to surrounding structures but is too thin and compliant to prevent collapse.
Key Takeaways
- The trachea is held open by C-shaped hyaline cartilage rings.
- The gap at the back of each C is bridged by trachealis smooth muscle, which can narrow the airway slightly.
- Plan diagrams use conventions: layers are drawn as continuous lines, no individual cells, and labels point to whole tissues.
- Structure–function questions on plan diagrams are answered by matching each labelled tissue to its known function.
Common Mistakes
- Confusing the cartilage with smooth muscle. Both are in the tracheal wall, but only the cartilage provides rigid support.
- Choosing the epithelium because it is "inside" the trachea. The epithelium is a lining, not a supporting tissue.
- Choosing connective tissue because it is "outer" and seems protective. Outer connective tissue binds the trachea in place but does not prevent collapse on its own.
- Choosing the smooth muscle because it is "muscular and strong". Smooth muscle in the trachea is designed to alter lumen diameter, not to provide rigid support.
Things to Be Careful About
- On a plan diagram, identify the tissue by its layer position and thickness, not just by which side of the section it is on.
- Cartilage appears as a thick, continuous layer in the tracheal wall — much thicker than the other layers.
- The C-shape of the cartilage is open at the posterior (back) side, where the trachealis muscle sits.
- The lumen of the trachea is never supported by cartilage directly; the cartilage is in the wall, surrounding the lumen.
Which layers of cells does an oxygen molecule diffuse through when moving from an alveolus into an alveolar capillary?
Options
| alveolus | alveolar capillary | |
|---|---|---|
| A | squamous epithelium | squamous epithelium |
| B | endothelium | squamous epithelium |
| C | squamous epithelium | endothelium |
| D | endothelium | endothelium |
Working
The alveolus is lined by a single layer of flat cells called squamous epithelium (Type I pneumocytes). The lumen of the alveolar capillary is lined by a single layer of flat endothelial cells (endothelium). An oxygen molecule therefore passes through squamous epithelium first, then endothelium.
Answer
C
C
Background Concept
The gas exchange surface in the human lung is built to be as thin as possible so that oxygen and carbon dioxide can diffuse across it rapidly. The barrier between the air in an alveolus and the blood inside an alveolar capillary consists of three components, all very thin:
- Alveolar wall — squamous epithelium. The inside of each alveolus is lined by a single layer of extremely flat cells, the Type I pneumocytes. Because they are flat (squamous), this layer is sometimes called the squamous epithelium of the alveolus. Its thinness minimises the diffusion distance for gases.
- Fused basement membranes. The basement membranes of the alveolar epithelium and the capillary endothelium are pressed together and partially fused, eliminating an extra tissue layer.
- Capillary wall — endothelium. The lumen of every blood capillary, including those that wrap around alveoli, is lined by a single layer of flattened endothelial cells. This is the endothelium.
Note that endothelium is itself a kind of simple squamous epithelium histologically, but in CIE Biology the term endothelium is reserved specifically for the lining of blood and lymph vessels, and the lining of the alveolus is called squamous epithelium. The question is therefore testing whether you know which name is used in which location.
Understanding the Question
The question is a multiple-choice item with a small two-column table. You are told that an oxygen molecule starts inside the alveolus and finishes inside the alveolar capillary. The two columns ask you to name (a) the cell layer it crosses to leave the alveolus, and (b) the cell layer it crosses to enter the capillary. The four options pair the terms squamous epithelium and endothelium with each location in every possible combination; only one pairing is biologically correct.
The command word is implicit: identify, by name, the two tissues along the diffusion path.
Approach
- Recall the name of the cell layer on the air side of the barrier — the alveolar lining.
- Recall the name of the cell layer on the blood side of the barrier — the capillary lining.
- Match these to the columns in the table.
Step-by-Step Reasoning
- The alveolus is part of the respiratory tract, not the circulatory system. Its wall is therefore an epithelium, and because the cells are very flat it is described as squamous epithelium (also accepted: Type I pneumocytes / alveolar epithelium).
- The capillary is a blood vessel, so its inner lining is, by definition, endothelium — a simple squamous epithelium that lines all blood and lymphatic vessels. CIE marks the term "endothelium" specifically for vascular linings.
- Therefore, moving from the alveolus to the capillary, oxygen crosses squamous epithelium first and endothelium second. That is row C.
- Why the other options fail:
- A swaps the correct names — both layers are not squamous epithelium (the capillary is endothelium), and using "squamous epithelium" for the capillary is the loose histological description that CIE does not credit.
- B has "endothelium" on the alveolus — the alveolus is not a blood vessel, so this is wrong.
- D has "endothelium" on both sides — the alveolar lining is not endothelium.
Key Takeaways
- The gas exchange barrier has three components: alveolar squamous epithelium, fused basement membranes, and capillary endothelium. The candidate only names the two cellular layers; the basement membrane is often elided.
- "Squamous epithelium" describes the alveolus; "endothelium" describes the capillary.
- Although endothelium is histologically a simple squamous epithelium, in A-level Biology the two terms are not interchangeable: the location determines the name.
Common Mistakes
- Writing "squamous epithelium" for the capillary because both tissues are flat. CIE expects the term "endothelium" for a blood-vessel lining.
- Confusing "endothelium" with "epithelium" generally and placing it on the alveolus.
- Thinking there are more than two cell layers to cross (e.g. adding "mesothelium" or "connective tissue"). In the thinnest part of the barrier, only two cells separate air and blood, and there is no significant connective tissue.
Things to Be Careful About
- Use the exact tissue name required by the mark scheme: squamous epithelium for the alveolus, endothelium for the capillary.
- Do not write "pavement epithelium", "flat cells" or "Type I pneumocytes" as substitutes unless the mark scheme explicitly allows them; on this style of question the two key terms are what earn the mark.
- The two are joined by a common basement membrane, but the question only asks about the cell layers, so no extra layer should be listed.
Bacteria may be classified according to differences in cell wall structure. The differences are shown by using the Gram stain.
The diagram shows part of a Gram-positive bacterium and part of a Gram-negative bacterium, drawn to the same scale.
The antibiotic penicillin kills bacteria by inhibiting the synthesis of the cell walls during bacterial cell growth.
Which type of bacteria will be killed by penicillin more easily and why?
Options
A Gram-positive bacteria because the peptidoglycan layer is exposed to penicillin directly
B Gram-positive bacteria because it has a thinner layer surrounding the cell membrane overall
C Gram-negative bacteria because the thin peptidoglycan layer can be broken down faster
D Gram-negative bacteria because there is more periplasm available, which gives a weaker structure
Working
Penicillin inhibits the synthesis of peptidoglycan in bacterial cell walls by blocking the transpeptidase enzymes that cross-link peptidoglycan chains. Looking at Fig. 37.1:
- Gram-positive bacteria have a thick peptidoglycan layer exposed directly to the external environment, so penicillin can readily reach and inhibit its target enzymes.
- Gram-negative bacteria have an outer membrane (carbohydrate and lipid) covering a thin peptidoglycan layer, which acts as a barrier protecting peptidoglycan synthesis from penicillin.
Therefore, Gram-positive bacteria are killed more easily because their peptidoglycan layer is directly accessible to penicillin.
Answer
A
A
Background Concept
Bacterial cell walls contain a rigid mesh-like polymer called peptidoglycan (also called murein), which is made of alternating sugars (NAG and NAM) cross-linked by short peptide chains. This structure gives the bacterial cell its shape and protects it from osmotic lysis.
The Gram stain differentiates bacteria into two main groups based on their cell wall architecture:
- Gram-positive bacteria possess a single, thick peptidoglycan layer (20–80 nm) lying outside the cell surface (plasma) membrane. With Gram staining, they retain the crystal violet–iodine complex and appear purple.
- Gram-negative bacteria have a much thinner peptidoglycan layer (1–3 nm) sandwiched between the cell surface membrane and an additional outer membrane composed of lipid and carbohydrate (including lipopolysaccharide). They do not retain the stain and appear pink/red after counterstaining.
Penicillin is a β-lactam antibiotic. It works by binding to and inhibiting transpeptidase (also called penicillin-binding protein, PBP), the enzyme that cross-links peptide chains between adjacent peptidoglycan strands. When cross-linking is blocked, the cell wall becomes mechanically weak and the bacterium bursts from osmotic pressure during growth.
Understanding the Question
This question asks which group of bacteria is more susceptible to penicillin and, crucially, why. The diagram (Fig. 37.1) shows the structural differences between the two cell wall types drawn to the same scale. The key biological insight is that penicillin's target is peptidoglycan synthesis, so accessibility of that target determines susceptibility.
Approach
- Identify the target of penicillin: peptidoglycan cross-linking enzymes located in the cell wall.
- Compare the layers between the two cell wall types to see which presents a barrier to penicillin reaching its target.
- Conclude that the bacterium whose peptidoglycan is more directly accessible to penicillin will be killed more easily.
Step-by-Step Reasoning
- In the Gram-positive bacterium (top of Fig. 37.1), the thick peptidoglycan layer is the outermost layer; only a thin periplasm separates it from the cell surface membrane. Penicillin molecules in the surrounding medium can diffuse straight to the transpeptidase enzymes embedded in the peptidoglycan, where they bind and inhibit cell wall synthesis.
- In the Gram-negative bacterium (bottom of Fig. 37.1), the peptidoglycan layer is thin and protected by an outer membrane of carbohydrate and lipid. This outer membrane acts as a permeability barrier, slowing the entry of penicillin to the peptidoglycan layer and the transpeptidase enzymes within.
- This is why option A is correct: Gram-positive bacteria are killed more easily because the peptidoglycan layer is exposed to penicillin directly.
- Option B is wrong: although the Gram-positive envelope outside the cell membrane is thick, the reason is not "thinner layer surrounding the cell membrane" — that would be confusing. The reason is direct exposure, not overall thickness relative to the cell membrane.
- Option C is wrong: a thinner peptidoglycan layer does not mean it is broken down faster; the outer membrane of Gram-negative bacteria impedes penicillin access, so Gram-negatives are generally more resistant to penicillin, not more susceptible.
- Option D is wrong: more periplasm does not give a weaker structure in any relevant sense, and Gram-negative bacteria are not more susceptible to penicillin on this basis.
Key Takeaways
- Penicillin's target is peptidoglycan synthesis (specifically transpeptidase cross-linking).
- Gram-positive bacteria are generally more susceptible to penicillin because their thick peptidoglycan is the outermost layer and directly accessible.
- Gram-negative bacteria are generally more resistant because the outer membrane (lipopolysaccharide layer) impedes penicillin from reaching the thin peptidoglycan layer.
- This principle underlies why different antibiotics are used against different bacteria, and why antibiotic resistance (e.g., via altered PBPs or modified outer membranes) is a clinical concern.
Common Mistakes
- Choosing B because "thinner layer surrounding the cell membrane overall" — this misreads the diagram; the question is about which cell wall is more exposed to penicillin, not which has a thinner envelope.
- Choosing C or D because thinner peptidoglycan or more periplasm sounds like a weakness — in reality, the outer membrane in Gram-negatives is a protective barrier that limits penicillin entry, making them harder to kill with standard penicillin.
- Confusing Gram-positive and Gram-negative cell wall arrangements (e.g., stating that Gram-positives have an outer membrane).
Things to Be Careful About
- Always read the question's "why" carefully — the mark scheme requires both the bacterium type and the correct mechanistic reason (direct exposure of peptidoglycan).
- "Periplasm" in this diagram refers to the aqueous compartment between the cell surface membrane and either the peptidoglycan (Gram-positive) or the outer membrane (Gram-negative). It is not itself the penicillin target.
- Penicillin works only on growing bacteria that are actively synthesising new peptidoglycan; it does not directly attack existing cell wall.
Which facts relate to the disease TB or its pathogen?
1 Viruses change their antigens to a limited extent.
2 TB is caused by only one species of pathogen.
3 HIV/AIDS makes the bacterial infection worse.
4 The pathogen may be transmitted by ingestion.
5 The pathogen may be transmitted from animals.
6 Multi-drug resistance occurs.
Options
A 1, 4, 5 and 6
B 1, 2 and 6
C 2, 3 and 5
D 3, 4, 5 and 6
Working
Evaluating each statement:
- Viruses change their antigens to a limited extent. — FALSE: TB is caused by a bacterium, not a virus; antigenic variation is a feature of viruses like influenza/HIV.
- TB is caused by only one species of pathogen. — FALSE: TB is caused by Mycobacterium tuberculosis, M. bovis and M. africanum (more than one species).
- HIV/AIDS makes the bacterial infection worse. — TRUE: HIV/AIDS suppresses the immune system, worsening TB infection.
- The pathogen may be transmitted by ingestion. — TRUE: M. bovis can be transmitted via unpasteurised milk.
- The pathogen may be transmitted from animals. — TRUE: cattle (and other animals) can transmit M. bovis to humans.
- Multi-drug resistance occurs. — TRUE: MDR-TB is a well-documented problem.
Statements 3, 4, 5 and 6 are correct.
Answer
D
D
Background Concept
Tuberculosis (TB) is an infectious disease caused by bacteria of the genus Mycobacterium. The principal species is Mycobacterium tuberculosis, but M. bovis (cattle) and M. africanum (West Africa) can also cause TB in humans. The bacterium is spread primarily by airborne droplet infection when an infected person coughs or sneezes (respiratory route), but M. bovis can additionally be transmitted to humans through drinking unpasteurised milk from infected cattle (ingestion route).
HIV/AIDS destroys CD4⁺ T-helper lymphocytes, progressively weakening the cell-mediated immune response. Because defence against intracellular pathogens like Mycobacterium depends heavily on T-helper cells, HIV co-infection dramatically worsens TB — reactivation of latent TB and progression to active disease are much more likely in HIV-positive individuals.
Multi-drug resistant TB (MDR-TB) arises when M. tuberculosis strains become resistant to the two first-line antibiotics (isoniazid and rifampicin), often through incomplete or inappropriate courses of treatment. Extensively drug-resistant TB (XDR-TB) adds resistance to fluoroquinolones and at least one injectable agent.
Understanding the Question
This is a multiple-choice item asking the candidate to identify which of six statements correctly apply to TB or its pathogen. Each statement must be evaluated individually against knowledge of TB biology, transmission, co-infection and drug resistance, and only those that are TRUE should be selected. The question type tests precise recall rather than a single definitional fact.
Approach
Go through each numbered statement one by one, decide TRUE or FALSE, then match the resulting set against the answer options. Eliminate statements that do not relate to TB (e.g. those about viruses) and those that are factually wrong about TB (e.g. "only one species").
Step-by-Step Reasoning
- Statement 1 — FALSE. This describes antigenic variation in viruses such as influenza or HIV, not TB. TB is caused by a bacterium (Mycobacterium), so a statement about viruses does not apply.
- Statement 2 — FALSE. TB is caused by several species within the M. tuberculosis complex: M. tuberculosis, M. bovis and M. africanum. Saying "only one species" is incorrect.
- Statement 3 — TRUE. HIV/AIDS destroys T-helper lymphocytes, which are central to the immune defence against Mycobacterium. HIV-positive individuals are far more susceptible to TB and to reactivation of latent TB, so the bacterial infection is made worse.
- Statement 4 — TRUE. M. bovis can be transmitted to humans via ingestion of unpasteurised milk from infected cattle — a recognised route, which is why milk is pasteurised.
- Statement 5 — TRUE. Cattle (and other animals such as badgers in the UK context) can act as reservoirs for M. bovis, transmitting it to humans — an example of a zoonotic transmission route.
- Statement 6 — TRUE. Multi-drug resistant TB (MDR-TB) is a major global health problem, arising from incomplete treatment courses and patient non-compliance.
The true statements are 3, 4, 5 and 6, which matches option D.
Key Takeaways
- TB is caused by multiple Mycobacterium species, not just one.
- TB is transmitted primarily by respiratory droplets, but M. bovis adds ingestion (unpasteurised milk) and zoonotic (animal) routes.
- HIV/AIDS co-infection severely worsens TB because T-helper cells are the main defence against intracellular Mycobacterium.
- Drug resistance (MDR-TB, XDR-TB) is a defining feature of TB epidemiology and a key reason for Directly Observed Treatment, Short-course (DOTS) programmes.
Common Mistakes
- Selecting statement 1 because "antigenic change" is a familiar infectious-disease idea — but this is a viral feature, not bacterial, and so does not apply to TB.
- Selecting statement 2 because TB is often described as a single disease — but the question is about the pathogen species, of which there are several.
- Selecting statement 4 but forgetting statement 5, or vice versa, when both are true aspects of the M. bovis route.
Things to Be Careful About
- The wording "only one species" is the trap in statement 2 — the M. tuberculosis complex contains multiple species.
- "Multi-drug resistance" must not be confused with resistance to a single drug; the term specifically means resistance to at least isoniazid and rifampicin.
- Zoonotic transmission (statement 5) and ingestion (statement 4) both come from the same M. bovis route, so it is easy to miss one — they are independent marking points.
The events listed occur during the primary immune response to a specific pathogen.
1 activation of B-lymphocyte to produce plasma cells and memory cells
2 phagocytosis of invading pathogens by macrophages
3 T-helper cell activation and production of T-killer cells
4 expression of antigens on phagocyte cell surface
5 production and release of antibodies
Which row identifies a correct sequence of events?
Options
| first | last | ||||
|---|---|---|---|---|---|
| A | 5 | 1 | 2 | 4 | 3 |
| B | 2 | 4 | 3 | 1 | 5 |
| C | 4 | 2 | 1 | 5 | 3 |
| D | 4 | 2 | 3 | 1 | 5 |
Working
In the primary immune response the cellular events must precede the humoral events:
- Macrophages first phagocytose the invading pathogens (event 2).
- After digesting the pathogen, the macrophage expresses (presents) antigens on its cell surface (event 4).
- A T-helper cell recognises the presented antigen and is activated, leading to the production of T-killer cells (event 3).
- The activated T-helper cell then activates a B-lymphocyte to divide and differentiate into plasma cells and memory cells (event 1).
- The plasma cells produce and release antibodies specific to the antigen (event 5).
This gives the sequence 2 → 4 → 3 → 1 → 5, which matches option B.
Answer
B
B
Background Concept
The primary immune response is the body's first encounter with a specific pathogen. It has two interlocking arms:
- Cellular (cell-mediated) response — carried out by phagocytes (macrophages and neutrophils) and T-lymphocytes. It deals with infected cells and is also essential for activating the humoral response.
- Humoral (antibody-mediated) response — carried out by B-lymphocytes, which differentiate into plasma cells that secrete antibodies.
The two arms are linked: T-helper cells, once activated, release cytokines that stimulate B-lymphocytes to proliferate and differentiate. Antibodies can only be made after this T-cell help has been received, so antibody production is always the final step in the sequence.
Understanding the Question
The question lists five events and asks the candidate to identify a biologically correct order, with the first event on the left and the last on the right. The key is to recognise that some events cause others: antigen presentation can only happen after phagocytosis; T-helper activation can only follow antigen presentation; B-cell activation requires T-helper help; antibody production only follows plasma cell formation.
The command word is implicit ("which row identifies a correct sequence") — only one logical chain is needed, not a description.
Approach
Anchor the order to physical reality: a pathogen must first be engulfed before its antigens can be displayed, T-cells must see antigen before they can be activated, B-cells must receive T-cell help before they can become antibody factories. Then map each numbered event to its place in that chain.
Step-by-Step Reasoning
- Phagocytosis (2) comes first. A macrophage encounters the pathogen at the site of infection and engulfs it, breaking it down inside a phagolysosome. Nothing else in the list can occur before this — the antigen has to be inside the phagocyte before it can be presented.
- Antigen expression (4) is next. Once the pathogen is digested, peptide fragments are loaded onto MHC class II molecules and displayed on the macrophage's surface. This is the moment at which the adaptive immune system is alerted.
- T-helper cell activation and T-killer cell production (3) follow. A T-helper cell with a complementary receptor binds the displayed antigen and becomes activated. Activated T-helper cells then release cytokines that drive the proliferation of T-killer cells (and, in the next step, B-cells).
- B-lymphocyte activation (1) comes after T-helper help. The activated T-helper cell presents antigen to a matching B-lymphocyte and releases cytokines; the B-cell then proliferates and differentiates into plasma cells and memory cells.
- Antibody production and release (5) is last. Plasma cells secrete antibodies specific to the original pathogen's antigen.
This yields the order 2 → 4 → 3 → 1 → 5, which is option B.
Why the other options fail:
- A (5 → 1 → 2 → 4 → 3): begins with antibody release — impossible, since no plasma cells yet exist and no antigen has been processed.
- C (4 → 2 → 1 → 5 → 3): has antigen expression (4) before phagocytosis (2) — antigens can only be displayed after the pathogen has been engulfed and processed.
- D (4 → 2 → 3 → 1 → 5): the same flaw — event 4 (antigen expression) is placed before event 2 (phagocytosis), which is biologically impossible.
Key Takeaways
- The primary response always begins with a non-specific, innate step (phagocytosis) and only then engages the specific, adaptive response (T- and B-lymphocytes).
- Antigen presentation by the phagocyte is the bridge between the innate and adaptive systems.
- Antibody secretion is the terminal event of the primary response, not the beginning.
Common Mistakes
- Putting antibody production early because antibodies are the most familiar immune product — they cannot exist before the B-cell has been activated and differentiated into a plasma cell.
- Confusing the order of antigen presentation and phagocytosis; presentation requires the pathogen to have already been engulfed and partially digested.
- Treating T-killer cell production as an end in itself; in this sequence the critical role of T-helper activation is to license the subsequent B-cell response.
Things to Be Careful About
- "Expression of antigens on phagocyte cell surface" specifically refers to antigen presentation on MHC class II, not to the antigens originally on the pathogen's surface.
- "Activation of B-lymphocyte" in this list is the step that produces plasma cells and memory cells; memory cells generated here underpin the faster, stronger secondary response.
- Note that the question does not ask about the time scale of each step (some, like antibody release, take days; others, like phagocytosis, take minutes) — it asks only about order.
Influenza is an infectious disease caused by a virus.
It is possible to have influenza more than once.
Which statements explain why it is possible to have influenza more than once?
1 The viral antigens change as a result of mutations.
2 The immune system may be weak and make few B-memory cells.
3 Untreated HIV infection has resulted in a low T-helper cell count.
Options
A 1, 2 and 3
B 1 and 2 only
C 1 and 3 only
D 2 and 3 only
Working
Evaluate each statement:
-
The viral antigens change as a result of mutations. — TRUE. Influenza virus undergoes antigenic drift (point mutations) and antigenic shift (reassortment), producing new haemagglutinin (H) and neuraminidase (N) surface antigens. Memory cells from a previous infection do not recognise these altered antigens, so a new primary response is mounted and the person becomes ill again.
-
The immune system may be weak and make few B-memory cells. — TRUE. If the immune system is weak (e.g. malnourished, very young, elderly), the primary response produces insufficient B-memory cells, so the rapid, strong secondary response cannot occur on re-exposure.
-
Untreated HIV infection has resulted in a low T-helper cell count. — TRUE. HIV infects and destroys T-helper (CD4+) cells, which are required to stimulate B-cells to proliferate and differentiate into plasma cells and B-memory cells. With few T-helper cells, the adaptive immune response is severely impaired, so the body cannot mount an effective response even to a strain of influenza it has encountered before.
All three statements are correct.
Answer
A
A
Background Concept
Influenza is caused by an RNA virus whose surface carries two key glycoprotein antigens: haemagglutinin (H) and neuraminidase (N). The immune system normally combats viral infection through the adaptive immune response: B-lymphocytes produce antibodies against the viral antigens, while T-lymphocytes destroy infected host cells. After an infection, memory B-cells and memory T-cells persist in the body, so that if the same pathogen is encountered again, the secondary response is faster, stronger, and often eliminates the pathogen before symptoms develop — this is the basis of long-term immunity.
However, influenza is unusual in that people can suffer from it many times. This is explained by three independent (but sometimes overlapping) immunological mechanisms:
- Antigenic variation of the virus (point mutations = antigenic drift; reassortment of genome segments between strains = antigenic shift), which produces antigens the memory cells do not recognise.
- A weak or underdeveloped immune system, which fails to generate sufficient memory cells in the first place, so the secondary response cannot occur effectively.
- HIV infection, which destroys the T-helper (CD4+) cells needed to activate both B-cells and cytotoxic T-cells, collapsing the adaptive response.
Understanding the Question
The question is an MCQ (Paper 1 style) that asks which of three statements correctly explain why someone can have influenza more than once. The correct answer requires all three to be valid explanations, since option A is "1, 2 and 3". Each statement must therefore be assessed on its own immunological merits.
The command word is implicitly "identify which statements explain…" — i.e. we are judging each statement as a true or false reason, then combining the trues to choose among the four options.
Approach
Work through each numbered statement one at a time, decide whether it is a valid reason for repeat influenza infection, and then look for the option whose combination matches the trues. The strategy is:
- For (1) — recall antigenic drift/shift in influenza and connect to loss of memory-cell recognition.
- For (2) — recall the role of B-memory cells in the secondary response, and the conditions under which their production is impaired.
- For (3) — recall how HIV destroys T-helper cells and the consequences for B-cell activation and antibody production.
- Combine: all three true → answer A.
Step-by-Step Reasoning
Statement 1 — The viral antigens change as a result of mutations.
Influenza virus has a single-stranded RNA genome that the viral RNA polymerase copies without proofreading, so point mutations accumulate rapidly. This is called antigenic drift. Less frequently, two different influenza strains infect the same cell and reassort their genome segments, producing a brand-new combination of H and N proteins — this is antigenic shift (e.g. the H1N1 pandemic strain of 2009). Either way, the surface antigens presented to the immune system change. Memory B-cells generated during a previous infection are specific for the old H and N shapes and no longer bind the new ones effectively, so the body mounts a fresh primary response and the person falls ill again. Statement 1 is correct.
Statement 2 — The immune system may be weak and make few B-memory cells.
For a strong, lasting secondary response, the primary infection must generate a large population of B-memory cells. If the immune system is weak — for instance in very young children, the elderly, malnourished individuals, or people on immunosuppressive drugs — the primary response is sub-optimal. Few B-memory cells are produced, so when the same strain of influenza reappears, the body cannot mount a swift, high-titre antibody response, and the person becomes ill a second time. Statement 2 is correct.
Statement 3 — Untreated HIV infection has resulted in a low T-helper cell count.
HIV binds to the CD4 receptor on T-helper cells and, over years of untreated infection, progressively destroys them. T-helper cells are the central coordinators of the adaptive immune response: they activate B-cells (causing clonal expansion and differentiation into plasma cells and B-memory cells) and they activate cytotoxic T-cells. With a depleted T-helper cell population, B-cells are poorly stimulated, antibody production is low, and memory-cell generation is impaired. The result is that the patient cannot effectively combat influenza even with a strain their immune system has seen before. Statement 3 is correct.
Combining the three trues: all of 1, 2 and 3 are valid explanations. This corresponds to option A.
Key Takeaways
- Influenza can be caught repeatedly because the virus changes its antigens (antigenic drift and shift), because the host's immune system may be too weak to produce enough memory cells, and because HIV can collapse the adaptive response by destroying T-helper cells.
- Memory cells are specific: a change in the antigen they recognise can render them useless, even though the body technically "remembers" the old version.
- T-helper cells are essential for B-cell activation; without them, the entire humoral response is compromised — this is why HIV/AIDS patients suffer from so many opportunistic infections including severe influenza.
Common Mistakes
- Choosing B (1 and 2 only) — forgetting that HIV-induced T-helper cell depletion is a well-established reason for poor immunity to influenza and many other pathogens.
- Choosing C (1 and 3 only) — underestimating how common a weak immune response is in the very young and elderly, both of whom are known to be at high risk of repeated or severe influenza.
- Choosing D (2 and 3 only) — incorrectly rejecting the antigenic variation argument, which is the single most important reason influenza vaccines must be reformulated each year.
- Thinking "HIV only affects helper T-cells so it only matters for cell-mediated immunity" — false, because T-helper cells are also required for B-cell activation and antibody production.
Things to Be Careful About
- Distinguish antigenic drift (small point mutations, gradual change) from antigenic shift (sudden major change from reassortment, can cause pandemics). Both result in changed antigens.
- The question says "it is possible to have influenza more than once" — every statement only needs to explain one way this can happen, not all ways.
- Read MCQ options carefully: "1 and 2 only" type options mean exactly those two, not "at least those two".
- Memory cells are produced in the primary response, not in the secondary response; the secondary response simply activates the existing memory cells much faster.
Your score so far
Answer a question to start scoring
Your marks add up here as you work through the paper.