Biology 9700/36 — October/November 2023
Cambridge AS Level · Advanced Practical Skills · worked solutions for every part, with the mark scheme
Topics Presentation of Data and Observations · Analysis, Conclusions and Evaluation · Manipulation, Measurement and Observation · Use of the Light Microscope
Agar stained with universal indicator can be used to investigate diffusion.
When hydrochloric acid diffuses into the agar it changes the colour from green to pink.
You will investigate the diffusion of different concentrations of hydrochloric acid in agar.
You are provided with the materials shown in Table 1.1.
Table 1.1
| labelled | contents | hazard | volume / |
|---|---|---|---|
| H | hydrochloric acid | irritant | 20 |
| W | distilled water | none | 30 |
| 2 Petri dishes containing agar | none | — | |
| sheet T | sheet T | — | — |
If H comes into contact with your skin, wash off immediately with cold water.
It is recommended that you wear suitable eye protection.
You will need to:
- prepare different concentrations of hydrochloric acid, H
- measure the diffusion distance for each concentration of hydrochloric acid.
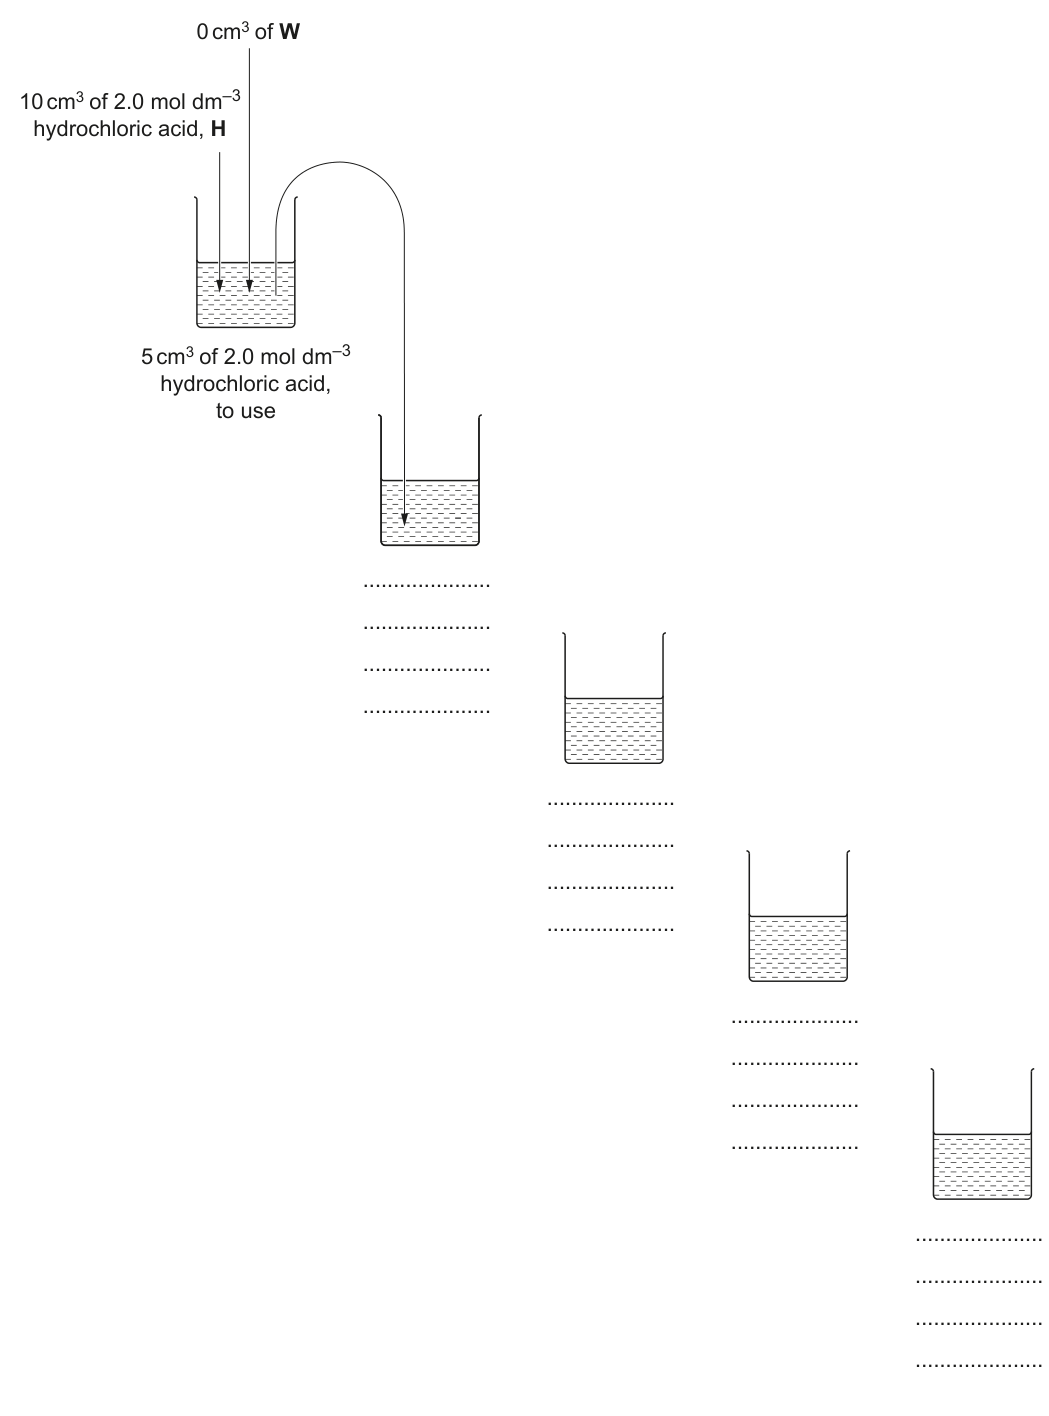
You will need to carry out a serial dilution of the hydrochloric acid, H, to reduce the concentration by half between each successive dilution.
You will need to prepare four concentrations of hydrochloric acid in addition to hydrochloric acid, H.
After the serial dilution is completed, you will need to have of each concentration available to use.
Complete Fig. 1.1 to show how you will prepare your serial dilution.
Fig. 1.1 shows the beakers you will use.
For each beaker, add labelled arrows to show:
- the volume of hydrochloric acid transferred
- the volume of distilled water, W, added.
step 1 Prepare the concentrations of hydrochloric acid, as decided in (a)(i), in the beakers provided.
The different concentrations of hydrochloric acid will be put into wells cut into the agar.
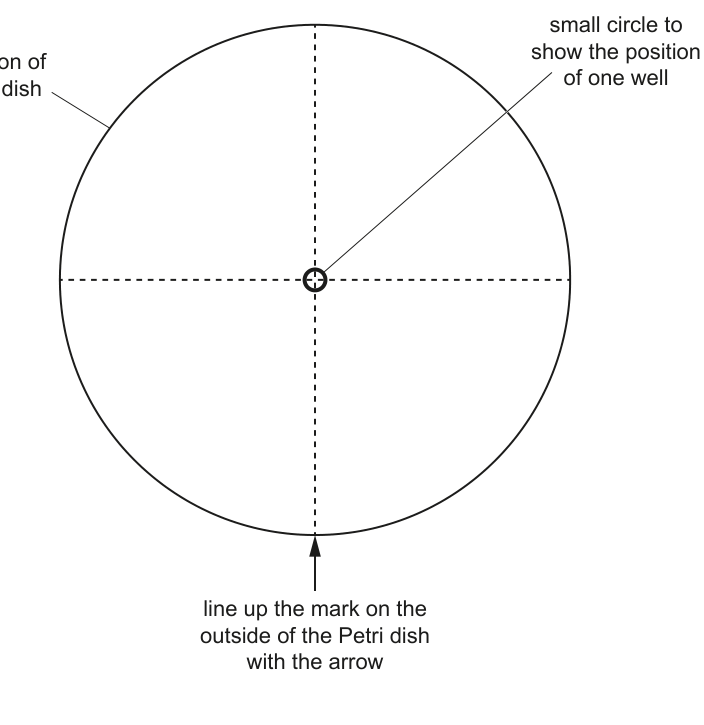
The position of one well is shown in Fig. 1.2.
You need to decide where to put four more wells in the agar in each Petri dish so that the wells are positioned away from each other and away from the edge of the Petri dish. Hydrochloric acid will diffuse into the agar around each well.
Complete Fig. 1.2 by:
- drawing four small circles to show where you have decided the wells should be positioned in the agar
- labelling the five small circles in Fig. 1.2 with the concentrations of hydrochloric acid you prepared in step 1.
Carry out step 2 to step 14.
step 2 Draw a mark on the outside edge of one of the Petri dishes containing agar.
step 3 Put the Petri dish on Fig. 1.2 so that the mark on the edge of the Petri dish lines up with the arrow in Fig. 1.2. Keep the Petri dish in this position over Fig. 1.2 for the whole of step 4.
step 4 Use a straw to cut wells in the agar at the positions of the small circles on Fig. 1.2:
- put the end of a straw on the surface of the agar over the centre small circle
- carefully push the straw into the agar
- lift up the straw to leave a well in the agar
- hold the straw over the container labelled For waste
- blow gently through the straw to remove the agar from the end of the straw
- if the small circle of agar is not lifted by the straw, use a scalpel or mounted needle to carefully remove the agar and put it in the container labelled For waste.
step 5 Remove the Petri dish from Fig. 1.2 and leave it for use in step 7.
step 6 Repeat step 2 to step 4 with the other Petri dish containing agar.
You are provided with sheet T for use in step 7 and step 8.
step 7 Put one of the Petri dishes on circle A on sheet T so that the mark on the edge of the Petri dish lines up with the arrow.
step 8 Put the other Petri dish on circle B on sheet T so that the mark on the edge of the Petri dish lines up with the arrow.
step 9 For each Petri dish, A and B, use a pipette to carefully put hydrochloric acid, H, into the appropriate well in the agar, as labelled in Fig. 1.2.
step 10 Repeat step 9 for the other concentrations of hydrochloric acid labelled in Fig. 1.2.
Do not move the Petri dishes after the wells have been filled with the hydrochloric acid.
step 11 Start timing.
Between step 11 and step 12, you will be leaving the Petri dishes on sheet T for 20 minutes.
Use this time to continue with other parts of Question 1.
step 12 After leaving the Petri dishes for 20 minutes, use a pipette to remove the hydrochloric acid from the wells in both Petri dishes. Put this hydrochloric acid into the beaker labelled For waste.
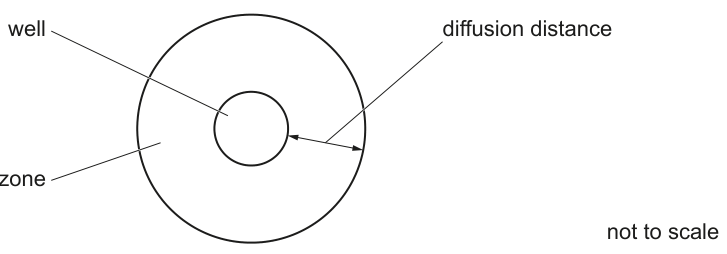
step 13 Measure the diffusion distance, as shown in Fig. 1.3, for each concentration of hydrochloric acid in both Petri dishes.
step 14 Record your results in (a)(iii).
Record your results in an appropriate table.
Calculate the rate of diffusion for hydrochloric acid, H.
Show your working and use appropriate units.
rate = ______
A student observed that the rate of diffusion was not constant during the investigation.
Suggest how the student could modify the procedure to investigate the change in the rate of diffusion.
A scientist studied the rate of absorption of the amino acid alanine through the wall of the small intestine.
A concentration gradient was maintained throughout the investigation and all other variables were kept constant.
The results are shown in Table 1.2.
Table 1.2
| percentage concentration of alanine | rate of absorption / |
|---|---|
| 5 | 300 |
| 14 | 950 |
| 30 | 1625 |
| 50 | 1750 |
| 70 | 1775 |
Plot a graph of the data shown in Table 1.2 on the grid in Fig. 1.4.
Use a sharp pencil.

Amino acids are transported into cells by facilitated diffusion.
Explain the shape of your graph in Fig. 1.4.
The rest of this paper
1 more questions- Q2Use of the Light Microscope · Analysis, Conclusions and Evaluation · Presentation of Data and Observations19M