Biology 9700/35 — October/November 2023
Cambridge AS Level · Advanced Practical Skills · worked solutions for every part, with the mark scheme
Topics Manipulation, Measurement and Observation · Presentation of Data and Observations · Analysis, Conclusions and Evaluation · Use of the Light Microscope
When potato cells are placed into different concentrations of sodium chloride solution, water moves between the sodium chloride solution and the potato cells.
You will investigate the effect of different concentrations of sodium chloride solution on potato tissue.
You will need to:
• prepare different concentrations of sodium chloride solution, S
• put potato tissue into the different concentrations of sodium chloride solution
• record the angle the potato tissue bends
• use your results to estimate the concentrations of unknown concentrations of sodium chloride solutions, U1 and U2.
You are provided with the materials shown in Table 1.1.
Table 1.1
| labelled | contents | hazard | volume / |
|---|---|---|---|
| P | 7 pieces of potato tissue | none | — |
| S | 10.0% sodium chloride solution | none | 200 |
| U1 | unknown concentration of sodium chloride solution | none | 50 |
| U2 | unknown concentration of sodium chloride solution | none | 50 |
| W | distilled water | none | 200 |
It is recommended that you wear suitable eye protection.
You will need to use proportional dilution to make five different concentrations of sodium chloride solution, S.
You will need to prepare of each concentration, using S and W.
Table 1.2 shows two of the concentrations you will use.
Decide which three other concentrations of sodium chloride solution you will use.
Complete Table 1.2 to show how you will prepare the other concentrations.
Table 1.2
| percentage concentration of sodium chloride | volume of S / | volume of W / |
|---|---|---|
| 10 | 50 | 0 |
| 0 | 0 | 50 |
Working
For each target concentration the volume of stock S needed is found from and the volume of water W is the remainder.
- 7.5%: of S, so of W.
- 5.0%: of S, so of W.
- 2.5%: of S, so of W.
Answer
| percentage concentration of sodium chloride | volume of S / | volume of W / |
|---|---|---|
| 10 | 50 | 0 |
| 7.5 | 37.5 | 12.5 |
| 5.0 | 25 | 25 |
| 2.5 | 12.5 | 37.5 |
| 0 | 0 | 50 |
7.5%: 37.5 cm³ S + 12.5 cm³ W; 5.0%: 25 cm³ S + 25 cm³ W; 2.5%: 12.5 cm³ S + 37.5 cm³ W
Background Concept
Proportional (or simple) dilution is the standard way to make a solution of a desired concentration from a more concentrated stock. The relationship is , where and are the concentration and volume of the stock solution (S, 10.0%) and and are the target concentration and the final volume prepared (here ). The rest of the volume is made up with solvent (distilled water W).
Choosing the intermediate concentrations carefully matters: evenly spaced values (7.5, 5.0, 2.5%) make plotting angle against concentration easy and make it simple to interpolate between the points later when estimating the unknown concentrations U1 and U2.
Understanding the Question
You are asked to complete Table 1.2 so that it shows how to prepare three further concentrations of sodium chloride solution (besides the 10% and 0% already given) using proportional dilution of S with W in lots. The mark scheme expects the concentrations to be 7.5%, 5.0% and 2.5%, and each row's volumes must sum to .
Approach
For each target concentration, calculate the volume of stock needed using , then subtract from to obtain the volume of water. List the rows in descending concentration order so the table reads naturally from 10% down to 0%.
Step-by-Step Reasoning
- 7.5%: ; .
- 5.0%: ; .
- 2.5%: ; .
These three rows slot between the 10% and 0% rows already in Table 1.2. Notice that always equals , e.g. for 7.5% the ratio is , giving .
Key Takeaways
- Proportional dilution with a fixed final volume is the easiest way to make several related concentrations from one stock.
- Equally spaced concentrations (7.5, 5.0, 2.5) are the convention expected by the mark scheme and are the easiest to plot and interpolate.
- must always equal the target final volume.
Common Mistakes
- Using non-equally-spaced concentrations such as 8, 6, 4 or 6, 4, 2 — the mark scheme requires 7.5, 5.0 and 2.5.
- Inverting the calculation so that is calculated from the formula instead of .
- Rounding and to whole numbers — the half-cm³ values are required.
- Forgetting to keep the volumes adding up to .
Things to Be Careful About
- Use a measuring cylinder for both S and W to obtain accurate volumes.
- Label each beaker clearly with its percentage concentration before pouring, to avoid mix-ups during step 3.
Carry out step 1 to step 16.
step 1 Label five beakers with the percentage concentrations of sodium chloride solution stated in Table 1.2.
step 2 Prepare the concentrations of sodium chloride solution, stated in Table 1.2, in the beakers labelled in step 1.
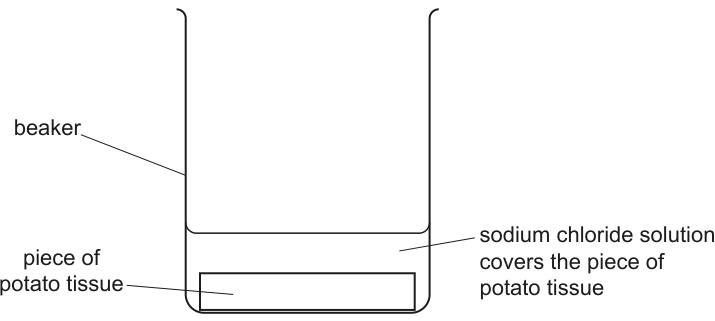
step 3 Put a piece of potato tissue into each of the beakers you labelled in step 1, as shown in Fig. 1.1.
step 4 Put a piece of potato tissue into each of the beakers labelled U1 and U2, as shown in Fig. 1.1.
step 5 Start timing.
step 6 Leave the pieces of potato tissue in the sodium chloride solutions for 20 minutes.
While you are waiting, use your time to continue with other parts of Question 1.
You are provided with two sheets of A4 paper, each showing four protractors.
Do not cut these into separate protractors. Do not remove them from the plastic covering.
You will use the protractors to measure the angle the pieces of potato tissue bend after being left for 20 minutes in the sodium chloride solutions.
step 7 After 20 minutes (step 6) remove the piece of potato tissue from the 10.0% sodium chloride solution and put it onto a paper towel to remove the excess liquid.
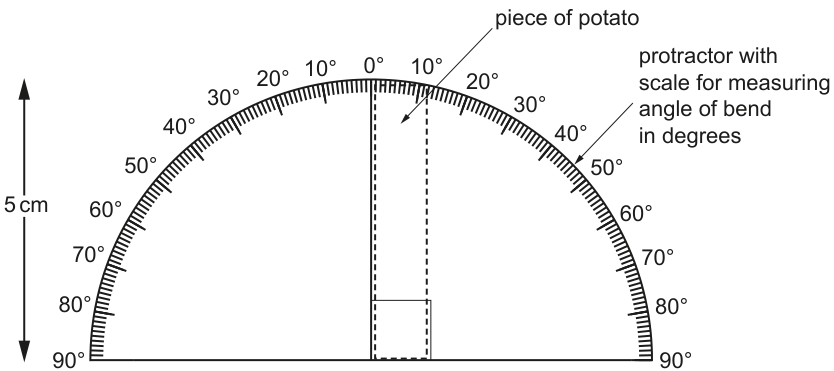
step 8 Put the piece of potato tissue on the vertical line of a protractor, as shown in Fig. 1.2.
step 9 Put your finger on the bottom of the potato tissue and press firmly, as shown in Fig. 1.3. Hold the potato tissue firmly in this position.
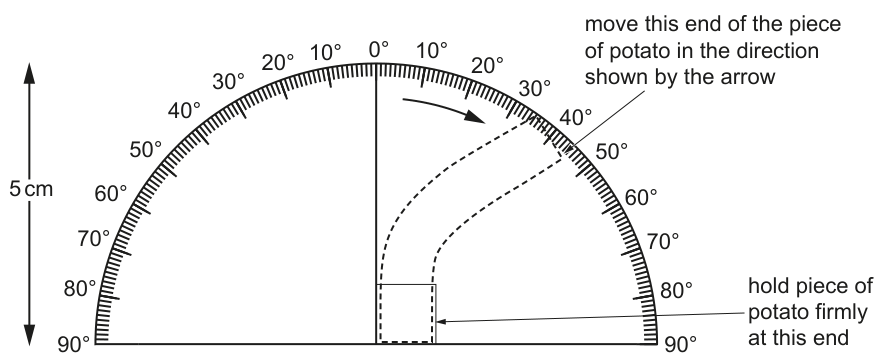
step 10 Move the top of the potato tissue, as shown in Fig. 1.3, until there is strong resistance.
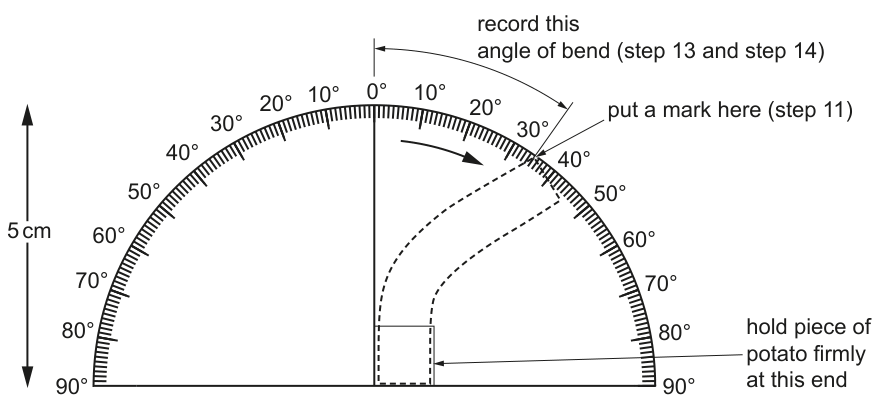
step 11 Mark the position of the top of the potato tissue on the protractor, as shown in Fig. 1.4.
step 12 Remove the potato tissue and put it in the container labelled For waste.
step 13 Measure the angle between the mark and the vertical line on the protractor, as shown in Fig. 1.4.
step 14 Record your result in (a)(ii).
step 15 Repeat step 7 to step 14 using the potato tissue from the other concentrations of sodium chloride solution prepared in step 2.
step 16 Repeat step 7 to step 13 using the potato tissue from U1 and U2. Record your result for U1 and for U2 in (a)(iv).
Record your results in an appropriate table.
Answer
Representative table (the candidate's own measured angles replace the example values shown):
| percentage concentration of sodium chloride | angle of bend / ° |
|---|---|
| 10.0 | 80 |
| 7.5 | 60 |
| 5.0 | 45 |
| 2.5 | 25 |
| 0.0 | 5 |
| U1 | 50 |
| U2 | 30 |
Conventions illustrated:
- Independent-variable heading first ('percentage concentration of sodium chloride');
- Dependent-variable heading second ('angle of bend / °');
- Units in the heading only — none in the body of the table;
- The 0% (distilled water) sample gives the smallest angle of bend.
Table with IV heading first, DV heading second; angles decrease with decreasing concentration; 0% gives the smallest angle of bend.
Background Concept
Practical-skills tables must follow conventions that allow the reader to read the data unambiguously: the independent variable (the one you deliberately changed — here, percentage concentration of sodium chloride) goes first, the dependent variable (the one you measured — here, the angle of bend) goes second, units appear in the heading and not in the body of the table, and all rows in a column share the same number of decimal places.
In this experiment, the bending of the potato tissue arises because the cells on one side of the piece lose (or gain) water by osmosis at a different rate from those on the other side, causing the tissue to curve. The greater the difference between the external solution's water potential and the cell sap's water potential, the more water moves and the larger the bend.
Understanding the Question
The instructions in steps 14 and 16 ask you to record, after 20 minutes, the angle that each potato piece makes on the protractor. Step 15 says to repeat for every prepared concentration; step 16 repeats for U1 and U2. The final instruction — 'Record your results in an appropriate table' — applies to everything.
The marks reward:
- the independent-variable heading first ('percentage concentration of sodium chloride');
- the dependent-variable heading second ('angle of bend / °' with the degree symbol so units are not repeated in the body);
- results for every concentration including U1 and U2;
- the observation that the 0% (distilled water) sample gives the smallest angle of bend.
Approach
Decide on the table layout (concentration column on the left, angle column on the right), include seven rows (five prepared concentrations plus U1 and U2), and ensure the angle column reflects the expected pattern: highest concentration → largest angle, lowest concentration → smallest angle.
Step-by-Step Reasoning
- In 10% sodium chloride the cell sap is much more dilute than the external solution, so cells lose a lot of water and the tissue curves strongly. Example value: ~80°.
- As concentration falls, less water leaves the cells (or, below the cell sap concentration, water enters), so the angle gets smaller.
- In 0% (distilled water) the cells gain water and the tissue stays nearly straight. Example value: ~5°.
- U1 sits between two of the known concentrations — its angle should likewise be between theirs; with the example above, ~50°.
- U2 should give a smaller angle than U1, indicating a lower concentration.
Key Takeaways
- IV heading first, DV heading second, units in the heading only — the standard convention.
- The expected biological pattern: angle of bend decreases as NaCl concentration decreases.
- A correctly formatted table is the first step to interpreting or interpolating later.
Common Mistakes
- Putting the units in the body of the table (e.g. '50°' instead of just '50' under 'angle of bend / °').
- Reversing the order of the columns so that DV appears first.
- Using degrees but writing the symbol as 'o' instead of '°'.
- Not including the 0% row, or recording 0% with a non-zero angle larger than the others.
Things to Be Careful About
- Read each angle to the nearest 5° from the protractor (or 1° if your protractor has 1° divisions).
- After step 13, double-check that the mark you made is at the position of the top of the tissue after the firm press.
- Use the same side of the protractor (left or right) consistently.
State the independent variable.
Answer
Concentration of sodium chloride (solution).
concentration of sodium chloride
Background Concept
The independent variable is the factor that the experimenter deliberately changes from one treatment to the next, so that its effect on the dependent variable can be observed. The dependent variable is the factor that is measured; controlled (or standardised) variables are kept the same to ensure a fair test.
In this investigation you prepared five different concentrations of sodium chloride solution (10, 7.5, 5.0, 2.5 and 0%) and put a piece of potato tissue into each. You then measured the resulting angle of bend. The thing you chose to change is therefore the concentration of the sodium chloride solution.
Understanding the Question
The command word is 'state', which means a one-line factual answer. The mark scheme accepts 'concentration of sodium chloride' as sufficient.
Approach
Identify which quantity has a different value in each row of your results table — that is your independent variable.
Step-by-Step Reasoning
The five prepared concentrations differ from one another only in the percentage of sodium chloride. Therefore the percentage (or concentration) of sodium chloride is the independent variable. The angle of bend is the dependent variable; the volume of solution, the size of the potato pieces, the temperature and the timing are all standardised.
Key Takeaways
- Independent variable = the one you deliberately change.
- Dependent variable = the one you measure.
- Standardised variables = the ones you keep the same.
Common Mistakes
- Confusing the independent variable with the dependent variable and answering 'angle of bend'.
- Saying 'amount of sodium chloride' rather than 'concentration' — 'concentration' is the precise term.
Things to Be Careful About
- Avoid 'strength' or 'dilution' in place of 'concentration' — these are imprecise.
State the result for U1 and U2.
result for U1 = ______
result for U2 = ______
Answer
(Example values based on representative data — the candidate records their own measured angles.)
result for U1 = 50°
result for U2 = 30°
The angle of bend for U2 is smaller than the angle of bend for U1.
U2 angle < U1 angle (e.g. U1 = 50°, U2 = 30°)
Background Concept
A simple comparison observation is required: which of the two unknowns produces the larger angle of bend after 20 minutes in the solution. The mark scheme credits stating that U2 is smaller than U1 (which is the biological pattern you would expect, given the inverse relationship between NaCl concentration and water potential).
Understanding the Question
You must record your two measured angles and compare them. The question is structured so that you state the angle for U1, the angle for U2 and the comparison between them. The candidate's own measured angles are accepted as long as the comparison is correct.
Approach
After measuring the angles, fill in the blanks. Then state the comparison clearly: U2 has a smaller angle than U1 (or vice versa, depending on what you actually observed). The mark scheme requires U2 smaller than U1, so the experiment is designed so that this is the expected result.
Step-by-Step Reasoning
The biology predicts that a solution with a higher NaCl concentration will cause cells to lose more water by osmosis, making the potato tissue bend more sharply. If U2 is the more dilute solution, it should produce a smaller angle of bend than U1. The expected pattern (and the pattern the mark scheme credits) is therefore: angle(U2) < angle(U1).
Key Takeaways
- The angle of bend is an indirect measure of how much water the cells lost.
- Larger angle → cells lost more water → external solution was more concentrated.
Common Mistakes
- Recording the angles but not stating the comparison.
- Reversing the comparison so that U1 < U2 (this loses the mark).
Things to Be Careful About
- Make sure you keep track of which beaker is U1 and which is U2 — labelling them at the start is essential.
Use your results in (a)(ii) to estimate the concentration of sodium chloride in U1 and U2.
estimate of U1 = ______
estimate of U2 = ______
Answer
Method: identify the two prepared concentrations whose angles bracket the angle for U1 (or U2), then linearly interpolate between them.
(Example estimates using the representative table values:)
For U1 = 50° (between 7.5% / 60° and 5.0% / 45°):
For U2 = 30° (between 5.0% / 45° and 2.5% / 25°):
overall:
estimate of U1 ≈ 5.8 %
estimate of U2 ≈ 3.1 %
(Estimates depend on the candidate's own measured angles and may differ slightly.)
Estimates depend on candidate's own results, e.g. U1 ≈ 5.8%, U2 ≈ 3.1%
Background Concept
Because the angle of bend varies smoothly with NaCl concentration in this experiment, the unknown concentrations can be estimated by interpolation: reading off the concentration that corresponds to the measured angle, using the two known concentrations that bracket the unknown's angle. Linear interpolation assumes the relationship is straight between the two bracketing points — a reasonable approximation when concentrations are evenly spaced and the angle varies approximately linearly over that small range.
Understanding the Question
You are asked to use the table of prepared concentrations and angles to estimate the concentration of sodium chloride in U1 and U2. Your answer must be based on your own measurements — the mark scheme says 'correct estimate ... based on candidate's results'.
Approach
- Identify which two prepared concentrations give angles just above and just below the angle for U1 (or U2).
- Assume the angle varies linearly between those two prepared concentrations.
- Apply linear interpolation to estimate the concentration.
Step-by-Step Reasoning
For U1 with the example angle 50°:
- 7.5% gave 60° and 5.0% gave 45° — these bracket 50°.
- Interpolating: 50° is 10/15 ≈ 0.667 of the way from 7.5% down to 5.0%.
- So estimate = 7.5 − 0.667 × 2.5 ≈ 5.8%.
For U2 with the example angle 30°:
- 5.0% gave 45° and 2.5% gave 25° — these bracket 30°.
- 30° is 15/20 = 0.75 of the way from 5.0% down to 2.5%.
- So estimate = 5.0 − 0.75 × 2.5 ≈ 3.1%.
Key Takeaways
- Interpolation is the right method when values lie between two known reference points.
- The estimates depend on the candidate's own measured angles, so the actual numbers will vary.
- Equally spaced prepared concentrations make interpolation easy.
Common Mistakes
- Estimating from only one adjacent point instead of bracketing the value between two.
- Extrapolating beyond 0% or 10% — this is not supported by the data and should not be credited.
- Treating the relationship as non-linear (it does deviate slightly, but linear interpolation is acceptable over the small range used here).
Things to Be Careful About
- Use the closest two bracketing concentrations for accuracy.
- If your angles are very different from the example above, your estimates will be too — that is fine, as long as the method is correct.
Explain, in terms of water potential, the difference between the result for U1 and the result for U2.
Answer
- U1 has a lower (more negative) water potential than U2.
- Therefore more water moved out of the potato cells/tissue placed in U1 than out of the tissue placed in U2.
- This happened by osmosis, with water moving down its water-potential gradient from the cell sap (higher Ψ) into the external solution (lower Ψ).
U1 has a lower water potential than U2; more water moved out of the U1 potato tissue by osmosis than out of the U2 tissue.
Background Concept
Water potential (Ψ) is a measure of the tendency of water to move from one place to another. Pure water has Ψ = 0 kPa. Adding solute lowers Ψ (makes it more negative). Water moves by osmosis from a region of higher (less negative) water potential to a region of lower (more negative) water potential, across a partially permeable membrane such as the plant cell surface membrane.
In a plant cell, the cell sap (inside the vacuole) contains dissolved salts, sugars and other solutes, so its water potential is negative. If the external solution is more concentrated (more negative Ψ) than the cell sap, water leaves the cell, the protoplast shrinks and the membrane pulls away from the wall — plasmolysis. If the external solution is more dilute than the cell sap, water enters the cell and the protoplast presses harder against the wall — turgidity.
Understanding the Question
You measured that the U1 tissue bent more than the U2 tissue. You must explain the biological reason for this difference, using water potential and osmosis (the command word is 'explain'). The mark scheme wants three points, in any order:
- U1 has a lower water potential than U2 (ora — reverse argument allowed).
- More water moved out of the potato tissue in U1 than in U2 (ora).
- By osmosis.
Approach
Translate the observation (larger angle for U1) into a statement about water movement, then tie the water movement to a difference in water potential, and name the process.
Step-by-Step Reasoning
- A larger angle of bend means more water has left the cells (or, more correctly, has moved asymmetrically across the tissue), causing greater shrinkage on one side.
- More water leaves the cells of the U1 tissue than of the U2 tissue.
- This happens because U1 has a lower water potential than U2 (it is a more concentrated sodium chloride solution).
- Water therefore moves by osmosis down its water-potential gradient, from the higher-Ψ cell sap into the lower-Ψ external solution.
- The reverse argument is equally valid in principle: if U2 had a lower water potential, more water would leave the U2 tissue, but the mark scheme is written expecting the relationship above.
Key Takeaways
- Osmosis is the passive movement of water down a water-potential gradient through a partially permeable membrane.
- A more concentrated solution has a lower (more negative) water potential.
- In this experiment, the angle of bend is an indirect measure of how much water has left the cells.
Common Mistakes
- Saying 'water moves from low to high concentration' — it moves from high to low water potential (which is the opposite direction of solute movement).
- Calling it 'diffusion' rather than 'osmosis' — the membrane is partially permeable, so osmosis is the precise term.
- Saying 'U1 has a higher concentration of water' (this is not a meaningful statement; solutions have solutes, not 'more water').
- Forgetting the third marking point (naming osmosis).
Things to Be Careful About
- 'Lower' water potential can be read as 'more negative' — both phrasings are correct.
- Don't use 'strength' or 'amount' instead of 'concentration'.
Suggest how you could make improvements to the procedure so that a more accurate estimate of the concentration of sodium chloride in U1 and U2 could be obtained.
Answer
Any three of:
- Prepare a narrower range of stated concentrations either side of the estimates for U1 and U2 (so the angle for the unknown is closer to one of the prepared values, reducing interpolation error).
- Measure the mass of the potato tissue before and after soaking, rather than measuring the angle of bend (mass gives a more precise, objective measure).
- Do each test one at a time (so all pieces are timed identically from the moment they are placed in the solution, instead of being set up in sequence with a time-lag between them).
- Repeat the whole experiment several times and calculate the mean (to reduce random error).
- Cut the potato pieces to the same dimensions before soaking (to standardise the surface area to volume ratio).
- Use a method that applies the same force to each potato piece when bending it on the protractor (e.g. a fixed weight applied for the same time, instead of variable finger pressure).
Any three credible improvements, e.g. narrower range around the estimates; measure mass change instead of angle; cut pieces to identical dimensions.
Background Concept
Improvements to an experiment fall into four broad categories: (i) standardising variables that were poorly controlled, (ii) using a more precise measurement technique, (iii) increasing replication to reduce random error, and (iv) refining the range of the independent variable to suit the unknowns better. The mark scheme lists seven valid points and asks for any three.
Understanding the Question
You observed that the angle of bend is a fairly crude measure — bending a piece of potato tissue with your finger is subjective, the cut pieces may not be identical, and the prepared concentrations span a wide range, so estimating unknowns in between requires long-range interpolation. The marks reward any three suggestions that address these weaknesses.
Approach
Pick three from the mark scheme's seven points; the choice depends on which weakness you consider most important. The most often credited are: same dimensions, same force, repeat and mean, measure mass instead of angle, and narrower concentration range.
Step-by-Step Reasoning
- The potato pieces are likely to vary in length and thickness; cutting them to the same dimensions standardises surface area to volume ratio so that the rate of osmosis is comparable.
- The 'firm finger press' varies between trials; substituting a controlled weight or a defined force gives the same mechanical input each time.
- Mass change is much more precise (a balance reads to 0.01 g) and avoids the subjectivity of the angle measurement.
- Repeating and averaging reduces the effect of one-off variation in tissue or timing.
- A narrower range of prepared concentrations (e.g. 4, 5, 6, 7% if U1 ≈ 5.8% and U2 ≈ 3.1%) reduces the interpolation error when estimating.
Key Takeaways
- Improvements should target a specific weakness in the procedure, not be vague.
- Avoid the stock answer 'human error' — say what the human error affects and how to remove it.
Common Mistakes
- 'Be more careful' — too vague; specify what is being controlled.
- 'Use more accurate equipment' — also vague; name the equipment.
- 'Repeat once' — repeats alone do not help unless you calculate a mean and look for anomalies.
- Suggesting improvements that are impractical (e.g. 'use a spectrometer' is not relevant to this procedure).
Things to Be Careful About
- Each suggestion must be actionable and specific to this experiment.
A scientist measured the concentration of sodium chloride in extracts from different vegetables.
The results are shown in Table 1.3.
Table 1.3
| type of vegetable extract | concentration of sodium chloride / |
|---|---|
| green beans (GB) | 3 |
| cauliflower (CA) | 33 |
| celery (CE) | 115 |
| broccoli (BR) | 89 |
| green cabbage (GC) | 20 |
Draw a bar chart of the data in Table 1.3 on the grid in Fig. 1.5. Use a sharp pencil.

Answer
The bar chart should have:
- y-axis labelled 'concentration of sodium chloride / ' with a scale in which 20 mg occupies 2 cm, labelled every 2 cm (i.e. 0, 20, 40, 60, 80, 100, 120);
- x-axis labelled 'type of vegetable extract' with five evenly spaced, evenly wide bars labelled GB, CA, CE, BR and GC;
- bar heights: GB = 3, CA = 33, CE = 115, BR = 89, GC = 20;
- five separate bars (small gaps between), with horizontal and vertical lines joined precisely, drawn with a sharp pencil.
Bar chart with concentration on the y-axis (0–120 mg 100 cm⁻³, 20 mg = 2 cm) and vegetable on the x-axis: GB = 3, CA = 33, CE = 115, BR = 89, GC = 20
Background Concept
A bar chart is the right format for categorical (discrete) data — here, five named vegetables. The independent variable (vegetable type) goes on the x-axis; the dependent variable (sodium chloride concentration) goes on the y-axis. Each bar starts at zero on the y-axis (a bar chart must not have a broken axis) and has equal width with even gaps between bars.
Bar-chart conventions:
- y-axis label includes the unit;
- the scale uses most of the grid (mark scheme: 20 mg to 2 cm — so 120 mg would span 12 cm of grid);
- bars drawn with a sharp pencil, lines joined precisely;
- bars are separate, not joined as a histogram.
Understanding the Question
You are given Table 1.3 with five values and asked to draw the bar chart on the grid in Fig. 1.5. The marks are for axis labels, scale, plotting accuracy and presentation.
Approach
- Choose the y-axis scale so that the largest value (115) fits comfortably. With '20 mg to 2 cm', a scale of 0–120 fits the grid (12 cm) and gives even labelled intervals (0, 20, 40, 60, 80, 100, 120).
- Mark five evenly spaced categories on the x-axis.
- Draw each bar to the correct height, using a sharp pencil.
Step-by-Step Reasoning
Bar heights in cm (with the 20 = 2 cm rule):
- GB = 3 → 0.3 cm
- CA = 33 → 3.3 cm
- CE = 115 → 11.5 cm
- BR = 89 → 8.9 cm
- GC = 20 → 2.0 cm
The CE bar (celery) is by far the tallest; GB is the shortest.
Key Takeaways
- Bar charts (not histograms) are for categorical data with a non-numeric x-axis.
- '20 mg to 2 cm' means each 20 units of concentration occupies 2 cm of grid, so 120 units occupies 12 cm.
- Use a sharp pencil so that horizontal/vertical lines are joined precisely.
Common Mistakes
- Plotting a histogram (touching bars) instead of a bar chart with gaps.
- Using the abbreviations incorrectly (e.g. GG instead of GB).
- Forgetting the unit on the y-axis label.
- Choosing an awkward scale (e.g. 0–120 with no labelled intermediate values).
Things to Be Careful About
- Take the y-axis labels up to at least the highest value (≥120).
- Mark intervals at convenient round numbers (every 20 in this case).
The scientist then placed pieces of plant tissue from each of the vegetables in Table 1.3 into sodium chloride solution. The dimensions of the pieces of plant tissue were standardised.
The plant tissues were left in the solution for 1 hour.
The scientist then observed the cells in these tissues using a microscope.
The scientist noted that, in many of the plant tissues, there were many plasmolysed cells. For one tissue there were no plasmolysed cells on the slide.
Using this information and Table 1.3, suggest which vegetable resulted in no plasmolysed cells.
vegetable = ______
Answer
vegetable = celery.
The external sodium chloride concentration in the experiment is . Plasmolysis only occurs when the cell sap has a lower solute concentration than the external solution (so water leaves the cells). Celery extract is the only one in Table 1.3 with a concentration greater than (it is ), so its cells would not plasmolyse — they would either remain unchanged or take up water slightly. The other four vegetables (GB 3, CA 33, BR 89, GC 20) all have lower cell-sap concentrations than the external solution, so their cells would lose water and plasmolyse.
celery
Background Concept
Plasmolysis is the visible shrinkage of the plant-cell protoplast away from the cell wall when the cell loses water by osmosis. It occurs when the external solution has a lower water potential (i.e. a higher solute concentration) than the cell sap. In a microscope field, plasmolysed cells show the membrane pulled away from the wall.
Understanding the Question
Tissues from each of the five vegetables in Table 1.3 were placed in sodium chloride solution for 1 hour. In most tissues many plasmolysed cells were observed; in one tissue no plasmolysed cells were seen. You must identify the tissue where no plasmolysis occurred, using Table 1.3.
Approach
For each vegetable, compare its cell-sap concentration to the external concentration (100 mg / 100 cm³). If the cell-sap concentration is less than the external concentration, the cells will lose water and plasmolyse. If it is greater than (or equal to) the external concentration, water will not leave the cells (or will even enter), so plasmolysis will not occur.
Step-by-Step Reasoning
- GB (3 mg) < 100 → cells lose water → plasmolysis.
- CA (33 mg) < 100 → plasmolysis.
- CE (115 mg) > 100 → cells do not lose water → no plasmolysis.
- BR (89 mg) < 100 → plasmolysis.
- GC (20 mg) < 100 → plasmolysis.
Only celery has a cell-sap concentration above the external threshold.
Key Takeaways
- Plasmolysis occurs when the external solution is more concentrated than the cell sap.
- Compare both sides of the membrane in terms of solute concentration (or, equivalently, water potential).
- The threshold for the comparison in this experiment is .
Common Mistakes
- Picking the vegetable with the lowest concentration (most plasmolysis), not the highest.
- Confusing 'concentration of extract' with 'concentration in solution'.
- Saying the cells would burst — plant cells have rigid walls so they do not burst; they may just become more turgid.
Things to Be Careful About
- The threshold is , not 100 mg per cm³ or 100%.
The rest of this paper
1 more questions- Q2Use of the Light Microscope · Analysis, Conclusions and Evaluation · Manipulation, Measurement and Observation · Presentation of Data and Observations19M