Biology 9700/31 — October/November 2023
Cambridge AS Level · Advanced Practical Skills · worked solutions for every part, with the mark scheme
Topics Analysis, Conclusions and Evaluation · Manipulation, Measurement and Observation · Presentation of Data and Observations · Use of the Light Microscope
You will investigate the effect of temperature on the production of carbon dioxide gas by yeast cells.
Yeast cells contain enzymes that break down glucose to release carbon dioxide and ethanol as shown in Fig. 1.1.

Fig. 1.1
You are provided with the materials shown in Table 1.1.
Table 1.1
| labelled | contents | hazard | volume / |
|---|---|---|---|
| Y | yeast cell suspension | none | 100 |
| G | glucose solution | none | 20 |
| H | hydrogencarbonate indicator | harmful irritant | 15 |
If any solution comes into contact with your skin, wash off immediately under cold water.
It is recommended that you wear suitable eye protection.
You will need to:
- maintain samples of a yeast cell suspension at different temperatures
- count the number of bubbles of carbon dioxide produced.
Decide which temperatures you will use for your investigation. These temperatures should be below .
State the temperatures that you will use in your investigation.
Carry out step 1 to step 9.
step 1 Use the beakers labelled water-bath, hot water and cold water to set up and maintain a water-bath at the highest temperature you stated in (a)(i). The temperature of the water-bath must be maintained.
step 2 Stir the yeast cell suspension, Y, and put of Y into the large test-tube.
step 3 Add of glucose solution, G, to the large test-tube and mix well.
step 4 Set up the apparatus as shown in Fig. 1.2.
You will use the same test-tube of hydrogencarbonate indicator for each trial.
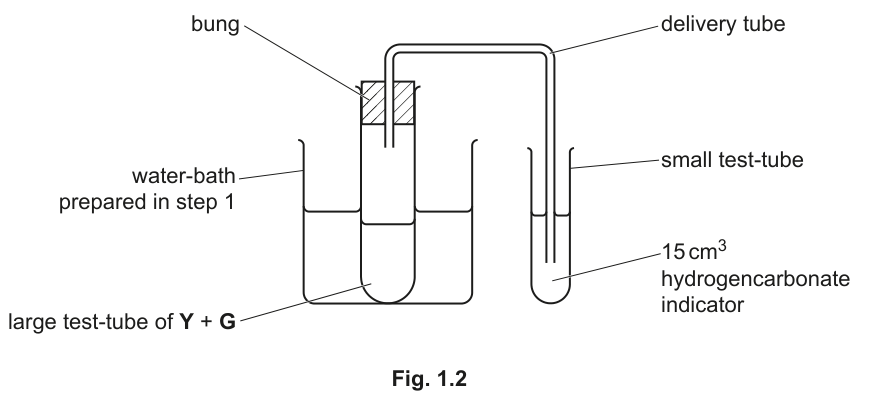
Fig. 1.2
step 5 Start timing and leave the apparatus for 60 seconds.
step 6 After 60 seconds, start counting the number of bubbles produced during the next 60 seconds.
Record your result in (a)(ii).
step 7 Take the large test-tube out of the water-bath and remove the bung and delivery tube. Pour the contents of the large test-tube into the container labelled For Waste.
step 8 Adjust the temperature of the water-bath to the next highest temperature you stated in (a)(i).
step 9 Repeat step 2 to step 8 until you have tested all the temperatures stated in (a)(i).
Record your results in an appropriate table.
State the dependent variable in this investigation.
Observe the final colour of the hydrogencarbonate indicator.
State the final colour of the hydrogencarbonate indicator ______
Suggest one conclusion from your observation in (a)(iv).
Identify one source of error in the procedure. Suggest an improvement to reduce this source of error.
error ______
improvement ______
A student investigated the effect of copper ions on the growth of yeast cells.
Six yeast suspensions were made. For each suspension, of yeast was added to a nutrient solution. Different concentrations of copper ions were added to each yeast suspension. The mass of yeast in each suspension was measured after 24 hours.
The results are shown in Table 1.2.
Table 1.2
| concentration of copper ions / parts per million (ppm) | mass of yeast / g |
|---|---|
| 0.00 | 19.4 |
| 0.10 | 21.2 |
| 0.25 | 5.6 |
| 0.50 | 2.0 |
| 0.75 | 0.8 |
| 1.00 | 0.4 |
Plot a graph of the data shown in Table 1.2 on the grid in Fig. 1.3.
Use a sharp pencil.
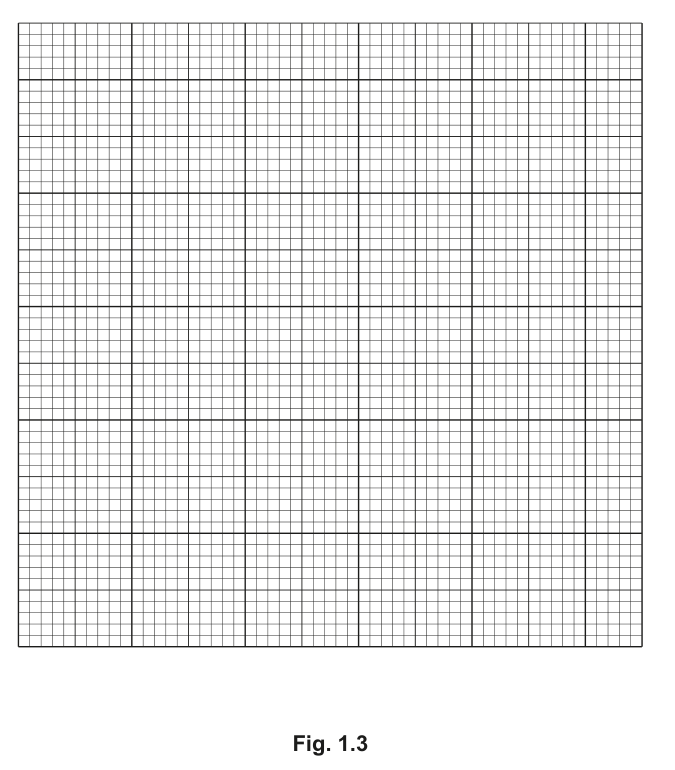
Fig. 1.3
Use your graph in Fig. 1.3 to estimate the concentration of copper ions that would result in a mass of of yeast cells.
Show on your graph how you obtained your answer.
concentration of copper ions = ______
Copper ions act as non-competitive inhibitors for some enzymes.
Suggest an explanation for the results shown in your graph in Fig. 1.3.
Until the 1930s, most commercial fermenting equipment for growing yeast cells was made of copper. After this time, fermenting equipment was made using stainless steel instead of copper.
Use your graph in Fig. 1.3 to suggest why stainless steel was used instead of copper.
The rest of this paper
1 more questions- Q2Use of the Light Microscope · Analysis, Conclusions and Evaluation19M