Biology 9700/35 — May/June 2023
Cambridge AS Level · Advanced Practical Skills · worked solutions for every part, with the mark scheme
Topics Manipulation, Measurement and Observation · Presentation of Data and Observations · Analysis, Conclusions and Evaluation · Use of the Light Microscope
You will be investigating the effect of salt concentration on the movement of water in potatoes.
You are provided with the materials shown in Table 1.1.
Table 1.1
| labelled | contents | hazard | volume / |
|---|---|---|---|
| P | 5 lengths of potato | none | — |
| W | distilled water | none | 150 |
| S | salt solution | none | 150 |
It is recommended that you wear suitable eye protection.
You will need to make different concentrations of salt solution using proportional dilution of the salt solution, S.
You will need to prepare of each concentration.
Table 1.2 shows two of the concentrations you will use.
Decide which other concentrations of salt solution you will use.
Complete Table 1.2 to show how you will prepare the other concentrations.
Table 1.2
| final concentration of salt solution / | volume of S / | volume of distilled water, W / |
|---|---|---|
| 1.00 | 40 | 0 |
| 0.00 | 0 | 40 |
Carry out step 1 to step 11.
step 1 Prepare the concentrations of salt solution, as shown in Table 1.2, in the beakers provided.
step 2 Cut 10 discs of potato for each of the concentrations prepared in step 1.
Each disc should be approximately thick.
step 3 Place 10 discs in a line as shown in Fig. 1.1.
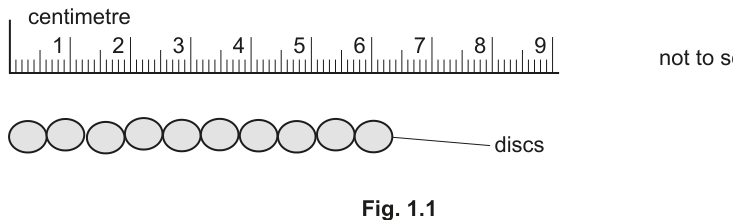
step 4 Measure the total length of the 10 discs and record this value in 1(a)(ii).
step 5 Put the 10 discs into the beaker containing salt solution.
step 6 Repeat step 3 to step 5 with the other discs and the salt solutions you prepared in step 1.
step 7 Start timing and leave for 30 minutes.
Use this time to continue with other parts of Question 1.
step 8 After 30 minutes (step 7), discard the salt solution from around the discs and tip the discs onto some paper towel.
step 9 Place the 10 discs in a line as in Fig. 1.1 and measure their total length. Record this value in 1(a)(ii).
step 10 Repeat step 8 and step 9 for the other salt concentrations.
step 11 Calculate the change in length for each line of 10 discs.
Record your results in an appropriate table, including raw results and processed results.
Explain your results for the salt solution (distilled water).
Suggest why a line of 10 discs was measured instead of a single disc.
Identify one significant source of error in this investigation.
Use your results to estimate a salt concentration where there is no net movement of water into or out of the potato.
salt concentration = ______
Describe two improvements to your procedure that would make the estimate in 1(a)(vi) more accurate.
1 ______
2 ______
The salt content of unprocessed food was measured.
The values are shown in Table 1.3.
Table 1.3
| food type | salt content of unprocessed food / mg per 100 g food |
|---|---|
| potatoes (P) | 10.0 |
| tuna (T) | 40.0 |
| bran (B) | 25.0 |
| chicken (C) | 50.0 |
| salmon (S) | 95.0 |
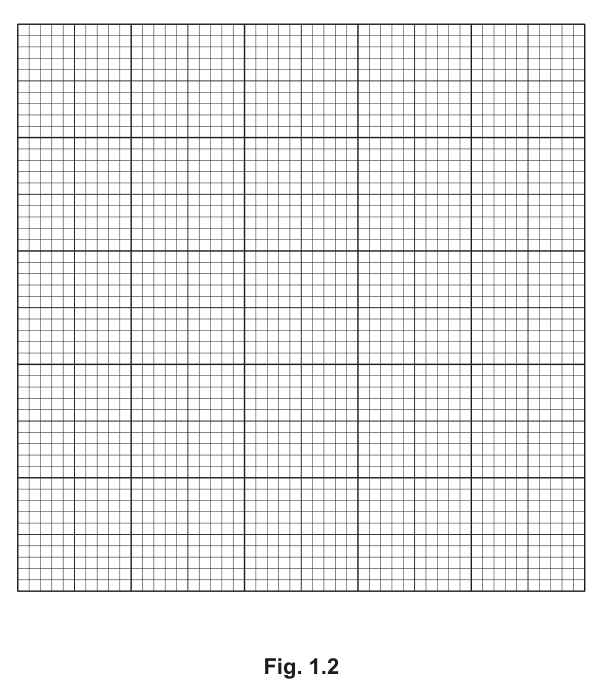
Plot a bar chart of the data shown in Table 1.3 on the grid in Fig. 1.2.
Use a sharp pencil.
The salt content of the same foods that had been processed was also measured.
The values are shown in Table 1.4.
Table 1.4
| food type | salt content of processed food / mg per 100 g food |
|---|---|
| potatoes (P) | 200.0 |
| tuna (T) | 300.0 |
| bran (B) | 1000.5 |
| chicken (C) | 350.5 |
| salmon (S) | 1800.0 |
Calculate the percentage increase in salt content when salmon is processed.
Show your working and write your answer to two significant figures.
increase in salt content = ______
State the independent variable in this study.
The rest of this paper
1 more questions- Q2Use of the Light Microscope19M